Economic Development Strategy 2021-2026 - FOR THE SHIRE OF BROOME
←
→
Page content transcription
If your browser does not render page correctly, please read the page content below
Economic Development
Strategy 2021-2026
FOR THE SHIRE OF BROOME
PREPARED BY                                                  PREPARED FOR
RPS                                                          Shire of Broome
Mark Wallace                                                 PO Box 44
Director - Strategy and Investment                           Broome WA 6725
(Economics)
Level 2/27-31 Troode St,                                     T (08) 9191 3456
West Perth WA 6005
                                                             E shire@broome.wa.gov.au
                                                             W www.broome.wa.gov.au
T   (08) 9211 1111
E   mark.wallace@rpsgroup.com.au

This report was prepared by RPS within the terms of RPS’ engagement with its client and in direct response to
a scope of services. This report is supplied for the sole and specific purpose for use by RPS’ client. The report
does not account for any changes relating the subject matter of the report, or any legislative or regulatory
changes that have occurred since the report was produced and that may affect the report. RPS does not
accept any responsibility or liability for loss whatsoever to any third party caused by, related to or arising out
of any use or reliance on the report.
Economic Development Strategy 2021-2026 for the Shire of Broome                                                                                                                                                                                                1

CONTENTS                                                                                                                               FIGURES                                                      TABLES
FOREWORD                                                        2    Trade and the Economy............................24               1. Role of Local Government in                               1. Shire of Broome Council Economic
                                                                                                                                          Economic Development.........................9               Expenditure and Activity.......................6
Deputy President’s Foreword......................2                   External Drivers and Trends......................25
                                                                                                                                       2. Broome Growth Plan Target Scenarios..11                   2. Number and Share of Local
Chief Executive Officer Foreword...............3                     BROOME’S COMPETITIVE
                                                                                                                                       3. Broome Economic Development                                  Employing Businesses, Broome,
Special Thanks..............................................3        ADVANTAGES AND CHALLENGES                                  27                                                                     Kimberley and WA ..............................21
                                                                                                                                          Strategy 2021-2026 Structure..............14
                                                                     Assessing Local Competitiveness...............27                  4. Headline Economic Indicators –                            3. Industries with Gross Value Added
EXECUTIVE SUMMARY                                               4
                                                                     Advantages and Challenges of the                                     Broome (S)...........................................15      >$50m, Broome (S), 2019....................24
AN ECONOMIC DEVELOPMENT                                              Broome Economy.......................................28           5. Broome Context Map..........................16            4. Broome Competitiveness Assessment...28
STRATEGY FOR BROOME                                             5
                                                                     Economic Assets & Drivers.........................31              6. Share of Population by Age, Broome                        5. Major Economic Assets, Shire of
What is Economic Development?...............5                                                                                             (S) and Western Australia, 2018.........17
                                                                     Economic Development Opportunities.....34                                                                                         Broome.................................................31
Who is Responsible for Economic                                                                                                        7. Unemployment Rate, Broome (S)
Development?..............................................5          ECONOMIC DEVELOPMENT VISION                                          and WA, 2015 to 2019 .......................18
                                                                     AND DESIRED OUTCOMES                                       36
What is the Role of Local Government?.....5                                                                                            8. Jobs, Broome LGA, 2006 to 2016........19
                                                                     Foundation for Future Growth and
Council as an Economic Driver and                                                                                                      9. Share of Jobs by Industry, Broome
                                                                     Prosperity...................................................36
Catalyst.........................................................6                                                                        LGA and WA, 2016 .............................19
                                                                     Economic Development Framework.........37                         10. Change in Jobs, Broome LGA, 2006-2016 .20
Shire of Broome-Led Projects......................7
                                                                     Vision for the Broome Economy...............38                    11. Registered Businesses per 1,000 Residents,
Building on the Broome Growth Plan.......10
                                                                     Desired Outcomes......................................39              Broome (S) and WA, June 2019 ...........21
Alignment with Other Policies and
Strategies...................................................12                                                                        12. Tourist/Visitors, by Type, Broome
                                                                     SHIRE OF BROOME’S ECONOMIC                                            and Roebuck SA2s, 2010 to 2019 .......23
Purpose and Structure of the Strategy.....14                         DEVELOPMENT PROGRAMS                                       40
                                                                                                                                       13. Top 5 Countries of Residence of
BROOME’S ECONOMIC PROFILE                                     15     IMPLEMENTATION AND MONITORING 44                                      International Visitors, Broome (S)
                                                                                                                                           and Western Australia, 2019...............23
Headline Indicators....................................15            Partnering for Success...............................44
                                                                                                                                       14. Gross Product per Person, Broome (S),
Place...........................................................16   Monitoring Progress and Measuring                                     Kimberley and Western Australia, 2019...24
                                                                     Outcomes...................................................44
People........................................................17                                                                       15. Impact of Covid-19 On Employment,
                                                                     REFERENCES                                                 45         Shire Of Broome, May 2020 And
Employment and Business.........................19                                                                                         January 2021........................................25
Visitors........................................................23                                                                     16. Residential Rental Vacancy Rates,
                                                                                                                                           Broome, 2020 And 2021......................25
                                                                                                                                       17. Porter’s Diamond Model of
                                                                                                                                           Regional Competitiveness....................27
                                                                                                                                       18. Advantages and Challenges for
                                                                                                                                           the Broome Economy..........................36
                                                                                                                                       19. Economic Development Framework...37
Economic Development Strategy 2021-2026 for the Shire of Broome                                                                                                              2

FOREWORD

Deputy President’s foreword
In December 2020, the Shire of Broome
endorsed a new vision: Broome – A Future for
                                                   The diverse industries that are growing,
                                                   new ventures being established and projects
                                                                                                     There is no doubt that the Shire has a
                                                                                                     significant role to play in furthering Broome’s
                                                                                                                                                        The purpose of
Everyone.                                          coming online breeds confidence that the          economy and we are directly creating               this Economic
                                                   vision of our town blossoming into a key          employment opportunities through a number
Part of this new tagline is our local
                                                   regional centre is achievable in the not-too-     of exciting infrastructure projects.               Development
government throwing its arms open to new
residents, visitors and investors as Broome
                                                   distant future.
                                                                                                     More than $50 million has been invested by         Strategy is to identify
looks towards a vibrant future.                    While economic development is not the core
                                                   function of a local government, the Shire of
                                                                                                     the Shire and State Government across the
                                                                                                     Town Beach Redevelopment Project and
                                                                                                                                                        existing strengths to
The State Government has identified our
town as possessing the potential to become
                                                   Broome believes a collaborative effort is the     Chinatown Revitalisation Project over recent       be maximised and
                                                   best method for collective success.               years.
a major regional city in the near future – an                                                                                                           potential opportunities
aspiration shared by our progressive Council       Our Shire president Harold Tracey and the         These projects have refreshed two of
and dynamic administration.                        rest of our Council have Broome’s best            Broome’s key precincts, stimulated                 to be pursued, while
The purpose of this Economic Development
                                                   interests at heart and collectively our elected
                                                   members have urged the administration to
                                                                                                     employment and provided the opportunity
                                                                                                     for economic development.
                                                                                                                                                        mapping out a future
Strategy is to identify existing strengths to be
maximised and potential opportunities to be
                                                   be bold, ambitious and to move into certain
                                                                                                     The Shire has big aspirations for the              path to affluence and
                                                   areas that are not necessarily associated with
pursued, while mapping out a future path to
                                                   local government.
                                                                                                     future, with the Cable Beach Foreshore             prosperity.
affluence and prosperity.                                                                            Redevelopment, Broome Boating Facility and
                                                   That is why the Shire led the way in              other projects firmly in the pipeline and set to
Broome has long been synonymous with the
                                                   collaboration with other key regional             be the foundation for the further economic
tourism industry and our region remains a
                                                   stakeholders in compiling this strategy – the     development of our town.
key destination for travellers to, and within,
                                                   latest in a swathe of important informing
Western Australia.                                                                                   Thank you for taking the time to review this
                                                   documents for the West Kimberley.
                                                                                                     strategy – I’d encourage you to reach out to
There is no doubt that tourism plays a key
                                                   The Broome Growth Plan was collated in            the Shire’s economic development team to be
role in the local economy and will continue to
                                                   partnership with leaders in our region, while     part of Broome’s future prosperity.
be the lifeblood of our town.
                                                   the 3-Year Broome COVID-19 Recovery Plan
However, I’m sure you will agree after             was driven by the Shire in 2020 to help our
reading this strategy, the potential for growth    community in times of economic hardship.          Desiree Male
and diversification in Broome’s economy is                                                           Shire of Broome deputy president
very exciting.
Economic Development Strategy 2021-2026 for the Shire of Broome                                                                                            3

Chief Executive Officer Foreword
The Shire of Broome is committed to playing         I am very proud of the work undertaken               It is fair to say Broome is at something of
an important role in the economic growth            to refresh and rejuvenate Town Beach and             a crossroads in relation to our short-term
of our town – something our community has           Chinatown over the last few years – these            future, and it is essential that the Shire gets
undoubtedly asked us to take a lead in.             projects have improved these two key                 the future planning of our town right to
                                                    precincts.                                           enhance our community’s prospects and
After conducting our Community Perceptions
                                                                                                         reach the considerable potential detailed in
Survey in 2020, we worked hard to collate the       The Shire is not resting on our laurels and
                                                                                                         this document.
extensive feedback and submissions, with a          has big plans to refresh the foreshore around
few trends emerging.                                Cable Beach to maximise the potential of our         One thing you can be assured of is the Shire’s
                                                    world-class environmental asset.                     executive group, management team and
One of the areas that residents, businesses
                                                                                                         staff are working tirelessly in the pursuit of
and ratepayers asked us to focus on in the          All these projects create the ideal
                                                                                                         Broome’s positive evolution.
short term was economic development.                environment for economic prosperity in many
                                                    forms and will be critical to our collective         The organisation is at the forefront of
We have firmly listened to this feedback and
                                                    prosperity.                                          facilitating new investment in our town and
are working hard on several fronts to make
                                                                                                         I’d invite any person or business interested
Broome an even more appealing place to live,        It is clear a collaborative approach with
                                                                                                         in learning more to contact our dedicated
work, visit and invest in.                          relevant stakeholders and all tiers of
                                                                                                         community development team.
                                                    government is required to achieve a shared
The Shire constantly strives to facilitate
                                                    vision and the Shire has been proactive in this
investment in Broome and by providing
                                                    regard in recent years.
rejuvenated key areas in our town has                                                                    Sam Mastrolembo
developed the setting for economic                                                                       Chief Executive Officer
prosperity.

Special Thanks
The Shire of Broome would like the thank the following organisations for their input and support in the development of this Strategy:

•   Kimberley Development Commission                •   West Kimberley Alliance                          •   Development WA
•   Regional Development Australia                  •   Nyamba Buru Yawuru                               •   Australia’s North West Tourism
    Kimberley                                       •   Kimberley Ports Authority                        •   Broome Visitor Centre
•   Broome Chamber of Commerce and                  •   Broome International Airport
    Industry
Economic Development Strategy 2021-2026 for the Shire of Broome                                                                                                                              4

EXECUTIVE SUMMARY

The Shire of Broome is committed to                 The region has a large share of small               There is significant longer-term private            Based on an assessment of the
promoting, encouraging and facilitating the         businesses, though lacks medium sized               investment planned in Broome for                    competitiveness of the Broome
sustainable development of the Broome               businesses which represents a significant           transformational infrastructure development         economy, the following vision
economy for the benefit of all residents.           constraint for Broome to tackle local               (i.e. $110 million for the Kimberley Marine         statement is proposed for the
This Economic Development Strategy 2021-            unemployment and generate meaningful                Offloading Facility). This Strategy also            Economic Development Strategy:
2026, builds upon the success of the Broome         employment opportunities for all residents.         highlights that in the immediate-term, funds
Growth Plan as well as the region’s 3 Year                                                              have been committed for locally-led activity
                                                    Major economic assets in (or near) the Shire
COVID-19 Recovery Plan.
Broome is located in the south-west Kimberley
                                                    include:
                                                    •   Cable Beach
                                                                                                        that will have regional contracting capability
                                                                                                        and community benefits.                             Broome -
                                                    •
                                                                                                                                                            economically
in the far north of Western Australia. It covers                                                        The Shire of Broome has identified a series of
                                                        Broome International Airport
approximately 56,000 square kilometres and                                                              Desired Outcomes for economic development
boasts a coastline of 900 kilometres. The Shire
                                                    •   Port of Broome
                                                                                                        activity in Broome. These include More
                                                    •
                                                                                                                                                            diverse, for
is located 2,240km by road to the northeast             Dampier Peninsula                               People; More Investment; More Businesses;
of Perth (capital city of Western Australia)        •   Chinatown Broome                                and More Economic Diversity.
and is closer to Darwin (1,872km northeast)         •   University of Notre Dame – Broome Campus

                                                                                                                                                            everyone.
                                                                                                        Realising the Vision for the Broome economy
and Bali, Indonesia (1,319km). The Shire is         •   North Regional TAFE – Broome
                                                                                                        and the associated Desired Outcomes will
located in the same timezone as East Asia           •   Great Northern Highway                          require a series of actions and initiatives by
with 1.5 billion people.                            •   Browse Basin                                    the Shire, delivered in partnership with other
The Shire of Broome was home to 16,907              •   Thunderbird Mineral Sands                       economic development stakeholders.
people in 2019 and current WA Government            •   Ex-Waterbank Station
                                                                                                        The Economic Development Framework in
projections indicate the population will reach      •   La Grange and Skuthorpe Agriculture Areas       this Strategy includes the identification and
18,591 by 2031. This is in line with recent         •   Asian Renewable Energy Hub                      establishment of core Economic Development
historical growth rates, though is slower than
the Broome Growth Plan’s modelled population
                                                    •   Roebuck Plains Station                          Programs for the Shire. The four key
scenarios. Approximately 1/3 of Broome’s
                                                    •   Kimberley Meat Company                          Economic Development Programs include:
population are Aboriginal people – with higher      Broome is evolving to become a dynamic,             •   Business and Industry Support
shares living outside of the town itself.           investment friendly location with its proactive     •   Skills Development and Training
Major employing industries in the Shire
                                                    leadership group focused on transforming            •   Investment Attraction, Branding & Liveability
of Broome include Health Care and Social
                                                    the regional centre into a modern vibrant           •   Connectivity, Transport and Access
                                                    place to live whilst nurturing our natural
Assistance, Education and Training, and                                                                 This Strategy is a flexible document designed
                                                    environmental and cultural assets. It seeks
Accommodation and Food Services (linked to                                                              to provide a framework for Council’s
                                                    to leverage the long-term trend of people
Broome’s role as a domestic and international                                                           economic development activity to respond to
                                                    coming to the North West for a job and
tourism destination of choice).                                                                         potential fluctuations in commodity markets
                                                    staying for the lifestyle.
                                                                                                        and global trends.

  Economic development programs

             Business &                            Skills Development                     Investment Attraction,                  Connectivity,
             Industry Support                      & Training                             Branding & Liveability                  Transport & Access
Economic Development Strategy 2021-2026 for the Shire of Broome                                                                                                                                          5

AN ECONOMIC DEVELOPMENT STRATEGY FOR BROOME

What is Economic                                                   Who is Responsible for                                              What is the Role of
Development?                                                       Economic Development?                                               Local Government?
“Economic development” is a phrase that characterises any          The economic development of Broome is a shared                      In recent years, local government has played an increasingly
activity, initiative, investment or policy that seeks to improve   responsibility. It represents the collaborative and collective      central role in the achievement of economic development
the economic and social wellbeing of people. This recognises       effort of key economic development stakeholders across all          objectives across Australia. Local Government has a
that we all live in a community, not an economy, and that          three levels of Government, Traditional Owners and other            distinct advantage over other levels of government in the
economic activity should make people’s life better.                indigenous groups and communities, local and national               implementation of economic development initiatives because of
                                                                   businesses, major economic asset owners, investors, workers         its closer connection to both businesses and households in the
Successful economic development activities seek to grow and
                                                                   and residents.                                                      community.
enhance the capacity of a local economy to generate wealth
and prosperity in the long-term to underpin improvements in        Each organisation and person in Broome has an important role        The purpose of the Shire of Broome is to deliver affordable and
the lives of residents.                                            to play in realising positive economic development outcomes         quality Local Government services, for everyone.
                                                                   in the Shire. Every dollar spent, invested and earnt in the Shire
The concept of economic development has evolved over
                                                                   represents an opportunity to foster economic development
time, shifting from a focus on headline economic growth
                                                                   and enhance quality of life.
and employment figures to more nuanced and meaningful
objectives such as sustainability, wellbeing, quality of living,
resilience, social cohesion and integration.
Economic Development Strategy 2021-2026 for the Shire of Broome                                                               6

Council as an Economic Driver and Catalyst
Local Government not only plays an                    TABLE 1 SHIRE OF BROOME COUNCIL ECONOMIC EXPENDITURE AND ACTIVITY
important role in setting the land use
framework for economic and social                      Indicator                                            Value
development but often represents a major
source of economic expenditure and activity            Council Employees                                    178
in their own right.
                                                                                                            51 assets with
In addition to this direct expenditure impact,         Council Assets                                       a fair value of
the Shire of Broome manages the Broome                                                                      $488m
Library as well as the Broome Recreation and
Aquatic Centre and Broome Civic Centre.                Council Operating Expenditure (2019/20)              $32.3m
Key indicators for these economic drivers are          Council Operating Expenditure - Local Only           $19.0m
summarised below.                                      (2019/20)
Despite the impact of COVID-19 on program              Local Share of Council Operating Expenditure         55%
and event delivery in 2019/20, both the                (2019/20)
Broome Library and BRAC experienced
an increase in attendance and activation,              Council Capital Expenditure (2020/21 Budget)         $40.6m
illustrating the critical role both facilities play
                                                       Economic Events and Tourism Development Grants       $242,862
in the social fabric of the Shire.
                                                       (Avg 3 Years)
Both the Broome Library and BRAC
                                                       COVID-19 Community Support Grants (2020/21)          $55,225
experienced an increase in attendance and
activation in 2019/20, illustrating the critical       Tourism Administration Policy Grants (Avg 3 Years)   $414,830
role both facilities play in the social fabric of
the Shire.                                             Shire Of Broome Sponsored Events                     24

                                                       Shire of Broome Managed Events                       22

                                                       Broome Civic Centre Events (2019/20)                 52

Both the Broome Library and BRAC experienced an increase in
attendance and activation in 2019/20, illustrating the critical role
both facilities play in the social fabric of the Shire.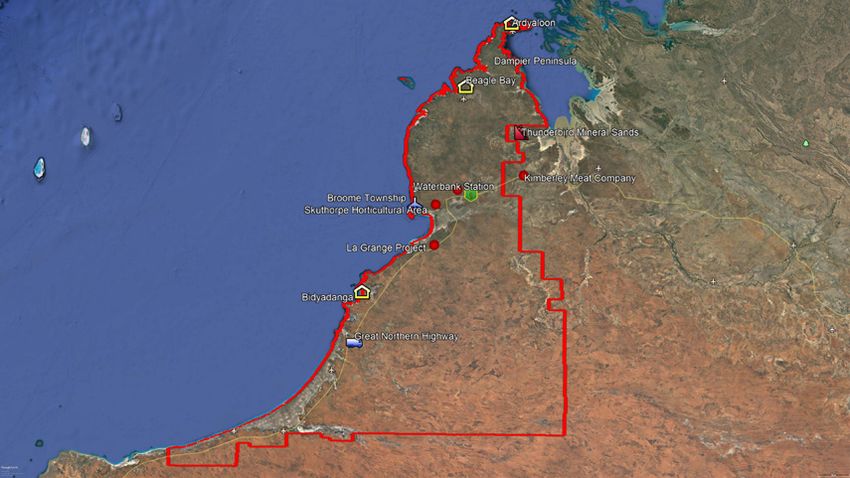
Economic Development Strategy 2021-2026 for the Shire of Broome                                                                   7

Shire of Broome-Led Projects
Broome is home to significant economic and social potential and Council has and will continue to play a central
role in the attraction of funding, the facilitation of investment, and the implementation and delivery of key major
projects across the Shire.

Key projects currently being progressed and delivered by the Shire of Broome are outlined below.

     Cable Beach Foreshore                                                                         Chinatown Revitalisation
     Redevelopment                                                                                 Stage 2
     Value: $36.5 million                                                                          Value: $18 million
     Status: Seeking Funding                                                                       Status: Committed / Underway

     Regional Resource
     Recovery Park &                                                                               Town Beach Project
     Community Recycling                                                                           Value: $17 million
     Centre                                                                                        Status: Completed

     Value: $12.3 million
     Status: Seeking Funding
Economic Development Strategy 2021-2026 for the Shire of Broome                                  8

    Town Beach All-Access                                         Jetty to Jetty Trail
    Fishing Jetty                                                 Value: $0.6 million
    Value: $7.1 million                                           Status: Committed / Underway
    Status: Committed / Underway

    Broome Recreation &                                           Broome Golf Course
    Aquatic Centre Renewal                                        Clubhouse & Restaurant
    Value: $36.5 million                                          Value: $6.5 million
    Status: Stage 1 – Underway                                    Status: Complete
    Stage 2 - Seeking Funding

    Broome Surf Life Saving                                       Kimberley Regional
    Club Refurbishment                                            Office 1 - 3
    Value: $3.2 million                                           Value: $8.5 million
    Status: Committed / Underway                                  Status: Stage 1 – Completed
                                                                  Stage 2 - Seeking Funding
Economic Development Strategy 2021-2026 for the Shire of Broome 9
We fulfil the following roles and This includes, but not limited to the following: Actioning the Indigenous Land Use Agreement
responsibilities to meet local needs:
• Kimberley Development Commission: information The Shire of Broome, Nyamba Buru Yawuru and the other State Government
• Advocate: We are a voice for the local and facilitation between State Government and signatories are jointly striving to action the intent of the Indigenous Land Use
community, promoting local community communities across the Kimberley region. Agreement (ILUA) which was signed in 2010. It is unusual for a Local Government
interests to others. • Regional Development Australia Kimberley: to be a signatory to an ILUA and it recognises that strategic partnerships play an
• Facilitate: We help to make it possible information and facilitation between Federal integral role in Broome’s future development.
or easier for others to meet community Government and communities across the
Nyamba Buru Yawuru is a significant landholder in the townsite of Broome.
needs. Kimberley region.
The Shire of Broome acknowledges that its office is on Yawuru country and its
• Fund: We fund organisations to deliver • West Kimberley Alliance: advocacy to government relationship with Yawuru people and Traditional Owner groups across the local
essential community services. and private sector on key developments in the government area is an asset.
• Partner: We form strategic alliances West Kimberley region.
with others in the interests of the • Broome Chamber of Commerce and Industry:
In terms of economic opportunities, the joint ILUA and determined Native Title
for Broome is a competitive advantage. It provides a degree of certainty for
community. peak industry body for the business sector in
future development and investment. It also signals to business that there are
• Provide: We directly provide Broome.
established terms for joint management of conservation estates and marine
community infrastructure and services. • Nyamba Buru Yawuru: this is Yawuru’s parks.
• Regulate: We ensure compliance with development and investment company and is
Outside of the Broome townsite, Native Title has largely been determined across
local laws. charged with the responsibility to generate long
term income for the Yawuru community. The not- the Shire. This means that there is minimal uncertainty relating to ongoing claims
The role of local government in economic for-profit company has interests in a range of areas with established Prescribed Body Corporates which hold Native Title acting on
development is also dependent on the including property development, pastoral and behalf of Traditional Owner groups across the Shire.
other institutions present in the area. This agricultural, construction and technologies.
strategy recognises that in many instances, • Department of Primary Industries and Regional
the Shire of Broome is best placed to Development: alignment of local government
partner rather than lead initiatives with our economic development and COVID19 recovery
key stakeholders who also have economic with regional and State Government plans and
development roles. policies.
FIGURE 1 ROLE OF LOCAL GOVERNMENT IN ECONOMIC DEVELOPMENT
Advocate Facilitate Fund Partner Provide Regulate
Credit: Nyamba Buru YawuruEconomic Development Strategy 2021-2026 for the Shire of Broome 10
Building on the Broome Growth Plan
The Shire of Broome currently does not have including additional economic activity,
a dedicated Economic Development Strategy. employment and population growth.
Instead, economic development objectives
To ensure that the implementation of the
and goals have been a shared responsibility of
plan is relevant to the culture and context of
the Shire and other stakeholders through the
Broome, four pathways were developed which
implementation of the Broome Growth Plan.
enable maximum benefit to be obtained.
The Growth Plan Partnership comprised of
the Shire of Broome; Kimberley Development • Building small enterprise.
Commission; Yawuru Registered Native Title • Connecting to governance structures.
Body Corporate; Development WA (formally
LandCorp); Department of Primary Industries
• Connecting initiatives and enablers.
and Regional Development; and Department • Infrastructure required.
of Planning, Lands and Heritage. The Broome Growth Plan has been a
The Broome Growth Plan is a blueprint for transformative strategy for the Shire. It
the Shire’s economic future and was compiled continues to be used by Council to drive
over several years from detailed research and collaboration and buy-in by the State
wide-ranging consultation with key economic Government into the Broome economy and
development stakeholders and the broader community and has helped to communicate
Broome community. a consistent message to State and Federal
Government agencies on Broome’s potential
The Broome Growth Plan establishes scenarios and funding priorities.
for the Broome economy and communityEconomic Development Strategy 2021-2026 for the Shire of Broome 11
The Growth Plan established a series of Since the publication of the Growth Plan, investment in the future of the local area as This Economic Development Strategy seeks to
aspirational models for the Broome economy demographic and economic activity in the Aboriginal people are also far less likely to build upon this momentum and help to chart
covering population, jobs and economic Shire have slowed against historical trends. move away from the region. a path forward for the Broome economy to
growth to 2036. realise the aspirations of the Broome Growth
Population growth has been flat (and Many objectives and aspirations of the
Plan in the long-term.
These models illustrate the very different declined marginally in recent years) while Growth Plan have been realised or are
growth scenarios that might be achieved job growth has slowed significantly with progressing through the planning phases Please note, this Strategy does not seek to
if Aboriginal labour force participation is unemployment rising. The result of this has (refer to Shire of Broome’s Economic replace the Broome Growth Plan. It focuses
attained at certain rates. True prosperity been a declining trend in Gross Regional Development Programs). Additionally, on identifying the Shire of Broome’s unique
must cut across racial and income lines; if the Product in the Shire in recent years (refer a sharp increase in tourism activity in role in implementation and to provide a
Broome area is to grow, and the economy to Broome’s Economic Profile). This 2019, along with private sector interest in ‘status update’ on the growth aspiration
to expand, all must participate, and all must overall trend does not reflect the growth horticulture, mining, and logistics projects scenarios.
benefit. The risk of a two-track economy in Aboriginal population in the area represent major progress towards activating
developing is a very real one. which continues to grow. Investment in Broome’s “trading economy” (refer to
the Aboriginal workforce represents an Economic Development Opportunities).
FIGURE 2 BROOME GROWTH PLAN TARGET SCENARIOS
Scenario 1 Scenario 2 Scenario 3 - the targeted scenario Scenario 4
Trend growth Activation of Agriculture and Tourism Activation of Agriculture, Tourism and Aspirational growth
industries Aboriginal Participation
2036 2036 2036 2036 $6.48B
24,732
20,268 48,228
39,448 $4.139B
39,448 16,578
32,204 14,982 $2.95B
$2.42B
3% 3.5% 4% 4% 4% 5% 4% 5% 6.7% 5% 6% 9%
2015 17,311 7,275 $1.06B 2015 17,311 7,275 $1.06B 2015 17,311 7,275 $1.06B 2015 17,311 7,275 $1.06B
POPULATION JOBS GRP POPULATION JOBS GRP POPULATION JOBS GRP POPULATION JOBS GRP
Represents the likely outcome of Broome in Targets readily achievable growth in As Scenario 2, with the addition of increased As Scenario 3, with the addition of growth in
21 years at continued trend rates - population agriculture and tourism - population and job Aboriginal participation and enhancement, other sectors such as oil and gas, leading to a
doubles without associated job growth. growth more than double. leading to improved social outcomes such as sustainable, stable population and enhanced
decreased welfare dependency. social conditions, including improved
liveability and access to services.Economic Development Strategy 2021-2026 for the Shire of Broome 12 Alignment with Other Policies and Strategies In addition to the Broome Growth Plan, this Economic Development Strategy draws on the lessons learnt and framework established by other key policies and strategies. These include: Western Australian Local Government Association’s (WALGA) Local Economic Development Framework A summary by WALGA detailing the economic development landscape and how local government can play a role in supporting economic outcomes at a community level. Kimberley Development Commission’s 2036 and Beyond: A Regional Investment Blueprint for the Kimberley The investment blueprint details a focused plan designed to guide and shape the Kimberley region. It states the increasing importance of the Kimberley region to both the state and national level, particularly in reference to the cultural and wilderness assets and natural resources. West Kimberley Alliance’s (formally Broome Future) Unlocking the Door This 2015 study investigates the feasibility of Broome as a commercial and logistics hub for the Kimberley. The report is the precursor to the Broome Growth Plan. Shire of Broome’s Corporate Business Plan 2021 – 2025 This plan aims to align the community’s visions and aspirations for the future of Broome, to the Shire’s objectives. These objectives are measured by both quantifiable and non-quantifiable outcomes, using key performance measures. Shire of Broome’s Strategic Community Plan 2021 – 2031 The Strategic Community Plan is the highest level of document in the integrated planning and reporting framework. It is designed to be a ‘living’ plan that guides the development of the Shire of Broome community for the next 10 years plus. It sets out four strategic themes (Social, Environment, Economic, and Civic Leadership) and details the desired outcomes to be achieved for each goal and the strategies to help realise these objectives. At the time of this Strategy, Council completed and endorsed a major review of the Plan in December 2020. Yawuru Corporate Group’s Strategic Plan 2016 – 2020 Mission of the plan is to enable Yawuru people to be active participants in and beneficiaries of sustainable economic, cultural and social practices so that they can care for and enjoy their land, values and culture, while enhancing families and the community in which they live. The plan is to be incorporated through a set of strategies and goals and aims to identify and grow economic opportunities while building social, cultural and human resources. It is important to generate knowledge and understanding of Yawuru culture and incorporate their customary law, knowledge and values into a Western context. Yawuru Corporate Group’s Yawuru Futures: Economic Sustainability and Investment – April 2018 This document provides a policy framework for the strategic direction of Nyamba Buru Yawuru economic development and investment. The objectives of their economic agenda are to ensure financial sustainability in the long term, and to transform the economic environment of Broome so that economic participation and benefit is maximised for Yawuru and for all Aboriginal people in the region.
Economic Development Strategy 2021-2026 for the Shire of Broome                                                                                       13

While preparing this Economic Development       Key organisations and leaders in Broome          This process demonstrated the ability of
Strategy, the Shire of Broome has commenced     collaborated to formulate the 3-Year Broome      Broome’s institutional organisations to be
the following planning activity:                COVID-19 Recovery Plan to bring forward          unified in vision and purpose in their advocacy
                                                planned investment to stimulate the Broome       for co-investment in major projects identified to:
•   Local Planning Strategy and Local
    Planning Scheme No 6 review
                                                economy as a response the impacts from the       •   Stimulate jobs and economic growth;
                                                COVID-19 measures. The Shire of Broome
•   Strategic Community Plan review             partnered with Nyamba Buru Yawuru, West
                                                                                                 •   Deliver regional benefits; and

•   Arts and Culture Strategy                   Kimberley Alliance, Broome Chamber of            •   Assist in rebounding from COVID-19
                                                                                                     impacts.
•   Youth Framework                             Commerce and Industry, and Cruise Broome
                                                to develop the plan. Input was also sought
•   Community Safety Plan
                                                from other stakeholders including the
                                                                                                 While the Economic Development Strategy
                                                                                                 is a Shire of Broome document, it will aim
•   Waste Strategy                              Kimberley Development Commission, Regional       to further cement the relationships with
Collaboration across the Shire of Broome’s      Development Australia Kimberley, and Office of   the Shire’s institutional peers as part of its
disciplines is ensuring that this activity is   Northern Australia.                              implementation.
informing and aligning to each other.

Credit: Kimberley Development Commission
Economic Development Strategy 2021-2026 for the Shire of Broome 14
Purpose and Structure of the Strategy
The Broome Economic Development Strategy 2021-2026 seeks to build upon the success and legacy
of the recent economic development activity and cooperation in Broome. Providing an evidence
base for decision making, it establishes a vision and framework for economic development
priorities and activities by the Shire of Broome over the next 5 years.
The Strategy is comprised of the following key sections:
FIGURE 3 BROOME ECONOMIC DEVELOPMENT STRATEGY 2021-2026 STRUCTURE
Broome’s Economic Competitive Economic
Profile Advantages & Development
Challenges Vision & Desired
Outcomes
Economic Implementation
Development and Monitoring
ProgramsEconomic Development Strategy 2021-2026 for the Shire of Broome 15
BROOME’S ECONOMIC PROFILE
This Strategy profiles key economic and social
indicators and trends of the Broome economy. Headline Indicators
This provides information and justification for
the Vision, Desired Outcomes and Economic
Programs outlined in the Strategy, as well FIGURE 4 HEADLINE ECONOMIC INDICATORS – BROOME (S)
as evidence to inform and guide investment
decision making by the Shire of other economic
development stakeholders and investors. 16,907 1.09% 35,901 24.2%
The profile is broken into four broad categories:
Broome Shire Annual population Kimberley population Share of population
• Place – spatial, geographical and population growth since 2011 0-14
environmental attributes of Broome and its
relationship with the wider Kimberley region;
• People – population, demographic and socio-
economic attributes of the people who call
Broome home;
7.5% 28.2% 9.7% 1,265
• Employment and Business – economic Share of population Share of population Unemployment rate Number of registered
indicators and attributes including 65+ Aboriginal (Dec 19) businesses
employment, business registrations, industry
development and investment;
• Visitors – tourism visitation, assets and
•
trends.
Trade and Economy – regional exports,
15.9% 446,181 $1.54b
major industry trends and gross regional Health care share of Number of visitors Gross regional
product. jobs (Dec 19) product ($b)Economic Development Strategy 2021-2026 for the Shire of Broome 16
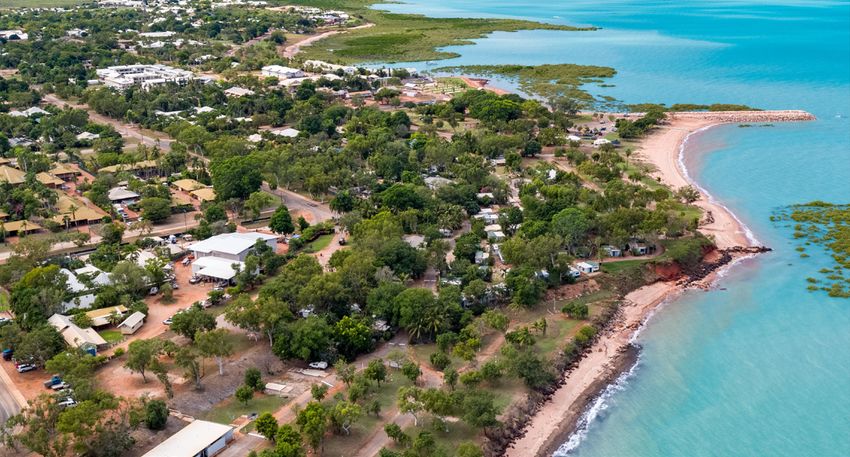
Place
The Broome Local Government Area is The Kimberley Coast has the biggest tides FIGURE 5 BROOME CONTEXT MAP
located in the south-west Kimberley in the in the southern hemisphere. The difference
far north of Western Australia. It covers between high and low tides is up to around Inpex Ichthys LNG project
approximately 56,000 square kilometres and 10 metres.
boasts a coastline of 900 kilometres. The Shire
Broome has extraordinary natural assets
is located 2,240km by road to the northeast Ardyaloon
including the Yawuru Nagulagun / Roebuck
of Perth (capital city of Western Australia)
Bay Marine Park and areas of reserve and
and is closer to Darwin (1,872km northeast)
joint management. There are five groups
and Bali, Indonesia (1,319km). The Shire is
of Indigenous rangers across the region.
located in the same timezone as East Asia Dampier
This includes Bardi Jawi Rangers at One Peninsula
with 1.5 billion people.
Arm Point, Nyul Nyul Rangers at Beagle
The Shire is serviced by an international airport Bay, Yawuru Country Managers, Karajarri Beagle Bay
e veque Rd
and port and the township of Broome is Rangers and Nyikina Mangala and Yawuru
recognised as the strategic regional centre for Park Joint Management Rangers in and Thunderbird Mineral Sands
the region. The township of Broome is located around Broome. These groups employ teams pe
L
Ca
on a peninsula and so has the Indian Ocean to of Aboriginal people to work on country,
-
Kimberley
Broome
the east (the inlet of Roebuck Bay) and west. and all provide a range of environmental Meat Company
services, across management of landscapes Broome Township Waterbank/
Broome township is the service and trade hub
(fire, weeds, feral animals) and monitoring Skuthorpe
of the region, servicing agricultural, pastoral, agricultural area
(sensitive species, impacts and so forth). In
mining and oil and gas production in the Shire
Broome, the management of the Yawuru
and Kimberley (including offshore such as
Park conservation estate is undertaken jointly La Grange
INPEX Ichthys). It also serves as the “gateway” Browse Basin
with the Shire of Broome via a joint Park Project
for tourists and visitors to the Kimberley, a
management council, a governance process Bidyadanga
combination of drive in and fly in visitors.
that formed as an outcome of the signing of
International visitors can also arrive via cruise
the ILUA.
ship, self drive and aircraft.
y
wa
The Shire of Broome has a complex land
gh
The area has a tropical climate, defined by
n Hi
tenure tapestry made up of freehold, native
a wet and a dry season. The wet season
t h er
title, Aboriginal heritage, Aboriginal Lands
generally lasts from November until April,
or
Trust reserve, pastoral lease, unallocated
tN
while the dry season runs from May until
crown land, and environmental reserves
ea
October. Its climate means the area enjoys
Gr
to name a few. Sustainable economic
warm coastal temperatures of high 20C to
opportunities through land tenure reform
low 30C all year round, making it a popular
and flexibility remains a goal for communities
destination for visitors from colder climates
and all levels of government. Asian Renewable Rio Tinto’s Winu project
during the winter months.
Energy HubEconomic Development Strategy 2021-2026 for the Shire of Broome 17
People
The Shire of Broome was home to 16,907 people in Bidyadanga in the La Grange area. FIGURE 6 SHARE OF POPULATION BY AGE, BROOME (S) AND WESTERN AUSTRALIA, 2018
people in 2019 and current WA Government Non-seasonal access, services, facilities and
projections indicate the population will reach commercial activity vary significantly in these
30%
18,591 by 2031. This is in line with recent communities.
Broome LGA Western Australia
historical growth rates, though is slower
However, the seasonal population of Broome
than the Broome Growth Plan’s modelled
can far exceed its residential population, as 25%
population scenarios. This reflects the fact
visitors and other non-residents come to the
that Broome’s population has experienced a
Shire to live, work and play on a temporary
marginal decline since 2013, after more rapid 20%
basis. Combining permanent residents and
Share of Population
growth in the seven years prior.
non-permanent visitors in a town gives an
The majority of the Shire’s population reside estimate of its “service” population – or the
15%
in the Broome townsite. Other population population that the town (and its facilities
centres in the Shire include: and infrastructure) must service each year.
Accounting for tourism visitors, short-stay
• Ardyaloon (One Arm Point / Bardi)
workers, business travellers, other workers
10%
• Beagle Bay and people from outer communities around
• Bidyadanga the Kimberley and North West using Broome
5%
• Djarindjin (Lombadina) as a base, the service population of Broome
can reach in excess of 20,000 people on any
While the population of these communities given day and sometimes as high as 30,000. 0%
fluctuate, it ranges from 300-400 people
0-14 15-24 25-34 35-44 45-54 55-64 65+
each in Ardyaloon, Beagle Bay and Djarindjin
on the Dampier Peninsula to over 600 Age Cohort
The Shire of Broome was home to 16,907 people in The residential population of the Shire is younger than the rest of Western
Australia, with 0-14 years accounting for almost one in four residents in 2018.
2019 and current WA Government projections indicate This is in part driven by strong growth in the Aboriginal population of the Shire
which trends younger than the non-Aboriginal residents.
the population will reach 18,591 by 2031.
In contrast, Broome has a significantly lower share of residents aged 65 and over
and has a below average share of people aged 15-24. This is linked to constraints
in the capacity of local health and aged care services as well as the trend among
households of sending older school age students away to Perth and other
locations for secondary and tertiary schooling.Economic Development Strategy 2021-2026 for the Shire of Broome 18
A defining attribute of Broome’s population Higher incomes in part also reflect the Broome’s Native Title and Aboriginal Communities
is its rich multiculturalism, with almost one higher cost of living in the Shire and wider
in three residents identifying as Aboriginal Kimberley. Data from the WA Government A total of 84 Aboriginal communities are located within the Shire of Broome, of which
or Torres Strait Islander in 2016. This is indicate that prices in Broome were 13.6% 78 are classified as remote. Strong traditional ties to land have created a significant
significantly higher than Western Australia higher than Perth in 2019, with the rest of range of native title claims and determinations within the Shire, including, Bardi Jawi,
(3.9%) and Australia (3.3%) as a whole and the Kimberley region even higher at 15.6%. Bindunbur, Birriman-gan, Jabirr / Ngumbari, Karajarri A and B, Nyikina, Ngurrara,
illustrates the central and significant position of The higher prices reflect a combination of the Nyangumarta and Rubibi (Yawuru). Native title determinations still to be decided
Aboriginal people in the character and culture relative distance of Broome to major capital include Joombarn-buru and Mount Jowalenga.
of the Broome community and economy. city markets, as well as the comparatively In February 2010, the Yawuru, the Government of Western Australia, the Shire
small size of the local population. and other relevant parties signed two Indigenous Land Use Agreements (ILUA). An
The socio-economic attributes of the Broome
population are marginally below national Unemployment rates in the Broome Local ILUA is an agreement under the Native Title Act between a native title group and
averages, primarily owing to the Shire’s Government Area (LGA) have been higher others about the use and management of land and waters. These ILUAs resolved
relative remoteness and lower access by than the Western Australian average in compensation issues and clarified that native title continued to exist for the Yawuru
households to economic resources. It also recent years, rising to 9.7% in the December people. The Shire of Broome was one of the first Local Governments in Australia to be
reflects the fact that Aboriginal people and 2019 quarter (i.e. pre-COVID19), after a signatory to an ILUA.
households historically experience greater being broadly in line with State averages
levels of socio-economic disadvantage. (approximately 6%) as recently as 2017.
Despite this, for those who are employed Engagement with stakeholders indicates that
, personal wage and salary incomes are Aboriginal workers shoulder a higher burden A total of 84 Aboriginal communities are
generally higher than the rest of Western of unemployment than headline figures, With
Australia, with a median personal income Aboriginal people accounting for 75.1% of located within the Shire of Broome, of which
of $54,247 in 2016/17 – 5.4% higher than the Jobseeker (15+) caseload in the Shire of 78 as classified as remote.
the State average. This is generally positive, Broome since 2015.
but does raise concern regarding the level of Access to meaningful employment
income inequality in the Shire. opportunities is a major priority for the town,
with improved incomes across all households
critical to addressing cost of living pressures.
FIGURE 7 UNEMPLOYMENT RATE, BROOME (S) AND WA, 2015 TO 2019
12%
Broome LGA Western Australia
10%
Unemployment Rate (%)
8%
6%
4%
2%
0%
Sep 15 Mar 15 Sep 16 Mar 17 Sep 17 Mar 18 Sep 18 Mar 19 Sep 19Economic Development Strategy 2021-2026 for the Shire of Broome 19
Employment and Business
In 2016, the Broome LGA was home to almost FIGURE 9 SHARE OF JOBS BY INDUSTRY, BROOME LGA AND WA, 2016
7,400 jobs, up from 7,050 in 2011 and 5,965
in 2006. Jobs growth has slowed between the Western Australia Broome
last Census periods, which corresponds with the Other Services
slowing of population growth during this time.
A review of the industry mix of employment Arts and Recreation Services
reveals strengths in a number of sectors in the
Health Care and Social Assistance
Broome economy, in particular those linked to
tourism (Accommodation and Food Services,
Education and Training
Transport, Postal and Warehousing and Retail)
as well as population related sectors servicing Public Administration and Safety
Broome and the wider Kimberley (Health Care
and Social Assistance, Education and Training Administrative and Support Services
and Public Administration and Safety).
Professional, Scientific and Technical Services
However, there are significant gaps in
professional services, finance and insurance, as Rental, Hiring and Real Estate Services
Industry
well as significantly lower shares of Wholesale
Trade, Manufacturing and Mining sector Financial and Insurance Services
employment compared to WA as a whole.
Information Media and Telecommunications
FIGURE 8 JOBS, BROOME LGA, 2006 TO 2016 Transport, Postal and Warehousing
Accommodation and Food Services
8,000
7,379
7,050 Retail Trade
5,965 Wholesale Trade
6,000
Construction
Jobs
Electricity, Gas, Water and Waste Services
4,000
Manufacturing
2,000 Mining
Agriculture, Forestry and Fishing
0
2006 2011 2016 0% 5% 10% 15% 20%
Share of JobsEconomic Development Strategy 2021-2026 for the Shire of Broome 20
Employment growth in recent years has been At the same time, several sectors saw declines Western Australia as a whole. While some
primarily driven by Health Care and Social in total employment including: of this difference can be attributed to the
Assistance – which grew by 475 jobs between concentration of businesses in the Perth
2006 and 2016 or 70% over the decade. This
• Manufacturing – down 37.2% to 140 jobs;
Metropolitan Area, it does highlight the
saw Health Care and Social Assistance share • Agricultural, Forestry and Fishing – down potential for new business development in
of all jobs increase to 15.6% or more than one 15% to 193 jobs; the Shire.
in every 8 jobs in the LGA. • Retail trade – down 5.6% to 607 jobs.
Aboriginal Community Controlled Organisations
Other strong growth sectors since 2006 include: Interestingly, the sectors that experienced the (ACCO) and Aboriginal Businesses represents
strongest growth over the 10 years to 2016 significant commercial and employing entities
• Education and Training – up 64.7% to 870
were also the same sectors that experienced in the Shire. Three Broome based organisations
jobs;
the largest employment impact during – Kimberley Land Council, Kimberley Aboriginal
• Transport, Postal and Warehousing – up COVID-19. Medical Services and Nirrumbuk Aboriginal
36.9% to 523 jobs; and Corporation – recorded a combined income
Rates of business registrations in Broome
• Accommodation and Food Services – up
are slightly below the State average, with
in 2020 of over $100m, employed over 400
18.8% to 745 jobs. people and represent significant contributors
76 registered business in Broome for
to the local economy.
every 1,000 residents, compared to 91 for
FIGURE 10 CHANGE IN JOBS, BROOME LGA, 2006-2016
Education & Training Transport & Warehousing Accomodation & Food
64.7% 36.9% 18.8%
Manufacturing Agriculture Retail Trade
37.2% 15.0% 5.6%Economic Development Strategy 2021-2026 for the Shire of Broome 21
Broome, however, has a higher share of employing businesses, TABLE 2 NUMBER AND SHARE OF LOCAL EMPLOYING BUSINESSES, BROOME, KIMBERLEY AND WA
with only 54% of businesses classified as “non-employing”
compared to 65% at State and national levels. A review of
employing businesses confirms a higher share of businesses No. of Employing Businesses 1-4 Employees 5-19 Employees 20-199 Employees 200+ Employees
employing 5-19 workers (compared to the Kimberley and WA)
Broome (S) 334 197 39 0
but a below average share of businesses employing more than
20 workers. This deficit in medium size businesses presents a Kimberley 573 363 87 0
significant constraint for Broome to tackle its unemployment
rate as it is medium and large businesses that account for WA 54174 22249 6197 398
the majority of employment growth in regional Australia.
Attracting new higher employing businesses to the area is Share of Employing Businesses 1-4 Employees 5-19 Employees 20-199 Employees 200+ Employees
critical to generating long term job opportunities.
Broome (S) 58.6% 34.6% 6.8% 0.0%
The largest number of businesses in Broome are in the
Construction sector (269 businesses), followed by Real Estate, Kimberley 56.0% 35.5% 8.5% 0.0%
Rental and Hiring1 (146), Retail Trade (109) and Professional
WA 65.3% 26.8% 7.5% 0.5%
Services (102).
FIGURE 11 REGISTERED BUSINESSES PER 1,000 RESIDENTS,
BROOME (S) AND WA, JUNE 2019
100
80
Businesses per 1,000 Residents
60
40
20
0
Broome (S) Western Australia
1 Includes the hiring and leasing of motor vehicles, transport equipment, farm animal & bloodstock, video and other electronic media, heavy machinery, scaffolding and intangible assets (e.g. patents and trademarks)Economic Development Strategy 2021-2026 for the Shire of Broome 22 Agriculture in Broome The principal agricultural activity of the region has been livestock production in a pastoral system based on leasehold land. Irrigated agriculture and horticulture enterprises are increasing as land tenure and water availability is determined. The West Kimberley dry season between April and September is cooler than the wet season and substantially less humid, providing opportunities to produce a range of tropical and subtropical crops. This presents opportunities to access the region’s groundwater to produce high quality fodder; with the potential for horticultural crop production being investigated and scaled up through recent private investments. Several horticultural producers grow out-of-season produce in winter (dry season), increasing their ability to supply year-round produce into domestic markets. There has been a significant investment into irrigation to produce high quality fodder and irrigated pastures by the pastoral industry. This investment counters the variability of the summer rainfall (wet season) and pasture decline in the dry season. Irrigators in the West Kimberley and Pilbara regions of Western Australia are taking advantage of niche cropping opportunities to produce high-value horticultural crops and better-quality pasture for cattle grazing. Horticultural production in the West Kimberley and Pilbara takes advantage of the climatic conditions to meet market niches. Near Broome and in the La Grange area on about 600 hectares (ha) of irrigated land, horticulture production includes cucurbits, sweet corn, stringless beans, asparagus, grapes and tropical fruits such as mangoes. Since 2000, there has been increased investment into irrigation on pastoral lands to produce fodder for cattle destined for domestic and export markets. Irrigated fodder production typically sees introduced pasture species irrigated for 12 months of the year by centre pivot irrigation systems. Over 4000ha was under irrigation across the Pilbara and West Kimberley in 2020. The West Kimberley relies on groundwater rather than surface water.
Economic Development Strategy 2021-2026 for the Shire of Broome                                                                                                                                             23

Visitors
Tourism has long been the mainstay of the             heavily to European countries, including             FIGURE 12 TOURIST/VISITORS, BY TYPE, BROOME AND ROEBUCK SA2S, 2010 TO 2019
Broome economy. The tropical, coastal setting         Germany, Switzerland, France and England/
makes Broome an attractive destination                Scotland, with New Zealand visitors also                       500,000
for interstate and international visitors,            featuring prominently. In contrast, international                          Daytrip      Domestic Overnight      International
particularly during the winter months. The            visitor profiles to Western Australia draw
vibrant and active Indigenous cultures of the         more heavily from Asian markets, including                     400,000
region also represent a significant drawcard          Singapore, Malaysia and China, though England
for both national and international visitors.         remains the most common country of residence
The vast majority of visitors express a desire        of tourists to the State.                                      300,000

                                                                                                          Visitors
to experience an authentic Indigenous
                                                      This partly reflects the predominant role and
tourism product and this is arguably an
                                                      focus of tourism bodies (e.g. Australia’s North                200,000
underexploited market at present.
                                                      West Tourism and Tourism WA) and industry
Visitation levels in 2019 were a record for the       segments (e.g. cruise ships and airport
Shire, reaching almost 450,000 visitors across        organisations) have played in recent years                     100,000
day trip, intra and interstate and international      in direct international visitation to Broome.
visitors. Domestic overnight visitors from            Working closely with Inbound Tour Operators
Perth and interstate locations such as Victoria       and Wholesalers keen to promote an                                  0
and New South Wales, represent the largest            increased Broome and Kimberley product is                                2010    2011   2012     2013    2014    2015     2016   2017   2018   2019
market for Broome, though International               resulting in increased international exposure.
visitor numbers are also significant,                 It also reflects trends of visitors from those
approaching 50,000 in 2019.                           countries to undertake more remote travel.
                                                      This includes promoting Broome’s rich cultural
The international visitor profile of Broome
                                                      and arts sector, leveraging national trends
differs significantly to that of Western Australia.
                                                      with more than 4 in 10 international tourists
Overall, Broome’s international market skews
                                                      engaging in the arts during their visits.

FIGURE 13 TOP 5 COUNTRIES OF RESIDENCE OF INTERNATIONAL VISITORS, BROOME (S) AND
WESTERN AUSTRALIA, 2019

 Broome

 Western
 Australia
Economic Development Strategy 2021-2026 for the Shire of Broome 24
Trade and the Economy
Broome is both the strategic regional centre of the TABLE 3 INDUSTRIES WITH GROSS VALUE ADDED >$50M, BROOME (S), 2019
Kimberley and major access point for this region to
national and international economies (through the Industry sector Gross Value Added
Port of Broome and Broome International Airport). As
such, Broome accounts for the largest shares of trade Rental, Hiring & Real Estate Services $198,571,155
and economic activity in the Kimberley. Regional export Transport, Postal & Warehousing $160,678,162
estimates for Broome indicate the Shire “exports”
approximately $1.1b in goods and services outside its Health Care & Social Assistance $139,924,372
Local Government boundary, representing approximately
Education & Training $119,437,421
half the export value of the Kimberley as a whole.
Transport, manufacturing, construction, health care Construction $117,760,079
and professional and personal services all feature more
prominently in Broome’s export profile compared to the Public Administration & Safety $101,712,133
Kimberley as a region, which exports more Mining and Accommodation & Food Services $78,629,650
Agriculture products.
Mining $76,308,523
This trade profile drives the Gross Value Added (GVA)
statistic which is a measure of the productivity of a sector Administrative & Support Services $67,108,943
or industry. In 2019, twelve sectors/industries generated
Agriculture, Forestry & Fishing $60,388,935
more than $50m in GVA for the Broome economy, with
the largest shares in the Real Estate, Rental and Hiring, Retail Trade $57,282,891
Transport and Health Care sectors.
Other Services $52,633,649
Note that the ABS industry classifications do not include
a tourism sector. Instead tourism activity is spread
principally across Accommodation and Food Services, FIGURE 14 GROSS PRODUCT PER PERSON, BROOME (S), KIMBERLEY
Retail and Transport, Postal and Warehousing. AND WESTERN AUSTRALIA, 2019
The impact of this economic activity was a Gross $120,000
Regional Product (GRP) in Broome of $1.54b in 2018/19 $108,205
or approximately half the GRP of the Kimberley. On $94,664
Gross Product Per Person
$100,000
$89,803
average, Broome has a marginally higher GRP per
resident than the Kimberley as a whole, though the $80,000
Kimberley has a higher GRP per worker. Both rates are
below the State average ($108,205 per resident) in $60,000
2019, reflecting the impact of mining income and export
related activity on Gross State Product values. The GRP $40,000
of the Shire of Broome has declined marginally in recent
years, in line with declining population growth and $20,000
slowing employment activity.
0
Broome (S) Kimberley WAYou can also read