City of Lomita 2013-2021 Housing Element - February 2014
←
→
Page content transcription
If your browser does not render page correctly, please read the page content below
February
  2014

       City of Lomita
       2013-2021 Housing Element

                    Community Development Department
                 24300 Narbonne Avenue, Lomita, CA 90717
City of Lomita
2013-2021 Housing Element

                             February 2014

         Community Development Department
                    24300 Narbonne Avenue
                          Lomita, CA 90717
2013-2021 Housing Element

Table of Contents
Table of Contents .................................................................................................................. i
List of Tables ........................................................................................................................ii
List of Figures ...................................................................................................................... iii

1.0       Introduction ...................................................................................................... 1
1.1       Purpose of the Housing Element ................................................................................ 1
1.2       Public Participation .................................................................................................... 3
1.3       Format of the Housing Element .................................................................................. 3
1.4       Relationship to Other General Plan Elements ............................................................... 4
1.5       Overview of the City of Lomita ................................................................................... 5
1.6       Sources of Information .............................................................................................. 6

2.0       Community Profile ............................................................................................. 8
2.1       Demographic Characteristics ...................................................................................... 8
2.2       Household Characteristics .........................................................................................13
2.3       Housing Characteristics.............................................................................................15
2.4       Employment and Economic Characteristics .................................................................18
2.5       Housing Costs and Affordability .................................................................................19
2.6       Housing Problems ....................................................................................................22
2.7       Special Needs Population ..........................................................................................24
2.8       Affordable Housing ...................................................................................................29

3.0       Constraints to Housing Development.............................................................. 32
3.1       Non-Governmental or Market Constraints ..................................................................32
3.2       Governmental Constraints .........................................................................................34
3.3       Environmental Constraints ........................................................................................52

4.0       Housing Resources .......................................................................................... 54
4.1       Residential Development Potential .............................................................................54
4.2       Financial Resources ..................................................................................................60
4.3       Administrative Resources ..........................................................................................61

5.0       Policies and Programs ..................................................................................... 62
5.1       Housing Element Policies ..........................................................................................62
5.2       Housing Programs ....................................................................................................63
5.3       Quantified Housing Objectives ..................................................................................70

Appendix A: Review of Past Accomplishments ..................................................................... A-1
Appendix B: Detailed Residential Sites Inventory ................................................................. B-1

City of Lomita                                                                                                                   Page i
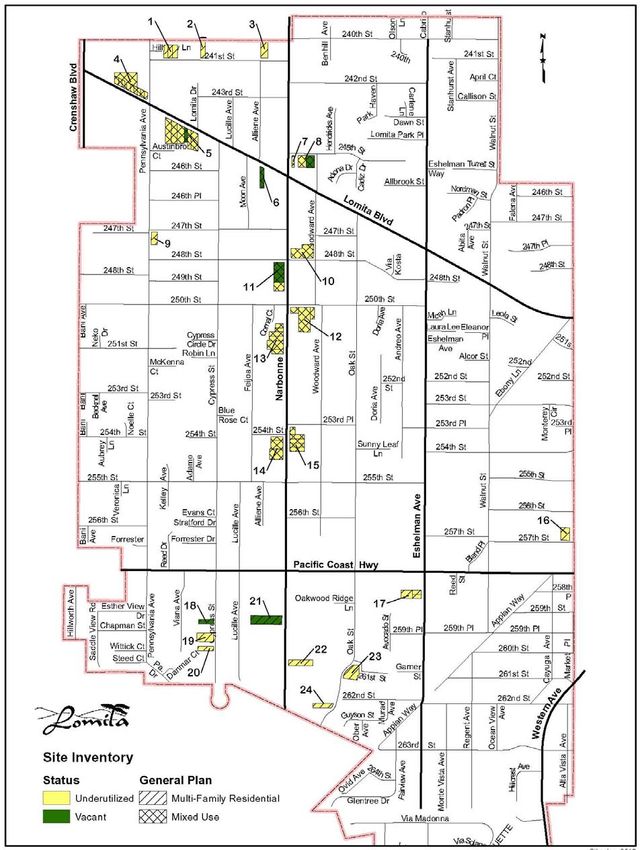
2013-2021 Housing Element

List of Tables
Table   1: Census Tracts in the City of Lomita (2010) ............................................................... 6
Table   2: Population Growth (1990-2010) ............................................................................... 8
Table   3: Population Projections (2000-2035) .......................................................................... 9
Table   4: Population in Census Tracts (2010) ........................................................................ 10
Table   5: Age Characteristics (2000-2010) ............................................................................ 10
Table   6: Age Characteristic Changes (2000-2010) ................................................................ 11
Table   7: Race and Ethnicity Changes (2000-2010) ............................................................... 11
Table   8: Race and Ethnicity Comparison (2010) ................................................................... 12
Table   9: Household Demographics (1990-2010) ................................................................... 13
Table   10: Tenure by Census Tract (2010) ............................................................................ 13
Table   11: Household Income Level (2005-2009) .................................................................. 14
Table   12: Housing Unit Types (2007-2011) .......................................................................... 16
Table   13: Mobile Home Parks (2013) ................................................................................... 16
Table   14: Tenure Changes (1990-2010) .............................................................................. 17
Table   15: Housing Unit Age ................................................................................................ 17
Table   16: Occupations and Wages ...................................................................................... 18
Table   17: Rental Housing Prices .......................................................................................... 19
Table   18: Housing Sale Prices (February 2013) .................................................................... 20
Table   19: Area Median Income Levels ................................................................................. 20
Table   20: Affordable Housing Costs by Income (2013) ......................................................... 21
Table   21: Housing Overpayment (2005-2009) ...................................................................... 23
Table   22: Overcrowding ..................................................................................................... 24
Table   23: Special Needs Populations and Households ........................................................... 24
Table   24: Persons with Disabilities....................................................................................... 25
Table   25: Homeless Shelters ............................................................................................... 28
Table   26: Inventory of Subsidized Rental Housing ................................................................ 29
Table   27: Rental Subsidies Required .................................................................................... 30
Table   28: Lomita Lending Data (2011) ................................................................................ 33
Table   29: Residential Development Standards ...................................................................... 36
Table   30: Residential Parking Standards .............................................................................. 38
Table   31: Provisions for a Variety of Housing Types ............................................................. 40
Table   32: Permit Processing Fees ........................................................................................ 46
Table   33: Comparison of Planning Fees ............................................................................... 47
Table   34: Development Impact Fees ................................................................................... 48
Table   36: Vacant and Underutilized Mixed Use Overlay Sites ................................................. 59
Table   37: Site Inventory by Income and Affordability ........................................................... 60
Table   38: Quantified Housing Objectives: 2008-2014 ........................................................... 70

City of Lomita                                                                                                          Page ii
2013-2021 Housing Element

List of Figures
Figure   1:   Educational Attainment Comparison (2007-2011) ................................................... 12
Figure   2:   Median Household Income Comparison (2011) ...................................................... 15
Figure   3:   Income and Affordability (2012) ........................................................................... 22
Figure   4:   Setback Requirements .......................................................................................... 37
Figure   5:   Potential Site Plan ................................................................................................ 39
Figure   6:   Mixed Use Overlay Zoning Map ............................................................................. 58

City of Lomita                                                                                                              Page iii
2013-2021 Housing Element
1.0 Introduction
1.1 Purpose of the Housing Element
All local governments are required to prepare long-range general plans to consider those issues
germane to the planning for future development. These general plans must contain elements
that consider specific issues such as land use, transportation, housing, health and safety, open
space, and natural resources. In 1967, the housing element became the third mandated general
plan element. During the ensuing years, many revisions have been made to the required scope
and content of housing elements.
Within the past several decades, the State Purpose of the Housing Element
Legislature has focused increased attention on
housing-related issues in California. This The primary purpose of this Housing Element is
attention is due to the State’s continued to identify local housing needs and to identify
measures necessary to mitigate and alleviate
population growth, particularly in the State’s
these needs and problems for all economic
urban areas. This significant growth has placed
segments of the community. Another key
increasing demands on the existing housing objective of this Housing Element is to
resources and has accelerated the need for new underscore the City’s commitment to the State
housing, especially affordable housing. While housing goal, as stated below:
California in general, and Southern California in
particular, are among the fastest growing "The availability of housing is of vital statewide
regions in the Country, the cost for housing is importance, and the early attainment of decent
considerably higher than that for other areas of housing and a suitable living environment for
every California family is a priority of the
the Nation. California has also led the rest of
highest order." (Government Code, Section
the nation in recognizing the need for long-
65581)
range planning to determine how this growth
may be accommodated.
In 1981, Article 10.6 of the Government Code was enacted to better define the scope and
content of local housing elements. This legislation, commonly referred to as the Roos Bill,
required that local housing elements include an assessment of housing needs; an inventory of
housing resources; the identification of those constraints that may impede the development of
new housing; a statement of goals, policies, and objectives; and, a five-year housing program.
More recent revisions have focused on the need to identify affordable housing at risk of
conversion to market rate units and the identification of adequate sites for new residential
development. This Housing Element is in conformance with the requirements of the
Government Code1 and addresses the four major issues listed below:
The determination of the City’s existing and projected housing need;
The identification of strategies that will enable the City to accommodate the identified
need for housing, including affordable housing;
1
California Government Code, § 65581, as amended.
City of Lomita Page 1
2013-2021 Housing Element
The identification of the City’s goals and policies relative to housing; and,
The identification of specific actions the City intends to implement to assist in
accommodating identified needs.
The Government Code further articulates the Legislature's intent in enacting the most recent
revisions to the housing element law:
Local governments must prepare and implement housing elements that, along with
Federal and State programs, will assist in the attainment of the State’s housing goal;
The individual locality is best capable of determining what efforts are required to
contribute to the attainment of the State housing goal, provided that such a
determination is compatible with the State’s housing goals and regional housing needs;
and
Any programs that focus on the improvement and development of housing must be
designed for the housing needs of all economic segments of the community.
The legislature recognized that, in carrying out the aforementioned objectives, each local
government also has the responsibility to consider economic, environmental, and fiscal factors,
as well as community goals set forth in the general plan, and to cooperate with other local
governments and the State in addressing regional housing needs.
State law is very specific concerning the scope
State Review of Housing Elements
and contents of housing elements. The State
Legislature understands the importance of local The Housing Element is one of the two
housing elements in implementing statewide general plan elements that must be reviewed
goals for providing decent and suitable housing by a state agency prior to adoption.
for all persons. The Legislature also recognizes According to Section 65581 of the
the importance of providing affordable housing Government Code, all housing elements
for those low or moderate income households. prepared by local governments must be
State law makes it clear that the provision of submitted to the State’s Department of
affordable housing is the responsibility of all local Housing and Community Development
(HCD). The HCD must submit comments to
governments and, using vested powers, local
the City regarding the Element’s
governments should make a conscious effort to conformance to State law as to scope and
see that there are housing opportunities for all content. An element that has been
income groups. The following concerns are the “certified” by HCD is desirable in that such
focus of the Lomita Housing Element: certification will facilitate the acquisition of
grants and future development approvals.
Local governments should recognize their
responsibilities in contributing to the attainment of the State’s housing goals;
Cities and counties should prepare and implement housing elements coordinated with
State and Federal efforts in achieving the State’s housing goal;
City of Lomita Page 2
2013-2021 Housing Element
Each jurisdiction should participate in determining the necessary efforts required to
attain the State’s housing goals; and
Local governments must cooperate with other local governments to address regional
housing needs.
State law requires that the Housing Element be updated periodically. This Housing Element for
the City of Lomita covers the planning period of October 15, 2013 through October 15, 2021.
1.2 Public Participation
The City created a Housing Element fact sheet for distribution at public counters (such as the
City Hall and the public library). This fact sheet provides a simple summary of the Housing
Element requirements and key housing programs offered by the City. Residents were
encouraged to provide comments regarding housing needs on the fact sheet. However, no
response was received from residents.
The City conducted two public hearings to receive public comments on the Draft Housing
Element - September 9, 2013, before the Planning Commission and October 8, 2013, before the
City Council. The hearing notices were posted at City Hall bulletin boards, the Library, Post
Office, and Lomita Park. The notices were also emailed to residents on the City’s distribution
list and to the Daily Breeze, as well as sent to the City of Torrance via mail. At both hearings,
one resident spoke to support the Housing Element and encouraged future development to
occur in the Mixed Use Overlay area, away from established low-density residential
neighborhoods.
The Draft Housing Element was available for public review on City website, City Hall, and
Library. No comment on the Draft Housing Element was received.
The City held a public hearing before the City Council on February 3, 2014 for the adoption of
the Housing Element. Notice of the public hearing was published in the Daily Breeze and sent
to developers and service providers. In addition, the City circulated the Initial Study for the
Housing Element for public review.
1.3 Format of the Housing Element
The City of Lomita Housing Element consists of five sections that together fulfill the State’s
housing element requirements. These sections are organized in a manner that will facilitate
future updating in accordance with State law. These sections include the following:
Section 1.0 – Introduction
This section provides an overview of the purpose and authority of the Element, as well
as an overview of its organization.
City of Lomita Page 3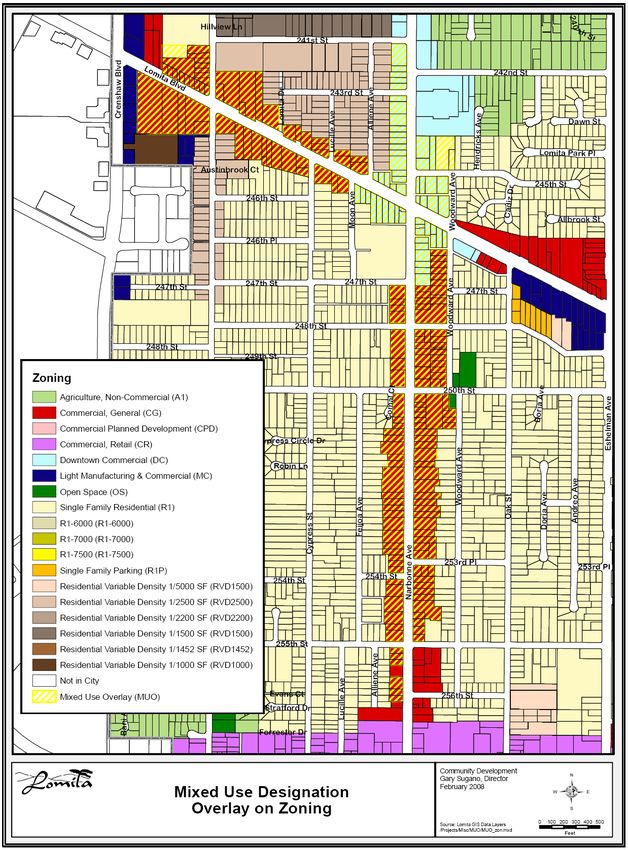
2013-2021 Housing Element
Section 2.0 - Community Profile
The background analysis that serves as the basis for the development of housing policy
is detailed in this section. Key topics considered in this section include the City’s
demographic characteristics, the characteristics of the existing housing stock, household
characteristics, and socioeconomic characteristics.
Section 3.0 - Land Use and Housing Need
The existing and projected housing need for the City of Lomita is discussed in this
section. In addition, the City’s land use policy, as it relates to the conservation of
housing, residential development, and housing production, is discussed.
Section 4.0 - Housing Constraints
Those issues that could constrain the development and/or maintenance of housing,
especially affordable housing, are identified in this section. These constraints are
considered according to the following subject categories: governmental constraints, land
use controls, non-governmental constraints, and environmental constraints.
Section 5.0 - Policies and Programs
The City’s long-range plans for accommodating existing and projected housing needs, as
well as the maintenance and rehabilitation of housing in the City, are detailed in this
section.
1.4 Relationship to Other General Plan Elements
The Elements that comprise the Lomita General Plan are required by State law to be internally
consistent. Together these Elements provide the framework for the development of facilities,
services, and land uses necessary to address the needs and desires of the City’s residents. To
ensure that these needs are clearly addressed throughout the General Plan, the Elements must
be interrelated and interdependent. This Housing Element is most directly related to the Land
Use Element, since it is the Land Use Element that designates the location and extent of
residential development throughout the City.
With respect to the City’s existing adopted General Plan, the following findings of conformity
may be made:
This Housing Element does not propose any changes in land uses or in zoning that
would result in any inconsistencies with the adopted Land Use Element or with the other
General Plan Elements;
This Housing Element will not change the adopted land use and/or development
standards included in the Land Use Element;
This Housing Element does not promote or propose any land use changes requiring the
installation of any new streets or infrastructure not already anticipated in the General
Plan;
City of Lomita Page 4
2013-2021 Housing Element
The City's ability to accommodate new residential development is limited. As a result,
the focus of this Element is to identify strategies that will be effective in conserving
existing housing, while at the same time, to investigate opportunities to accommodate
new infill residential development; and,
Finally, this Element updates important background information used in the evaluation
and/or formulation of housing policy.
The City understands that upon adoption of the Housing Element, the City is required to amend
the Safety and Resource Management Elements of the General Plan as necessary to address
flood hazards and flood management, pursuant to AB 162.
1.5 Overview of the City of Lomita
The City of Lomita is located 26 miles south of downtown Los Angeles and is bounded by the
City of Torrance on the north and west; the City of Los Angeles to the east; the City of Rolling
Hills Estates on the southwest; and the City of Rancho Palos Verdes and unincorporated County
land on the southeast. The City’s total land area is 1,261 acres or 1.97 square miles.
Freeway access to the City is provided indirectly by Pacific Coast Highway (SR-1), which is
oriented in an east-west direction through the City’s southern section. Pacific Coast Highway
connects to the Harbor Freeway (SR-110) approximately 3.5 miles to the east of the City.
Crenshaw Boulevard and Western Avenue are major arterial roadways along the western and
eastern borders of the City of Lomita, respectively. These two roadways provide connections to
the San Diego Freeway (I-405) approximately 8.0 miles to the north.
The City of Lomita “began” as a residential tract (Lomita Subdivision) in the early 1900s and
became part of the oil drilling land and agricultural area in the 1920s. The Lomita Subdivision
consisted of seven square miles in 1907. As the lots were sold, water wells, a school, a general
store (with a post office), and other businesses soon followed. In 1923, oil in the area was
discovered while drilling for water. The resulting “oil boom” in the area led to the conversion of
undeveloped residential lots into oil fields. Rapid growth occurred in the Lomita area, as egg
ranches, fruit orchards, and agricultural uses formed the community. Prior to World War II,
Lomita became a center for the agriculture and oil extraction activities in the South Bay area.2
In the 1940s and 1950s, portions of the Lomita Subdivision were annexed by adjacent cities.
By 1964, only 1.87 square miles of the Lomita Subdivision remained when the City of Lomita
finally incorporated. The City subsequently annexed land to the southeast and now includes
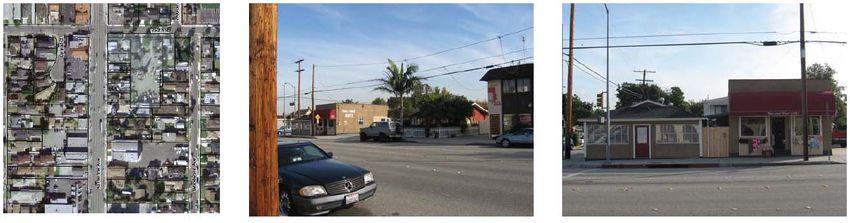
1.97 square miles within the City’s corporate boundaries. Today, the City is almost completely
developed, and the remaining vacant land is limited to scattered parcels. Existing development
in the City is characterized by residential neighborhoods at varying densities, with commercial
uses concentrated along Pacific Coast Highway, Lomita Boulevard, Crenshaw Boulevard,
Narbonne Avenue, and Western Avenue. The City's population according to the 2010 Census
was 20,256.
2
City of Lomita. General Plan, 1998.
City of Lomita Page 52013-2021 Housing Element
1.6 Sources of Information
There are six census tracts located in the City of Lomita: Tract Numbers 2951.01, 6700.01,
6700.02, 6700.03, 6701, and 6707.01. The census tracts found in the City, and the
corresponding areas included within each tract, are described in Table 1. Table 1 also indicates
the number of persons and the number of housing units located within each tract, according to
the 2010 Census statistics. Finally, the census tracts that comprise the City are shown in Table
1.
Table 1: Census Tracts in the City of Lomita (2010)
Census
# Persons # Units Area of City
Tract
This tract is bounded on the west by Western Avenue, on the
9800.15 0 0 north by the Palos Verdes Drive North, on the east and south
by the Naval Reservation.
This tract is bounded on the west by Crenshaw Boulevard, on
6700.01 3,311 1,334 the north by the City of Torrance, on the east by Walnut
Street and Harbor City, and on the south by Lomita Boulevard.
This tract is bounded on the west by Oak Street, on the north
6700.02 4,001 1,522 by Lomita Boulevard, on the east by Harbor City, and on the
south by Pacific Coast Highway.
This tract is bounded on the west by the City of Torrance and
the Torrance Municipal Airport, on the south Pacific Coast
6700.03 5,788 2,475
Highway, on the east Oak Street, and on the north Lomita
Boulevard.
This tract is bounded on the west by the City of Torrance and
City of Rolling Hills Estate, on the north by Pacific Coast
6701 6,659 2,875
Highway, on the east by Harbor City, and on the south by
Palos Verdes Drive North.
This tract is bounded on the west by the City of Rolling Hills
Estate, on the north by Palos Verdes Drive North, on the east
6707.01 497 206
by Western Avenue , and on the south by the City of Rancho
Palos Verdes.
Source: U. S. Census Bureau, 2010 Census.
A number of additional sources were consulted during the preparation of this analysis,
including:
Decennial Census: Census (2000 and 2010) data collected by the Census Bureau
provide basic information of housing and population counts for the City of Lomita.
American Community Survey (ACS): The 2010 Census did not include a “long form”
for detailed demographic and housing characteristics. Such data are collected through a
series of small sample surveys known as the American Community Surveys. Different
sets of ACS data are used to update this Housing Element, depending on the specific
data and how often they are collected for the City of Lomita.
City of Lomita Page 62013-2021 Housing Element
Home Mortgage Disclosure Act (HMDA): This data collected by the Federal
Financial Institutions Examination Council provide information on the availability of
mortgage financing.
Labor Market Statistics: Unemployment and wage data from the State Employment
Development Department are used to describe the local and regional employment
characteristics.
City of Lomita Page 72013-2021 Housing Element
2.0 Community Profile
This section of the Lomita Housing Element provides an overview of the demographic, housing,
and socioeconomic characteristics of the City of Lomita. The information contained herein
indicates those trends that have occurred in the Lomita in the years following the City’s
incorporation in 1964. This section of the Element considers the following:
Demographic Characteristics, including population growth trends in the City, age
characteristics, and ethnicity;
Housing Characteristics focuses on trends in residential development, housing unit
types, and housing tenure;
Household Characteristics provides an overview of the key socioeconomic
characteristics germane to housing need;
Employment and Economic Characteristics describes those economic and market
factors relevant to the maintenance of existing housing and the production of new
housing in the City; and
Special Housing Needs Groups includes a discussion of those City residents that
have special housing requirements.
2.1 Demographic Characteristics
The type and amount of housing needed in a community is largely determined by population
growth and various demographic variables. Factors such as age, race/ethnicity, and
employment trends work to influence the type of housing needed.
2.1.1 Population Growth Trends
In 1964, at the time of Lomita’s incorporation, the City’s population was approximately 15,000
residents. By the time of the 2000 Census, the population grew to 20,046 and, according to the
2010 Census, the City’s population increased slightly to 20,256 (Table 2).
Table 2: Population Growth (1990-2010)
Year Estimated Population Change % Change
1990 19,382 -- --
2000 20,046 644 3.4%
2010 20,256 210 1.1%
Sources U.S. Census Bureau, 1990 to 2010 Census.
The census data indicates that the City’s population was relatively stable between 1970 and
1980. During the decade following 1970, the City’s population actually declined. Since 2000,
the City’s population growth rate has been stagnant. From 2000 to 2010 Lomita experienced
City of Lomita Page 82013-2021 Housing Element
an average rate of growth of just 0.1 percent annually. The variables affecting this relatively
low growth may be attributed to the lack of vacant land in the City and its aging population.
Similarly, the population of Los Angeles County experienced a growth rate of 0.3 percent per
year. Lomita’s population growth in the past decade is slightly less than that experienced in the
County as a whole.
Estimates of population growth in the City were developed by SCAG as part of the development
of the Integrated Growth Forecast for the Regional Transportation Plan (RTP) and the Regional
Housing Needs Assessment. As shown in Table 3, the City is expected to experience limited
growth over the next 20 to 25 years.
Table 3: Population Projections (2000-2035)
Population
Year Population
Change
20001 20,046 --
2
2008 20,300 +254
20101 20,256 -44
2
2020 21,000 +744
2
2035 21,900 +900
Sources:
1. U.S. Census Bureau, 2000 to 2010 Census.
2. SCAG Integrated Regional Transportation Plan
Growth Forecasts, 2012.
As indicated in the Introduction of this Housing Element, the following six Census Tracts from
the 2010 Census best comprise the incorporated boundary of Lomita:
Tract Number 9800.15 includes the south-east portion of the City, south of Palos
Verdes Drive North and east of Western Avenue and west of the Navel Reservation;
Tract Number 6700.01 includes the north portion of the City, north of Lomita
Boulevard and east of Crenshaw Boulevard;
Tract Number 6700.02 includes the east-central portion of the City, north of Pacific
Coast Highway and west of Arlington Avenue;
Tract Number 6700.03 includes the west-central portion of the City, north of Pacific
Coast Highway and east of Crenshaw Boulevard;
Tract Number 6701.00 includes the south-central portion of the City, south of Pacific
Coast Highway and west of Western Avenue and east of the City of Torrance; and,
Tract Number 6707.01 includes the south-west portion of the City, south of Palos
Verdes Drive North and west of Western Avenue and east of the City of Rolling Hills
Estates.
Table 4 indicates that City population is concentrated in Tract 6700.03 and 6701.00.
City of Lomita Page 92013-2021 Housing Element
Table 4: Population in Census Tracts (2010)
Census Tract Population % of City Total
9800.15 0 0.0%
6700.01 3,311 16.3%
6700.02 4,001 19.8%
6700.03 5,788 28.6%
6701.00 6,659 32.9%
6707.01 497 2.5%
Source: U. S. Census Bureau, 2010 Census.
2.1.2 Age Characteristics
One of the more significant indicators of population growth trends is a population’s age
characteristics. Table 5 charts the age characteristics of the City’s population between 2000
and 2010. As is evident from Table 5, the age cohorts that experienced the greatest amount of
decline were children under the age of nine and adult between 25 and 44, while the senior
population in the City grew significantly.
According to the Census, the median age of the City’s population was 35.5 years. By 2010, the
median age of the City’s population increased significantly to 39.6 years, which is a higher
median age than that reported for County residents (34.8 years). These statistics indicate that
the City’s population is older overall, compared to the age of the larger regional population.
Table 5: Age Characteristics (2000-2010)
Age 2000 2010 Change (#) Change (%)
Under 5 1,577 1,271 -306 -19.4%
5-9 1,647 1,187 -460 -27.9%
10-14 1,286 1,182 -104 -8.1%
15-19 1,012 1,240 228 22.5%
20-24 1,114 1,241 127 11.4%
25-34 3,193 2,742 -451 -14.1%
35-44 3,653 2,957 -696 -19.1%
45-54 2,705 3,340 635 23.5%
55-64 1,679 2,564 885 52.7%
65-74 1,135 1,366 231 20.4%
75 & over 1,045 1,166 121 11.6%
Total 20,046 20,256 210 1.0%
Source: U.S. Census Bureau, 2000 and 2010 Census.
Census data have been reformatted in Table 6 to depict the age statistics provided in Table 5
according to specific age categories (preschool-aged, school-aged, young adults, etc.). The
review of Table 6 underscores the trends discussed previously. The number of younger
children (under five years of age) decreased almost 20 percent while school-aged children (five
to 19 years of age) decreased about nine percent between 2000 and 2010. In contrast, the
City of Lomita Page 102013-2021 Housing Element
City’s senior and retired population increased significantly. These statistics reflect an aging
population in Lomita.
Table 6: Age Characteristic Changes (2000-2010)
Age Category 2000 2010 Change (#) Change (%)
Preschool (under 5) 1,577 1,271 -306 -19.4%
School-aged (5-19) 3,945 3,609 -336 -8.5%
Young Adult (20-34) 4,307 3,983 -324 -7.5%
Middle-age (35-54) 6,358 6,297 -61 -1.0%
Seniors (55-64) 1,679 2,564 885 52.7%
Retired (65+) 2,180 2,532 352 16.1%
Total 20,046 20,256 210 1.0%
Source: U.S. Census Bureau, 2000 and 2010 Census.
2.1.3 Race and Ethnicity
Table 7 compares the 2000 and 2010 Census data that categorizes race and ethnicity for the
City’s population. In 2000, Lomita’s population was predominantly white (66 percent), with
approximately four percent Black, less than one percent American Indian/Eskimo, and about 12
percent Asian or Pacific Islander. By 2010, the white population decreased to 59 percent while
the Black, Asian or Pacific Islander, American Indian, and Eskimo population, as well as people
of other races increased. The US Census classification for White persons included Hispanics
(Hispanics were classified as individuals with Spanish surnames in the 2000 and 2010 Census).
The City’s proportion of Hispanics increased from 26 percent in 2000 to 33 percent by 2010, as
indicated in Table 7. The Census allowed respondents to classify themselves as belonging to
two or more races for the first time. About 20 percent of the City’s population classified
themselves as belonging to “Other” races.
Table 7: Race and Ethnicity Changes (2000-2010)
Race or Ethnicity 2000 2010 Change % Change
White 13,263 11,987 -1,276 -9.6%
Black 838 1,075 237 28.3%
American Indian Eskimo 141 174 33 23.4%
Asian or Pacific Islander 2,392 2,923 531 22.2%
Other 3,412 4,097 685 20.1%
Total 20,046 20,256 210 1.0%
Hispanic 5,252 6,652 1,400 26.7%
Source: U.S. Census, 2000 and 2010 Census.
Table 8 below compares the racial and ethnic makeup of Lomita to neighboring communities.
Like Lomita, Rancho Palos Verdes and Rolling Hills have approximately 60 percent White
residents. However, Rancho Palos Verdes, Rolling Hills Estates and Torrance have much larger
Asian populations than Lomita and the City of Los Angeles.
City of Lomita Page 112013-2021 Housing Element
Table 8: Race and Ethnicity Comparison (2010)
Rancho Rolling
Race/ Ethnicity Lomita Los Angeles Torrance
Palos Verdes Hills Estates
White 59.2% 49.8% 61.7% 67.7% 51.1%
Black 5.3% 9.6% 2.4% 1.4% 2.7%
American Indian 0.9% 0.7% 0.2% 0.2% 0.4%
Asian or Pacific Islander 15.1% 11.4% 29.1% 25.0% 34.9%
Other 19.5% 28.4% 6.6% 5.7% 10.9%
Total 20,256 3,792,621 41,643 8,067 145,438
Hispanic 32.8% 48.5% 8.5% 6.2% 16.1%
Source: U.S. Census Bureau, 2010 Census.
Note: Other category includes Pacific Islander, other races and people who are more than one race.
2.1.4 Educational Attainment
The educational attainment of Lomita’s population compared to California’s population over the
age of 25 is presented in Figure 1 below. Most Lomita residents have completed high school
and have some college experience. Lomita’s education attainment is comparable to the rest of
the state of California. California has a slightly higher proportion of residents with college
degrees while Lomita has slightly more residents with a high school diploma or equivalency.
Education attainment is strongly correlated with earnings potential which is linked to housing
choices. About 37 percent of Lomita residents have a college degree.
Figure 1: Educational Attainment Comparison (2007-2011)
30.0%
25.0%
20.0%
15.0%
10.0%
5.0%
0.0%
Some High Advanced2013-2021 Housing Element
2.2 Household Characteristics
2.2.1 Household Characteristics
According to criteria established by the U.S. Census Bureau, a household consists of the
occupants of a housing unit. A household may consist of one individual, a family, or a number
of unrelated individuals. However, a “family household” is defined as a household consisting of
two or more individuals related by blood, marriage, or adoption.
Table 9 lists the household characteristics for the City. As shown, the number of housing units
in the City experienced only slight increases between 1990 and 2010, consistent with the limited
increases in population during this same period. With the limited growth in population and
housing stock, average household size in the City remained stable between 2000 and 2010.
Table 9: Household Demographics (1990-2010)
% Change % Change
1990 2000 2010
1990-2000 2000-2010
Population 19,382 20,046 20,256 3.4% 1.0%
Dwelling Units 8,255 8,335 8,412 1.0% 0.9%
Families 4,928 5,035 5,050 2.2% 0.3%
Households 7,859 8,015 8,068 2.0% 0.7%
Household Size 2.44 2.50 2.49 2.5% -0.4%
Sources: U. S. Census Bureau, 1990 to 2010 Census
Smaller housing units are concentrated in the central portion of the City, while the larger units
(with correspondingly larger household sizes) are located at the northern and southern areas of
the City. According to the 2010 Census data, the average household size was smallest in
Census Tract 6701.00 (2.39 persons per household). Census tract 6700.02 had the largest
average household size of 2.71 persons (Table 10).
Table 10: Tenure by Census Tract (2010)
6700.0 6700.0 6700.0
Tenure 6701.00 6707.01 9800.15 City
1 2 3
Owner-Occupied 807 518 1,099 1,242 72 0 3,738
Average Household Size 2.47 2.77 2.47 2.33 2.01 0.00 2.46
Renter-Occupied 477 950 1,257 1,519 127 0 4,330
Average Household Size 2.01 2.68 2.42 2.45 2.77 0.00 2.52
Overall Average Household Size 2.52 2.71 2.44 2.39 2.50 0.00 2.49
Source: U. S. Census Bureau, 2010 Census.
City of Lomita Page 132013-2021 Housing Element
2.2.2 Household Income
For purposes of determining eligibility for housing assistance, the State Department of Housing
and Community Development (HCD) has established the following income groups based on the
Area Median Income (AMI) of a Metropolitan Statistical Area (MSA):
Extremely Low Income: 0-30 percent AMI
Very Low Income: 31-50 percent AMI
Low Income: 51-80 percent AMI
Moderate Income: 81-120 percent AMI
Above Moderate Income: >120 percent AMI
Collectively, households with Extremely Low, Very Low, and Low incomes are referred to as
lower income households.
Table 11 presents household income by income group based on ACS data. According to the
Southern California Association of Governments (SCAG), 32 percent of the City’s households
were lower income, 17 percent were moderate income, and 51 were above moderate income.
Table 11: Household Income Level (2005-2009)
Income Number1 % of Total
Extremely Low 691 9.4%
Very Low 681 9.2%
Low 1,018 13.8%
Moderate 1,243 16.8%
Above Moderate 3,753 50.8%
Total 7,386 1.0%
Note: Number of households by income level is based on
ACS, which are sample data and therefore, do not always
total to the 100% count of the 2010 Census.
Source: SCAG, Housing Element Assistance – Existing
Housing Needs Data Report, based on 2005-2009 ACS.
Median Household Income
Household income is an important consideration when evaluating housing and community
development needs because lower income typically constrains a household's ability to secure
adequate housing or services. While housing choices, such as tenure (owning versus renting)
and location of residences are very much income-dependent, household size and type often
affect the proportion of income that can be spent on housing.
The median household income in Lomita was $61,327 in 2011. The City’s median income was
higher than the City of Los Angeles but lower than other neighboring cities Figure 2. It was
significantly lower than Rancho Palos Verdes and Rolling Hills Estates.
City of Lomita Page 142013-2021 Housing Element
Figure 2: Median Household Income Comparison (2011)
$160,000 $151,757
$140,000
$116,643
$120,000
$100,000
$75,885
$80,000
$61,327
$60,000 $50,028
$40,000
$20,000
$-
Lomita Los Angeles Rancho Palos Rolling Hills Torrance
Verdes Estates
Source: U. S. Census Bureau, 2007-2011 ACS.
2.3 Housing Characteristics
A community’s housing stock is defined as the collection of all residential dwelling units located
within the jurisdiction. The characteristics of the housing stock, including growth, type, age and
condition, tenure, vacancy rates, costs, and affordability are important in determining the
housing needs for the community. This section details Lomita’s housing stock characteristics in
an attempt to identify how well the current housing stock meets the needs of current and future
residents of the City.
2.3.1 Housing Unit Types
According to the 2010 Census, there were 8,412 housing units in the City in 2010. The 2007-
2011 ACS estimates that 49 percent of these units were classified as single-family detached
units (Table 12). Single-family “attached” units accounted for 11.8 percent of the City’s housing
stock. Approximately 5.8 percent of the units were mobile homes.
City of Lomita Page 152013-2021 Housing Element
Table 12: Housing Unit Types (2007-2011)
Los Angeles County City of Lomita
Unit Type Number of Number of
% of Units % of Units
Units Units
Single-Family Detached 1,713,982 49.9% 3,972 49.0%
Single-Family Attached 226,826 6.6% 955 11.8%
2-4 Units 280,110 8.1% 516 6.4%
5+ Units 1,159,643 33.7% 2,179 27.0%
Mobile Homes/Others 57,023 1.7% 476 5.8%
Total 3,437,584 1.0% 8,098 100.00%
Note: Number of housing units by unit type is based on ACS, which are sample data and therefore, do
not always total to the 100% count of the 2010 Census.
Source: U.S. Census Bureau, 2007-2011 ACS.
Fifteen mobile home parks are located in the City, occupying approximately 27 acres and
including 528 mobile homes. These mobile home parks, and the number of spaces they
contain, are listed in Table 13.
Table 13: Mobile Home Parks (2013)
Name Address Units Name Address Units
Bon-Aire Trailer 2355 Lomita
25615 Narbonne 18 Palo Vista MP 21
Park Boulevard
Capri Mobilehome 2436 Lomita 1851 Lomita
20 Palm TP 32
Parl Boulevard Boulevard
Cozy Trailer Court 25338 Walnut 26 Oak TP 26006 Oak Street 30
Crestview Lodge 2350 W. 250th 25344
58 Orchard TP 54
Mobilehome Park Street Pennsylvania
Elms Mobilehome 2101 W. 245th
29 Retreat TP 25841 Walnut 44
Park Street
24100 24725
Grandview MHP 40 Rolling Hills TP 72
Pennsylvania Pennsylvania
2325 Lomita
Hillview Trailer Park 8 Royal TP 24630 Eshelman 32
Boulevard
Lomita Lane Trailer 1901 Lomita Total Mobile Home
44 528
Park Boulevard Units
Source: State Department of Housing and Community Development, 2013
2.3.2 Housing Tenure
Housing tenure statistics for the City derived from the 1990 to 2010 Census are summarized in
Table 14. The percentage of owner-occupied units in the City has remained relatively stable
given the limited housing growth in the City.
City of Lomita Page 162013-2021 Housing Element
Table 14: Tenure Changes (1990-2010)
1990 2000 2010
Housing Tenure
# % # % # %
Owner-Occupied Units 3,585 45.5% 3,739 46.7% 3,738 46.3%
Renter-Occupied Units 4,286 54.5% 4,276 53.3% 4,330 53.7%
Total Occupied Units 7,871 100.0% 8,015 100.0% 8,068 100.0%
Source: U. S. Census Bureau, 1990 to 2010 Census.
Vacancy
A vacancy rate is often a good indicator of how effectively for-sale and rental units are meeting
the current demand for housing in a community. Vacancy rates of five to six percent for rental
housing and one to two percent for ownership housing are generally considered optimum,
where there is a balance between the demand and supply for housing. A higher vacancy rate
may indicate an excess supply of units and therefore price depreciation, while a low vacancy
rate may indicate a shortage of units and resulting escalation of housing prices. The 2010
Census data indicated that the overall vacancy rate in Lomita was 4.1 percent, inclusive of
second homes, and units rented or sold but not occupied. In 2010, 1.8 percent of units were
available for rent and 0.2 percent were for sale, indicating a very tight market.
2.3.3 Housing Condition
Table 15 depicts statistics on the age of the housing units in Lomita according to the 2007-2011
ACS. More than 40 percent of the housing units in the City were constructed prior to 1960,
comparable to the County as a whole (47 percent). The ACS shows that approximately 86
percent of the Lomita’s housing stock is more than 30 years old. The majority of these older
units are found near the central portion of the City, on scattered large lots, where newer units
are also located.
Table 15: Housing Unit Age
Year Units Built Units (#) Units (%)
2005 or after 0 0.0%
2000-2004 114 1.4%
1990-1999 306 3.8%
1980-1989 706 8.7%
1970-1979 1,398 17.3%
1960-1969 1,965 24.3%
1950-1959 1,798 22.2%
1940-1949 848 10.5%
1939 and earlier 963 11.9%
Total 8,098 100.0%
30 years or older 7,087 86.1%
50 years or older 3,675 44.6%
Note: Number of units extrapolated from sample survey and deviates
slightly from the 100% count.
Sources: U.S. Census Bureau, 2007-2011 ACS.
City of Lomita Page 172013-2021 Housing Element
An important indicator of the existing condition of the housing supply is the number of
structurally substandard units, or units needing rehabilitation or replacement. While the
majority of the housing units within the City are in relatively good condition, as the existing
stock ages, the number of housing units needing rehabilitation is expected to increase.
Residential neighborhoods between Pacific Coast Highway and Lomita Boulevard were
constructed on large lots between the 1940s and 1960s. They contain many of the City's older
housing units. Neighborhoods south of Pacific Coast Highway developed during the 1970s and
1980s, and consist largely of newer housing units on uniform-sized lots in subdivisions.
Based on the results of a previous housing conditions survey, approximately three percent (250
units) of the housing stock in the City might require minor repairs, another 0.5 percent (42
units) with major repair needs, and 0.1 percent (eight units) would be deemed substandard.
These substandard units will require major rehabilitation, and may be better replaced than
repaired.
2.4 Employment and Economic Characteristics
According to the 2007-2011 ACS, 10,855 Lomita residents over the age of 16 were in the labor
force. Among these residents, 10,149 were employed with an unemployment rate of 6.4
percent. The State Employment Development Department reported a higher unemployment
rate of 7.5 percent as of February 2013.
Table 16 tabulates occupations of Lomita residents according to the 2007-2011 ACS, and
correlates the occupations with current (2012) wage scales in Los Angeles County. Among the
employed residents, about one-third held managerial and professional occupations that usually
command higher pays than service- and sales-oriented occupations. However, a large number
of Lomita residents were employed in lower-wage jobs with annual income less than $50,000,
below the median of all occupations.
Table 16: Occupations and Wages
2007-2011 2012 Median
Occupation
Employees % Wage in LA County
Management - $124,479
Managers/Professionals 3,565 35.1%
Engineering - $91,631
Food - $22,019
Service 1,689 16.6%
Personal - $27,415
Sales and Office 3,276 32.2% $40,620
Natural Resources/ Natural Resource - $26,132
Construction/ 858 8.5% Construction - $52,784
Maintenance Maintenance - $48,264
Production/ Production - $32,269
761 7.5%
Transportation Transportation - $33,839
Total 10,149 100.0% $52,381
Sources: U.S. Census Bureau, 2007-2011 ACS; State Employment Development Department, Labor
Market Statistics, First Quarter 2012.
City of Lomita Page 182013-2021 Housing Element
The employment opportunities in Lomita are located mainly in the commercial retail and service
sectors found along the major roadways in the City. This limited employment base suggests
that most residents work outside the City in major employment centers in Torrance, Long
Beach, the Harbor, and the Carson-Compton area.
2.5 Housing Costs and Affordability
Housing affordability is a major consideration in providing suitable housing. The cost of housing
itself is not a problem, unless households in the area cannot find adequately sized units at an
affordable price. Affordability is defined as paying 30 percent or less of the gross monthly
income for housing, based on both State and federal standards.
2.5.1 Housing Costs
Rental Housing
According to data compiled from Craigslist.org shows that rental housing rates in Lomita are
among the lowest when compared to neighboring communities. The average rent for an
apartment in Lomita is $1,163 (Table 17), comparable to average rents at Carson ($1,025) and
Torrance ($1,120). Similarly, homes in Lomita are also renting at lower rates compared to
surrounding communities.
Table 17: Rental Housing Prices
Rancho
Redondo Manhattan
Housing Unit Lomita Torrance Palos Carson
Beach Beach
Verdes
Apartments
1 Bedroom $1,075 $1,090 $1,625 $1,025 $2,600 $1,925
2 Bedrooms $1,280 $1,350 --- --- --- $1,695
Average $1,163 $1,120 $1,625 $1,025 $2,600 $1,848
Rental Homes and Townhomes
1 Bedroom $1,175 --- --- --- $1,695 ---
2 Bedrooms $1,623 --- $2,108 $1,600 $2,650 $3,288
3 Bedrooms $2,300 $2,800 $3,167 $1,750 $3,306 ---
4 Bedrooms --- $2,800 $5,000 $2,250 --- $3,288
Average $1,749 $2,800 $2,975 $1,783 $3,054 $3,288
Sources: http://losangeles.craigslist.org/apa/, accessed April 2013.
For-Sale Housing
Table 18 shows the home sales data in February 2013. Median price of single-family homes in
Lomita was $401,000, representing a 16-percent decrease than the price recorded in February
2012. This median price was similar to the $405,000 reported in December 2008. Only two
condominium sales were recorded during the month of February 2013, with an increase of 35
percent compared to one year prior.
City of Lomita Page 192013-2021 Housing Element
Table 18: Housing Sale Prices (February 2013)
Price Price
Sales of
Median Change Sales of Median Change
ZIP Single-Family
Price from Condominiums Price from
Homes
2/2012 2/2012
90717 7 $401,000 -15.6% 2 $254,000 35.5%
Source: www.dqnews.com, accessed April 2013.
2.5.2 Affordability
Housing affordability can be estimated by comparing the affordable housing cost of owning or
renting a home in the City with the maximum affordable housing cost for households at
different income levels. Together, this information can show who can afford what size and type
of housing and indicate the type of households most likely to experience overpayment and
overcrowding. Table 19 shows the affordable housing cost guidelines established in Section
50052.5 and 50053 of the California Health and Safety Code. The guidelines are based on the
median income calculated by the California Department of Housing and Community
Development (HCD) income limits.
Table 19: Area Median Income Levels
Income Level For Sale Rental
Extremely Low 30% of 30% of AMI 30% of 30% of AMI
Very Low 30% of 50% of AMI 30% of 50% of AMI
Low 30% of 70% of AMI 30% of 60% of AMI
Moderate 35% of 110% of AMI 35% of 110% of AMI
Note: Affordability Levels should be adjusted for household size.
Using the State income limits on maximum housing cost-to-income ratios, the maximum
affordable home rental and purchase prices are presented in Table 20.
Based on the rental and home sale prices presented in Table 17 and Table 18, most extremely
low and very low income households would not be able to afford housing in Lomita. Some low
income households may be able to afford condominiums, but not single-family homes in Lomita.
Only small rental units are affordable to low income households. Moderate income households
are generally able to afford market rents and condominiums as well as smaller single-family
homes (Table 20).
Figure 3 illustrates the median wages for different occupations and the income needed to
purchase the median home (sale price based on Table 18) and median rental housing (based
on Table 17). The only occupation paying enough to own a home or rent an apartment in
Lomita is a management position. Professional occupations pay well enough to afford rent in
the City but a single-income household would not be able to purchase a home. Service oriented
positions generally cannot afford average rents in the City.
City of Lomita Page 202013-2021 Housing Element
Table 20: Affordable Housing Costs by Income (2013)
Affordable Costs Utilities Taxes
Annual and Afforda Affordable
Household Owners Rente Owne
Income Rental Insura ble Rent Home Price
hip rs rs nce
Extremely Low Income (under 30% MFI)
1-Person $17,950 $449 $449 $76 $82 $90 $373 $64,468
2-Person $20,500 $513 $513 $88 $96 $103 $425 $73,079
3-Person $23,050 $576 $576 $106 $117 $115 $470 $80,061
4-Person $25,600 $640 $640 $127 $142 $128 $513 $86,112
5-Person $27,650 $691 $691 $146 $165 $138 $545 $90,301
Very Low Income (31 to 50% MFI)
1-Person $29,900 $748 $748 $76 $82 $150 $672 $120,091
2-Person $34,200 $855 $855 $88 $96 $171 $767 $136,848
3-Person $38,450 $961 $961 $106 $117 $192 $855 $151,743
4-Person $42,700 $1,068 $1,068 $127 $142 $214 $941 $165,707
5-Person $46,150 $1,154 $1,154 $146 $165 $231 $1,008 $176,413
Low Income (51 to 80% MFI)
1-Person $47,850 $1,196 $1,196 $76 $82 $239 $1,120 $203,643
2-Person $54,650 $1,366 $1,366 $88 $96 $273 $1,278 $232,037
3-Person $61,500 $1,538 $1,538 $106 $117 $308 $1,432 $259,034
4-Person $68,300 $1,708 $1,708 $127 $142 $342 $1,581 $284,867
5-Person $73,800 $1,845 $1,845 $146 $165 $369 $1,699 $305,115
Moderate Income (81 to 100% MFI)
1-Person $54,450 $1,361 $1,588 $76 $82 $318 $1,285 $276,605
2-Person $62,200 $1,555 $1,814 $88 $96 $363 $1,467 $315,433
3-Person $70,000 $1,750 $2,042 $106 $117 $408 $1,644 $352,903
4-Person $77,750 $1,944 $2,268 $127 $142 $454 $1,817 $389,171
5-Person $83,950 $2,099 $2,449 $146 $165 $490 $1,953 $417,487
Assumptions:
1. California Department of Housing and Community Development (HCD) income limits, 2013.
2. Health and Safety code definitions of affordable housing costs (between 30 and 35 percent of household income
depending on tenure and income level).
3. Housing Authority of the County of Los Angeles (HACoLA) Utility Allowance Schedule, 2012.
4. 20 percent of monthly affordable cost for taxes and insurance.
5. 10 percent down payment.
6. Four percent interest rate for a 30-year fixed-rate mortgage loan.
7. Taxes and insurance apply to owner costs only; renters do not usually pay taxes or insurance.
Source: HCD Income Limits, 2013.
City of Lomita Page 212013-2021 Housing Element
Figure 3: Income and Affordability (2012)
$140,000
$120,000
Income Needed to Buy a Home ($100,100)
$100,000
$124,479
$80,000
$91,631
$60,000 Income Needed to Rent an Apt. ($55,800)
$59,891
$40,000
$52,595
$20,000 $40,620
$29,930
$22,019
$0
Management Engineering Education Protective Sales Healthcare Food Prep
Services Support
Sources: Employment Development Department First Quarter 2012, www.dqnews.com and www.craigslist.org,
Veronica Tam and Associates, 2013.
2.6 Housing Problems
2.6.1 Overpayment (Cost Burden)
Overpayment, also known as cost burden, is defined as households spending more than 30
percent of their gross household incomes on housing costs. HUD’s Comprehensive Housing
Affordability Strategy (CHAS) data provides information on housing overpayments by income
group (Table 21). Overall, 32 percent of households in the City experienced housing
overpayment between 2005 and 2009. However, almost two-thirds of the extremely low and
very low income households and more than half of the low income households overpaid for
housing.
Housing overpayment impacted certain groups more severely than others. Particularly,
overpayment was more prevalent among the following groups:
Elderly homeowners with extremely low incomes
Large family renters with low incomes
Large family homeowners with extremely low and low incomes
City of Lomita Page 22You can also read