Housing Market Assessment for Merthyr Tydfil CBC - B.Line Housing Information
←
→
Page content transcription
If your browser does not render page correctly, please read the page content below
Housing Market Assessment for
      Merthyr Tydfil CBC

               &

   B.Line Housing Information
                         18th November 2010
                                Final Version
Index
List of Figures
List of Tables
Acknowledgements
Chapter Chapter Title Page
Number
1 Introduction 1
2 Demographic and Economic Context 8
3 The Housing Market 18
4 The Future Housing Market 40
5 Housing Need 47
6 The Role of the Private Rented Sector in the Merthyr 62
Tydfil Housing Market
7 The Housing Requirements of Specific Groups 73
8 Summary of the Merthyr Tydfil Local Housing Market 75
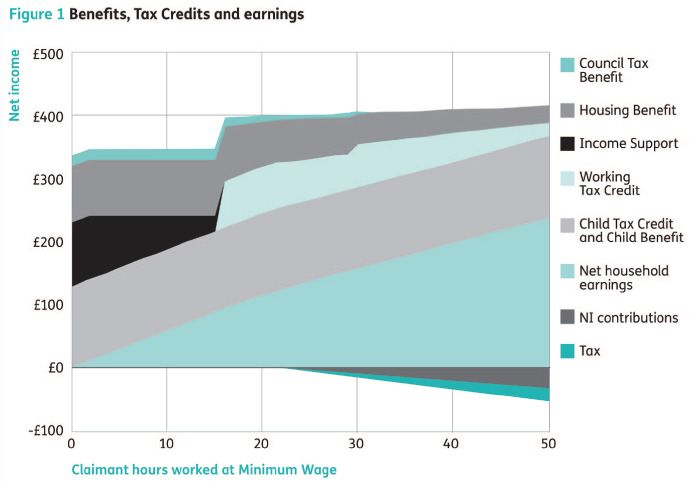
AssessmentList of Figures Figure Page Figure 1. Sub areas used in housing market assessment 6 Figure 2. Proportion of the working age population who are economically active in 14 Merthyr Tydfil, Wales and the UK between March 1999 and June 2009. Figure 3. Proportion of economically active population in employment in Merthyr 15 Tydfil, Wales and the UK March 1999 to June 2009 Figure 4. Proportion of the working age population in receipt of key out of work 16 benefits in Merthyr Tydfil, Wales and the UK between March 1999 and June 2009 Figure 5. Median gross weekly incomes in Merthyr Tydfil, Wales and the UK 16 between 2004 and 2009 Figure 6. Empty properties in Merthyr Tydfil April 2009. 20 Figure 7. Average house prices in Merthyr Tydfil 2000 to November 2009 21 Figure 8. Lower quartile house prices in Merthyr Tydfil May 2004 to November 30 2009 Figure 9. House prices and transactions in Merthyr Tydfil January 2003 to Spring 31 2009 Figure 10. Mortgage advances in the UK from 1990 to 2009. 32 Figure 11. Sales of property in Merthyr Tydfil in 2009 in intervals of £20,000 33 Figure 12. Homelessness presentations and acceptances in Merthyr Tydfil 2002- 37 03 to 2008-09. Figure 13. Homelessness presentations by household type April 2006 to March 38 2008 Figure 14. Trend and policy based population projections 41 Figure 15. Bramley affordability model – summary 48 Figure 16. CACI Paycheck mean incomes by postcode 55 Figure 17. The impact of benefit tapers on take home pay 67 Figure 18. Flows within and between tenures 68
List of Tables

Table                                                                             Page
Table 1. Registrar Generals Mid Year Population Projections for Merthyr Tydfil     8
2001-2007.

Table 2. Population change between 1991 and 2001 by electoral division in          8
Merthyr Tydfil.

Table 3. Population change in housing market sub areas between 2001 and 2007       9

Table 4. Population Profile in Merthyr and Wales                                   9

Table 5. Population of Merthyr Tydfil by Ethnic Background                         9

Table 6. Household types in Merthyr and Wales                                      10

Table 7. Health in Merthyr Tydfil 2001                                             10

Table 8. NI registrations of non-UK nationals by world area of origin              12

Table 9. Workers by nationality registered with the Workers Registration Scheme    12
in Merthyr Tydfil May 2004 to December 2008

Table 10. Age of workers registering with Workers Registration Scheme with         12
employers based in Merthyr Tydfil May 2004 to December 2008

Table 11. The Socio Economic Classification of the Population of Merthyr           13
compared with Wales

Table 12. Economic Activity in Merthyr Tydfil 2007-08                              14

Table 13. Economic Inactivity in Merthyr Tydfil 2007-08                            14

Table 14. Housing Tenure in Merthyr.                                               18

Table 15. Social rented housing stock ownership                                    18

Table 16. Age of Housing Stock                                                     18

Table 17 Types of Accommodation                                                    19

Table 18. Types of Housing and Unfitness                                           19

Table 19. Empty properties in Merthyr Tydfil 2001 to 2009                          19

Table 20. House completions in Merthyr Tydfil 1999-00 to 2008-09                   22

Table 21. Average household income by housing market sub area and electoral        22
ward in Merthyr Tydfil

Table 22. Social lettings in Merthyr Tydfil.                                       36

Table 23. Households registered on the Council’s Housing Waiting List 2004-        36
2010.

Table 24. Reasons for loss of last settled home April 2006 to December 2008        38
List of Tables (continued)

Table                                                                              Page
Table 25. Trend based and policy based population projections for Merthyr Tydfil    41
2001-2021

Table 26. Household changes 2006 – 2016 on preferred policy based projections       42

Table 27. Change in mean and median average incomes by housing market sub           44
area in Merthyr Tydfil 2006 to 2008

Table 28. Under 35 year old households –policy based projection                     50

Table 29. Population changes by sub area, 2001, 2006 and 2007                       51

Table 30. Housing submarket area lower quartile house prices                        52

Table 31. Housing submarket area entry level prices and incomes used for need       52
estimates

Table 32. Mortgage lending in the UK 2004 – 2009                                    53

Table 33. Proportion of emerging households who cannot afford to buy                53

Table 34. CACI lower incomes profile comparison                                     53

Table 35. Annual Survey of Hours and Earnings – Median Weekly Take Home             54
Pay (South East Wales)

Table 36. Housing submarket area incomes 2008                                       55

Table 37 Housing submarket area incomes changes 2006 to 2008                        55

Table 38. Number of households on the housing register by housing submarket         57
area

Table 38. Number of households on the housing register by electoral ward            57

Table 39. Housing Register applicants by ward                                       57

Table 40. Housing submarket area housing register – backlog need allocation         57

Table 41. Housing needs estimates summary                                           58

Table 42. The supply of social rented lets                                          58

Table 43. Housing submarket area social rented lets                                 59

Table 44. Social housing lettings by electoral ward in 2008-09                      59

Table 45 Net need estimates by housing submarket area                               59

Table 46. Social housing shortages and surpluses in Merthyr Tydfil                  60

Table 47. Private rented sector rent levels                                         64

Table 48. Private rented sector affordability test                                  65

Table 49. Housing needs estimate incorporating effects of Housing Benefit in        66
private rented sector
Table 50. Effect of higher rents on tapers and take home income                       68

Table 51. Model flows between tenures based on the Survey of English Housing          69
2005-06

Table 52 Private rented sector supply analysis                                        69

Table 53 Web search of private rented properties available to let in Merthyr Tydfil   69
October 2010

Table 54. Net need estimates by housing sub market area                               70

Table 55. Summary of needs by housing submarket area and implied proportion           75
of planned new supply, based on unable to buy only

Table 56. Summary of needs estimates by sub area and implied proportions of           76
planned new supply, based on unable to buy or rent
Acknowledgements

A substantial amount of data used in this document is drawn from the 2001 Census
and official statistics produced by the Office for National Statistics. Crown Copyright
Material is reproduced with the permission of the Controller of Her Majesty's
Stationery Office and the Queen's Printer for Scotland under click-user licence no.
C2007001417.
Chapter 1          Introduction

A brief description of Merthyr Tydfil
Situated on the border of the Brecon Beacons the administrative area of Merthyr
Tydfil extends 14 miles through the Taff Valley, taking in the Taff Bargoed Valley at
Bedlinog, from the Brecon Beacons National Park in the north to Trelewis in the
South. At its widest the Valley is 5 miles across its administrative area of 55 square
miles, makes it the smallest Unitary Authority in Wales.

Merthyr Tydfil County Borough is bordered to the north by Powys, to the south and
west by Rhondda, Cynon Taff and to the east by Caerphilly. The main population
centre is concentrated in Merthyr Tydfil itself but the area also contains a number of
villages including Troedyrhiw, Aberfan, Bedlinog and Treharris.

While much of the urban areas and the surrounding villages have been built on the
flood plain of the River Taff, many homes were constructed on the slopes of the river
valley. The town’s heritage and history are closely linked to the iron industry. The
built fabric of Merthyr Tydfil has been created over many years and past industrial
activity - particularly the 19th Century iron industry - left the County Borough with a
rich heritage ranging from imposing bridges and viaducts to more humble workers
cottages. The County Borough has 3 Conservation Areas and over 200 Listed
Buildings and Ancient Monuments.

The area has experienced considerable structural economic change over the last
twenty years. The largest sector of the County Borough’s economy - mining and
mineral extraction industries - have effectively been wiped out as a result of changes
to international markets and the electricity supply industry. Consequently, levels of
employment in Merthyr Tydfil declined significantly. Manufacturing and public
administration now account for almost two thirds of employment and both are
focused upon a relatively small number of employers.

Merthyr Tydfil is well served in terms of transportation links. The town of Merthyr
Tydfil is served by a main line train service from Cardiff. Merthyr Tydfil sits on the
junction of two key “A” roads, the A470 north-south link which runs from Cardiff to
Llandudno and the A465 Heads of the Valleys road. The presence of both the railway
and the road system mean that Merthyr Tydfil is relatively easy to access and to
commute from, which offers the area many advantages over neighbouring valleys,
and reinforces Merthyr Tydfil’s position as the regional centre for the Valleys.

Much of the private sector housing stock pre dates 1919, constructed as private
rented homes and much of it was until relatively recently part of the private rented
sector. A significant proportion of post-1919 stock in the area was constructed by the
local authority. There is relatively limited supply of new homes although the extent of
new development has increased in recent years.

The role and purpose of the Housing Market Assessment
         “Local housing assessments are a crucial part of the evidence base for
         preparing Development Plans and local housing strategies”1

This housing market assessment, which has been undertaken by Simon Inkson of
Simon Inkson Ltd and Bob Line of B.Line Housing Information, serves a number of
purposes:

1   Welsh Assembly Government – Local Housing Market Assessment Guide. March 2006

                                                                                         1
• to enable national and regional bodies to develop a long term strategic view
of housing demand and need;
• to inform national and regional spatial strategies;
• to enable the local authority and key stakeholders to think spatially about the
nature and influence of the housing markets in respect to the local area;
• to provide robust evidence to inform policies aimed at providing the right mix
of housing across the whole market – both affordable and market housing;
• to provide evidence to inform policies about the level of affordable housing
required;
• to support the local authority to develop a strategic approach to housing
through consideration of housing need and demand in all sectors of the
market and by providing an assessment of the key drivers and relationships
within the local housing market; and
• to draw together the strands of evidence required for local authorities to
appraise strategic housing options.
Ultimately the main aim of the study is to ensure that by basing policy upon evidence
and intelligence gathered during the housing market assessment the local authority,
key local and regional stakeholders adopt the most effective and appropriate policy
solutions which in turn achieve the most cost effective use of public resources.
The study was initially completed in June 2009 and used as evidence to support the
Council’s Affordable Housing Policy, contained with the Local Development Plan
(LDP). During the LDP examination in December 2009 the Inspector recommended
that the Council revised the Affordable Housing Policy and as part of this process the
Local Housing Market Assessment was updated and revised. The report was
completed in February 2010.
Approach to undertaking the local housing market assessment
This study draws upon a variety of data sources to describe the local housing system
and establish a picture of housing need and estimates for the level of affordable
housing required in the area. The data sources used include the following:
• 2001 Census
• National Statistics
• Registrar General’s Mid Year Population Estimates
• The Welsh Assembly Governments 1997 House Condition Survey
• CACI Paycheck data for Merthyr Tydfil
• The Council’s 2008 Private Sector Stock Condition Survey
• Homelessness trend data from the Data Unit Wales website and from
Merthyr Tydfil CBC
• Land Registry House Price Data
• Data from Hometrack on house valuation and sales prices
• Data from the Welsh Assembly Government’s Social Justice Report
• Data from the Department of Work and Pensions
• Data from the Department of Communities and Local Government
• Data from the Workers Registration Scheme, held by the Local
Government Association
• Information from the Council’s Local Development Plan
• Information from the Joint Housing Land Availability Study
• Information from the Council’s Affordable Housing Delivery Statement
• Information from the Welsh Index of Multiple Deprivation 2008
• Information from various Council databases, including Council Tax,
Housing Benefits, Housing Register and the Integrated Housing
Management system
2• Information from Merthyr Valleys Homes Housing Association, Merthyr
Tydfil Housing Association, Hafod Housing Association and Wales & West
Housing Association on housing stock, lettings and demand for housing
In addition to using quantitative data sources the assessment undertaken by the
consultants also relies upon a number of face-to-face interviews with key
stakeholders. A range of stakeholders were selected both from within the Council
and from external agencies, who could provide useful information about trends within
the local housing system.
Key stakeholders from within the Council who were interviewed during the project
were as follows:
• Chris Edwards & Craig Watkins (Planning)
• Robert Davies, Nicola Aubrey, Paul Bartz & Julia Oliver (Housing
Services)
• David Dier (Public Protection)
• Mark Taylor (Estates)
A range of key stakeholders from outside of the Council were interviewed during the
project, these were as follows:
• Karen Dusgate, Gail Scerri & Debbie Perszon (Merthyr Tydfil Housing
Association)
• Richard McQuillan & Myles Utting (Hafod Housing Association)
• Jenny Williams (Wales & West Housing Association)
Interviews were also held with the following estate and lettings agents located in
Merthyr Tydfil:
• Darlows Estate & Lettings Agents
• Lynsdale Property Management, Lettings Agent
• Peter Alan Estate & Lettings Agents
• Weathersby Estate & Lettings Agents
• Derek Phillips Estate Agent
• Bairstowe Eves Estate and Lettings Agents
• Martin & Co Ltd, Lettings Agent
Each stakeholder provided contextual information that was set alongside the
quantitative data to either describe the local housing system or describe the impact of
external drivers of change on the housing market in Merthyr Tydfil. The authors wish
to thank those stakeholders who participated in the research for the housing market
assessment.
The assessment was also informed by discussions held with private sector house
builders and their representative in May 2009. The following were involved in the
discussions:
• Richard Price (House Builders Federation)
• Rhys Davies (Redrow Homes)
The assessment has draws on guidance produced by both the Welsh Assembly
Government2 and the more recent guidance produced by the Department of
2 Welsh Assembly Government (2006) Local Housing Market Assessment Guide. WAG, Cardiff.
3Communities and Local Government3 to establish projections for the level of
affordable housing required in the area.
The structure of the Housing Market Assessment Report
The document is divided into a series of chapters, which follow the structure
proposed in the guidance mentioned above.
Chapter 2 highlights the demographic and economic profiles of the area and recent
changes in the population and economy of the area.
Chapter 3 provides a description of the housing market in the locality, in terms of the
area as a whole and the 3 housing submarket areas used during the study. The
chapter moves onto provide a description of trends within the housing market and
identifies key issues for policy makers.
Chapter 4 provides a description of key indicators of future demand in the housing
market, including the following:
• population and household structure
• economic factors
• affordability issues
• supply issues
The chapter concludes by drawing out key themes for policy makers.
Chapter 5 provides information about existing and future housing needs in the
locality, considers the future supply of affordable housing in the area and estimates
the requirement for affordable housing in the area.
Chapter 6 focuses on the role of the private rented sector in meeting housing needs
in the area.
Chapter 7 focuses on the housing requirements of specific groups in the population,
where their needs have been identified.
Chapter 8 provides a summary of the key findings from the Housing Market
Assessment.
The report will refer to three housing submarket areas throughout, which are based
on the three key areas in the LDP:
• The Primary Growth Area (Merthyr Tydfil)
• Secondary Growth Area (Treharris and Trelewis)
• Other Growth Areas (Mid Valleys Communities)
The geography of these three housing submarket areas correspond with the
geography of the 3 housing market types found in the South East Wales regional
housing market study undertaken in 20054. The Merthyr Tydfil housing submarket
area corresponds with the geography of the “Heads of the Valleys” housing market
type, the Mid Valleys Communities housing submarket area corresponds with the
geography of the “Mid Valleys” housing market type and the Treharris and Trelewis
3 Department of Communities and Local Government (2007) Strategic Housing Market Assessments;
Assessments;
Practice Guidance. HMSO, London
4Inkson. S, Line, B, Smith. R, and Stirling. T (2005) The South East Wales Regional
Housing Market Study, The Regeneration Institute, Cardiff University, December 2005
4housing submarket area matches the geography of the “North of the M4 corridor”
housing market type.
The Merthyr Tydfil housing submarket area contains the following electoral divisions:
• Vaynor
• Dowlais
• Gurnos
• Penydarren
• Town
• Park
• Cyfartha
• the communities of Pentrebach and Abercanaid from the Plymouth electoral
division
The Mid Valleys Communities housing submarket area contains the following
electoral division and communities:
• Merthyr Vale
• the Troedyrhiw community within the Plymouth electoral division
• the Bedlinog community within the Bedlinog electoral division
The Treharris and Trelewis housing submarket area contains the following electoral
division and community:
• Treharris
• the Trelewis community within the Bedlinog ward
The housing submarket areas used in the study are shown in figure 1.
5Figure 1. Housing sub-market areas used in housing market assessment
Merthyr Tydfil housing submarket area
Mid Valleys Communities housing submarket area
Treharris & Trelewis housing submarket area
This version of the LHMA is a revision undertaken in January 2010 following
discussion at the Examination in Public of the Local Development Plan and
subsequent meetings with officers of the Local Authority and various stakeholders,
including developers, representatives of private landlords, and housing associations.
The estimates of need have been revised, taking out inclusion of the private rented
sector as meeting housing need, in accordance with discussion at the Examination in
Public.
It is notable in this revision how far the housing market had changed even during the
six months or so since the first published version of the LHMA. The trend of in-
migrations has stopped and reversed and income levels have fallen slightly. House
prices have fallen further in Merthyr Tydfil such that entry level prices are now within
the reach of more household if they are able to obtain mortgages. Mortgages havebeen rationed and restricted severely in the wake of the credit crunch and whilst this
trend has eased a little the reason for this are linked in complex ways with the
availability of deposits through intergenerational wealth transfer. There are also now
some sales at very low prices5, suggesting the possibility of the return of low demand
for housing in localised patches.
The housing market is now so dysfunctional and volatile that it has become even
more difficult to estimate needs, demand and viability, and to build an evidence base
which is valid for even a reasonable time on which to plan. This has been widely
recognised by expert opinion6 , research and in a High Court case7 on Planning.
The result is that policy can only provide the most general framework for Planning,
but must remain flexible and adaptable to changing conditions, to develop methods,
techniques, tools and monitoring mechanisms to be able to assess market,
conditions needs, demand, and to consider plans and proposals on an ongoing, and
site by site basis, and not seek to apply any ‘one size fits all’ solutions.
This will require new ways of working and understanding the housing market as a
system, which are already developing but have further to go to keep up with
increasingly rapid changes in reality.
5
as low as £15,000 -£30,000
6
http://www.bshf.org/published-information/publication.cfm?lang=00&thePubID=4FF3F1F7-15C5-F4C0-
99959BAD3ED44A50
7
http://www.bailii.org/ew/cases/EWHC/Admin/2009/3208.html
7Chapter 2 – Demographic and Economic Context
Introduction
This chapter of the housing market assessment will provide information about the
demographic and economic profile of Merthyr Tydfil.
Demographic profile of Merthyr Tydfil
At the time of the 2001 Census the area had a resident population of 55,981, who
lived in 23,145 households. This figure represents a decline of just under 4,000 on
the population recorded ten years previous in the 1991 census. The decrease in the
resident population of Merthyr Tydfil during the 20th Century is linked to the economic
decline in the area, with the closure of indigenous industries. Since the 2001 Census
it is estimated that the population of the area has continued to reduce to 55,600 in
2005. Table 1 shows the Registrar Generals mid year population estimates for
Merthyr Tydfil between 2001-2007. This shows that the rate of population loss has
slowed in recent years and in the year 2006-07 the population of Merthyr Tydfil was
estimated to have grown.
Table 1. Registrar Generals Mid Year Population Projections for Merthyr Tydfil 2001-
2007. Source ONS Registrar General’s Mid Year Population Estimates for Merthyr Tydfil
Net
Population migration & Population
at start of Live Natural other Total at end of
period births Deaths change changes change period
2001-02 56,200 600 700 100 -200 -300 55,900
2002-03 55,900 600 700 - -100 -200 55,700
2003-04 55,700 600 600 - -100 -100 55,600
2004-05 55,600 700 700 - - - 55,600
2005-06 55,600 600 600 100 -200 -100 55,500
2006-07 55,500 700 600 100 - 100 55,600
Table 2 shows the change in population in each of the electoral divisions in Merthyr
Tydfil between the 1991 and 2001 Census. The Treharris ward at the southern most
point of the County Borough is an area that has in the recent past reversed this trend,
with significant in-migration linked to the development of new housing and the
proximity of the ward to major communication routes. Vaynor and Park wards also
experienced growth between 1991 and 2001, related to construction activity. Gurnos
ward lost the greatest numbers during the period, which was linked to the areas
relative unpopularity and clearance activity on the social housing estate.
Table 2. Population change between 1991 and 2001 by electoral division in Merthyr
Tydfil. Source ONS Census 2001
Wards in Merthyr 1991 2001 Population Change
Bedlinog 3,625 3,401 -224
Cyfarthfa 6,726 6,142 -584
Dowlais 7,320 6,646 -674
Gurnos 6,350 5,045 -1,305
Merthyr Vale 4,298 3,932 -366
Park 4,193 4,286 93
Penydarren 5,476 5,252 -224
Plymouth 5,285 5,005 -280
Town 6,646 6,545 -101
Treharris 6,036 6,241 205
Vaynor 3,362 3,478 116
Total 59,317 55,973 -3,344
Table 3 shows the change in population in each of four sub areas used for the
purposes of this study between 2006 and 2007. This shows that the Merthyr Tydfil
8area after losing population between 2001 and 2006 experienced growth between
2006 and 2007. Similarly the Treharris and Trelewis area experienced growth
between 2006 and 2007 after experiencing a loss of population between 2001 and
2006. The Mid Valleys Communities area experienced a loss of population
throughout the period 2001 to 2007.
Table 3. Population change in housing market sub areas between 2001 and 2007. Source.
ONS registrar General Mid Year Population Estimates
Sub Area 2001 2006 2007 Net gain/loss
Merthyr Tydfil 39,552 39,445 39,541 -11
Mid Valleys Communities 8382 8119 8077 -305
Treharris and Trelewis 8273 7966 8001 -272
The 2001 Census established that Merthyr has a proportionately younger population
than Wales as a whole, and this is reflected in both the mean and median average
age in the area being 1 year less than Wales. Table 4 shows the age profile of the
population, compared with the all Wales age profile. Both the mean and median
average is lower than the Welsh figure as a result of the shorter life expectancy of
people living in Merthyr when compared with other areas in Wales. The average life
expectancy of males and females born between 2005 and 2007 in Merthyr Tydfil was
75.5 and 79.4 years, compared with the Wales average of 76.7 and 81.1 years and
the England and Wales average of 77.5 and 81.7 years.8
Table 4. Population Profile in Merthyr and Wales. Source ONS Census 2001
Age Range Merthyr Wales
Percentage of population aged 0 - 9 12.63 12.17
Percentage of population aged 10 – 15 8.88 8.06
Percentage of population aged 16 – 24 10.56 10.89
Percentage of population aged 25 – 44 27.35 26.6
Percentage of population aged 45 - 59 19.18 19.62
Percentage of population aged 60 – 75 13.99 14.37
Percentage of population aged 75+ 7.41 8.29
At the time of the 2001 Census the population of Merthyr Tydfil was overwhelmingly
white. 98.9% of residents described themselves as white compared with the all
Wales proportion of 97.87%. Table 5 below shows the numbers of people from
different ethnic groups living in the area at the time of the 2001 Census.
Table 5. Population of Merthyr Tydfil by Ethnic Background Source ONS Census 2001
Ethnic Group Number
White British 54,785
Irish 200
Other White 432
Mixed Black Caribbean 30
Mixed Black African 10
Mixed Asian 56
Mixed Other 39
Indian 142
Pakistani 73
Bangladeshi 13
Other Asian 41
Black Caribbean 10
Black African 24
Other Black 7
Chinese 90
8 Source. Life expectancy at birth (years), England & Wales 1991-93 to 2005-07.
http://www.statistics.gov.uk/downloads/theme_population/LE_EW_2008.xls#'E&W at birth'!A1
9Other ethnic group 29
In Merthyr the resident BME communities show a marked difference with BME
communities elsewhere in Wales, in that there are high levels of owner occupation,
lower levels of private renting, higher proportions of BME groups in professional and
managerial occupation groups 1 and 2 and higher car ownership rates when
compared with the population in Merthyr as a whole.
Table 6 shows the household profile in Merthyr Tydfil. Almost 10% of households in
Merthyr Tydfil, consisted of a lone parent with dependent children. This was the
highest rate in Wales and compared unfavourably with the all Wales figure of 7.3%.
In addition a greater proportion of non-dependent children live with their parents than
the all Wales average.
Table 6. Household types in Merthyr and Wales Source ONS Census 2001
Household Type Merthyr Tydfil Wales
Single Pensioner 15.48% 15.46%
Single Person Other 13.40% 13.69%
Couple Pensioner 8.30% 9.62%
Couple no dependent children 14.48% 16.94%
Couple with dependent children 20.9% 20.83%
Couple with non-dependent children 7.73% 6.86%
Lone parent with dependent children 9.64% 7.28%
Lone parent with non-dependent children 3.96% 3.36%
Other household types 6.02% 5.98%
In 2006, Merthyr Tydfil had a significantly higher rate of conceptions amongst women
aged under 18 than the Wales average (the second highest rate in Wales) with a rate
of 56.8 conceptions per 1000 women aged under 18 years of age, compared with the
Wales rate of 44.9 conceptions per 1000.9
The 2001 Census also showed high rates of long term limiting illness, high
perceptions of poor health and high rates of unpaid care provision in Merthyr, when
compared with both England and Wales. Table 7 shows the populations perceptions
of its health and the proportion of the population providing unpaid care.
Table 7. Health in Merthyr Tydfil 2001. Source ONS Census 2001
Proportion of All People Merthyr Welsh Eng & Wales Welsh
Tydfil Average Rank/376 Rank/22
Limiting long-term illness 30.0% 23.3% 2 1
General health 'not good' 18.1% 12.5% 1 1
People providing unpaid care 12.6% 11.7% 9 6
Providing unpaid care 50 or more hrs/wk 3.9% 3.1% 3 2
30% of the population considered that they had a long term limiting illness (the
highest rate in Wales and the 2nd highest rate in England and Wales). 18% of the
population described their health as “not good” (the highest rate in both England and
Wales). 12.5% of the population provide unpaid care to family, friends and
neighbours, with 3.8% providing unpaid care for 50 hours each week (the second
highest rate in Wales, and the third highest rate in England and Wales).
Other sources of data demonstrate the poor health of the population of Merthyr.
Mortality rates in Merthyr were the second highest in Wales and more than 50%
more than the area with the lowest mortality rate (Ceredigion). Merthyr’s population
had:
9
Source. http://www.statswales.wales.gov.uk/TableViewer/tableView.aspx?ReportId=3343
10• a high incidence of cancer in the resident population (the incidence of cancer
in males and females at 557 per 100,000 males and 508 per 100,000
females was above the Welsh average of 536 per 100,000 males and 494
per 100,000 females)
• higher than average levels of respiratory disease (levels of respiratory
disease were marginally higher than the Welsh average)
• a high level of mental ill health (the proportion of adults being treated for
mental illness at 13% was the second highest in Wales and substantially
above the Welsh average of 9%)
• the highest proportion of adults being treated for arthritis in Wales (22%,
compared with the Welsh average of 14%)
• high levels of low birth weight babies (9.2% of babies born in Merthyr had a
low birth weight compared with the Welsh average of 7.6%)10
The 2001 Census also showed that Merthyr compares poorly with England and
Wales in terms of education attainment. 43.9% of the population aged 16 to 74 have
no formal educational qualifications compared with the all Wales figure of 33% (the
2nd highest proportion in Wales, and 4th highest in England and Wales). 11.6% of the
population had been educated to degree level or higher compared with the all Wales
figure of 17.4% (the 2nd lowest ranking in Wales and within the lowest decile in
England and Wales). Merthyr also has a poor record in terms of educational
achievement with the lowest level of 15 year olds achieving 5 GCSE’s at grade C or
above, and has consistently done so since 1999.11
The 2001 Census provided information on surrogate indicators of deprivation,
economic activity rates and rates of permanent sickness in the population in Merthyr.
• 35.1% of households do not own a car (the highest rate in Wales) and
compares very unfavourably with the all Wales average of 26%.
• 48.6% of the population aged 16 to 74 were in employment (the lowest rate in
Wales and the 4th lowest rate in England and Wales), this compares with the
Welsh average of 55.2%.
• 15.9% of the population were permanently sick or disabled (the highest rate
in Wales and the 2nd highest rate in England and Wales), this compares with
the Welsh average of 9.2%.
• 4% of the population were unemployed (the 4th highest rate in Wales),
compared with the all Wales average of 3.5%.
One third of children aged below 16 years of age in Merthyr are living in a home that
is dependent upon income support. This is a higher rate of child poverty than any
other area in Wales. In Merthyr six of the 11 electoral wards have Communities First
status, as do five sub ward areas within the remaining 5 wards.
The Welsh Index of Multiple Deprivation 2008 (WIMD) shows that Merthyr Tydfil has
a higher proportion of Lower Super Output Areas (LSOA’s) in the most deprived 10%
than any local authority area in Wales. 31% of LSOAs in Merthyr fall within the 10%
most deprived LSOAs in Wales. 81% of LSOAs in Merthyr fall within the 50% most
deprived LSOAs in Wales.12
10
Source: Statistical Focus on Social Justice in Wales 2006. Welsh Assembly Government
http://wales.gov.uk/docrepos/40382/40382313/statistics/comp-2006/930030/fsj2006-health-e.pdf?lang=en
11
Source: Statistical Focus on Social Justice in Wales 2006. Welsh Assembly Government
http://wales.gov.uk/docrepos/40382/40382313/statistics/comp-2006/930030/fsj2006-education-e.pdf?lang=en
12
Source: Welsh Index of Multiple Deprivation 2008: Local authority analysis. Welsh Assembly Government 2008
http://new.wales.gov.uk/statsdocs/compendia/wimd08/authority/wimd08lapt6e.pdf
11In recent years there has been a growth in the number of migrant workers residing in
Merthyr Tydfil, working in the local health trusts, local privately run care homes and
manufacturing industries in Merthyr itself and other local authority areas. Table 8,
using data from the Department of Work and Pensions (DWP) shows that 1,680
migrant workers from aboard were living in Merthyr Tydfil at the time of their
registration, over 50% of whom moved to Merthyr from the A8 accession states. As
there is no requirement to deregister from the scheme the data provides information
on inflows only.
Table 8. NI registrations of non-UK nationals by World area of origin in Merthyr Tydfil
2002 to 2007. Source DWP
World Area of Origin
Year European EU Other Africa Asia and The Australasia Unknown
Union Accession European Middle Americas and
States East Oceania
2002 60 - - - 20 - - -
2003 90 - - 10 20 - - -
2004 230 20 10 - 40 10 - -
2005 70 250 - 10 70 10 - -
2006 20 270 - 10 30 - - -
2007 20 380 10 - 20 - - -
Total 490 920 20 30 200 20 0 0
The Workers Registration Scheme (WRS) provides more detail on workers from the
A8 nations. Workers from A8 Accession states are required to register when starting
employment in the UK. The WRS provides data on workers who registered to work
with employers who are based in Merthyr Tydfil between May 2004 and December
2008. Table 9 shows that 810 workers from A8 nations registered to work with
employers in Merthyr Tydfil, just under 95% of whom came from Poland.
Table 9. Workers by nationality registered with the Workers Registration Scheme in
Merthyr Tydfil May 2004 to December 2008. Source. LGA
Czech Estonia Hungary Latvia Lithuania Poland Slovakia Slovenia Total
Rep
0 0 30 0 0 765 10 0 810
Table 10 shows the age profile of A8 nationals who registered to work in Merthyr
Tydfil between May 2004 and December 2008, 76% of whom were aged under 35.
Table 10. Age of workers registering with Workers Registration Scheme with
employers based in Merthyr Tydfil May 2004 to December 2008. Source LGA• the number of workers from A8 accession states successfully applying to join
the workers registration scheme in the year to June 2009, reduced by 41%
compared with the year to June 2008.
This reduction in the number of foreign workers entering the UK is likely to be a
consequence of the recession, as there are fewer opportunities for migrant workers
in the UK. At the time of writing this report updated local data on migrant workers was
not available but there is anecdotal evidence from discussions with lettings agents
who suggest that the reduction in the number of foreign workers coming to the UK is
also being experienced in Merthyr Tydfil.
Economic profile of Merthyr Tydfil
Merthyr Tydfil has experienced considerable structural economic change over the
last twenty years. What was the largest sector of the area’s economy (mining and
mineral extraction industries) have effectively been wiped out. The former presence
of these industries have left the population with a legacy of poor health and the
elimination of the industries have left the area with a high rate of male
unemployment.
The 2001 Census provided details on the socio-economic classification of the
population of Merthyr Tydfil shown in Table 11 below..
Table 11. The Socio Economic Classification of the Population of Merthyr compared
with Wales Source ONS Census 2001
Socio Economic Classification Merthyr Wales
Higher Managerial Occupations 1.71% 2.18%
Higher Professional Occupations 1.99% 3.73%
Lower Managerial & Professional Occupations 13.06% 16.05%
Intermediate occupations 7.67% 8.01%
Lower supervisory and technical occupations 7.30% 7.80%
Semi routine occupations 12.39% 12.25%
Routine occupations 12.69% 9.94%
Never worked 4.53% 2.74%
Long term unemployed 1.44% 1.09%
A significantly lower proportion of the population are employed in managerial
occupations than the Wales and the English average. A greater proportion of the
population are engaged in semi routine or routine occupations than both the English
and Welsh averages. The proportion of the population who have never worked is
almost twice the Welsh and English average.
Tables 12 and 13 provide information about economic activity and inactivity. In
Merthyr Tydfil, Wales and Great Britain, and show that:
• a lower proportion of the resident population of Merthyr Tydfil is economically
active;
• a lower proportion of the economically active population in Merthyr Tydfil are
in employment;
• a lower proportion of the economically active population of Merthyr Tydfil are
self employed;
• a greater proportion of the economically active population of Merthyr Tydfil
are unemployed;
• a greater proportion of the economically inactive population do not want a job
13Table 12. Economic Activity in Merthyr Tydfil 2007-08. Source NOMIS
Population Merthyr Merthyr Tydfil Wales GB
Tydfil (%) (%) (%)
Economically active 25,700 73.5 75.8 78.8
In employment 24,000 68.5 71.3 74.5
Employees 21,700 62.0 61.9 64.8
Self employed 1,800 5.1 8.9 9.3
Unemployed 1,900 7.4 5.8 5.3
Table 13. Economic Inactivity in Merthyr Tydfil 2007-08. Source NOMIS
Population Merthyr Merthyr Tydfil Wales GB
Tydfil (%) (%) (%)
Economically inactive 8,900 26.5 24.2 21.2
Wanting a job 2,800 8.4 6.5 5.6
Not wanting a job 6,100 18.1 17.7 15.6
As a consequence of lower rates of economic activity, a reliance on routine and semi
routine occupations the average income in Merthyr Tydfil is lower than the UK and
Wales average.
However, this snapshot of economic activity and inactivity does not paint a complete
picture of the situation in Merthyr. Figures 2, 3, 4 and 5 suggests that whilst Merthyr
Tydfil still lags behind Wales and the rest of the UK in terms of key economic
indicators, it appeared to be closing the gap until the current recession. However, the
economy of Merthyr Tydfil would appear to have been affected to a greater extent
than the rest of Wales and the Britain by the recession.
Figure 2 shows the proportion of the working age population who are economically
active between 1999 and 2009 and demonstrates a significantly greater rate of
growth in Merthyr Tydfil when compared with the Wales and British average.
However, since the onset of the recession the proportion of the working age
population in Wales and Britain has remained fairly static, the proportion of the
working age population of Merthyr Tydfil who are economically active has reduced.
Figure 2. Proportion of the working age population who are economically active in
Merthyr Tydfil, Wales and the UK between March 1999 and June 2009. Source NOMIS
90
80
70
60
50
Merthyr Tydfil (%)
40
Wales (%)
30 Great Britain (%)
20
10
0
Mar Mar Mar Mar Mar Jan 04- Jan 05- Jan 06- Jan 07- Oct 07- Jan 08- Apr 08- Jul 08-
99-Feb 00-Feb 01-Feb 02-Feb 03-Feb Dec 04 Dec 05 Dec 06 Dec 07 Sep 08 Dec 08 Mar 09 Jun 09
00 01 02 03 04
14Figure 3 shows the proportion of the economically active population who are in
employment between March 1999 and June 2009. This shows that Merthyr had
closed the gap with the rest of Wales and Britain until June 2008. Since that time
employment rates amongst the economically active population of the Merthyr Tydfil
have dropped from 69.4% to 65.9%.
Figure 3. Proportion of economically active population in employment in Merthyr
Tydfil, Wales and the UK March 1999 to June 2009. Source NOMIS
80
70
60
50
40
Merthyr Tydfil (%)
30 Wales (%)
Great Britain (%)
20
10
0
Figure 4 shows the proportion of the working age population who are reliant on key
out of work benefits. Whilst the proportion of the working age population in Wales
and Britain reliant on such benefits declined between 1999 and February 2008 in
both Wales and the rest of the UK the rate of reduction was significantly lower than
that of Merthyr Tydfil. However, since August 2008 the rate of increase in the
proportion of the working age population in Merthyr Tydfil who are in receipt of key
out of work benefits has been greater than that experienced in the rest of Wales and
Great Britain.
15Figure 4. Proportion of the working age population in receipt of key out of work
benefits in Merthyr Tydfil, Wales and the UK between March 1999 and June 2009. Source
NOMIS
35
30
25
20
Merthyr Tydfil (%)
15 Wales (%)
Great Britain (%)
10
5
0
Aug-99
Jan-00
Apr-01
May-03
Aug-04
Jan-05
Apr-06
May-08
Jun-00
Nov-00
Sep-01
Feb-02
Jul-02
Dec-02
Oct-03
Mar-04
Jun-05
Nov-05
Sep-06
Feb-07
Jul-07
Dec-07
Oct-08
Mar-09
Figure 5 shows the median weekly gross income of workers resident in Merthyr Tydfil
compared with the average Welsh and British weekly median gross incomes
between 2004 and 2009. This shows that again median incomes in Merthyr started
off at a lower level than Welsh and British median gross weekly incomes but that
incomes in Merthyr grew at a faster rate than those elsewhere, matching the Welsh
median gross weekly income in 2008. However, since 2008 and the loss of well paid
permanent jobs in the local area the median average weekly take home pay of full
time workers has reduced by 8%.
Figure 5. Median gross weekly incomes in Merthyr Tydfil, Wales and the UK between
2004 and 2008. Source ASHE 2004 to 2008
600
500
400
Merthyr Tydfil (£)
300
Wales (£)
Great Britain (£)
200
100
0
2002 2003 2004 2005 2006 2007 2008 2009
16The total number of jobs in Merthyr Tydfil increased in the period between 1995 and
2007 from 17,341 to 22,700, just under 24% growth, compared with the Welsh and
Great Britain average job growth rate over of the same period of 14% and 13%
respectively. However, between 2007 and 2008 the total number of employee jobs in
Merthyr reduced by 3.1%, compared with a reduction of 0.5% in Wales and increase
of 0.3% in Britain.
It would appear that the effects of the recession have been more keenly felt in the
local economy of Merthyr Tydfil, when compared with the Wales and Britain wide
datasets. The loss of jobs, increase in households reliant on key out of work benefits
and reduction in median average take home pay will have a consequent impact on
the housing market of Merthyr Tydfil.
17Chapter 3 – The Housing Market
Introduction
This chapter will:
‑ provide information about housing in Merthyr Tydfil;
‑ provide a description of the three housing submarket areas within the local
housing market;
‑ provide a commentary on current trends within the local housing market; and,
‑ identify key issues for policy makers
Housing in Merthyr Tydfil
In 2001 there were 23,145 homes in Merthyr. Compared with the rest of Wales,
Merthyr has 6% fewer households living in owner occupied accommodation and 26%
more of its population living in social housing. Table 15 shows the proportion of
homes in each tenure group in 2001 compared against the overall figures for Wales.
Table 14. Housing Tenure in Merthyr. Source ONS Census 2001
Owner Social Privately
occupied Housing Rented
Proportion of households in each tenure 67.11% 22.85% 10.05%
type in Merthyr
Proportion of households in each tenure 71.32% 17.9% 10.77%
type in Wales
Table 15 below shows the ownership of housing stock of each of the social landlords
who own and manage property in the area.
Table 15. Social rented housing stock ownership. Source data provided by each landlord
Landlord Merthyr Merthyr Wales and Hafod HA Aelwyd HA
Valleys Tydfil HA West HA
Homes
Stock 4,117 1,21 423 172 20
The housing stock of the area reflects the past patterns of development in the
locality. The area’s rapid development as a metal working and mining town in the
nineteenth century and its subsequent decline in the 20th Century means that it has a
significantly older housing stock than elsewhere in Wales. Table 17 shows the age of
Merthyr’s housing stock across all tenures in comparison to the Welsh average.
Table 16. Age of Housing Stock. Source 1997 Welsh House Condition Survey WAG
1997 Welsh House Condition Pre 1919 1919-144 1945 – 1964 Post 1964
Survey Findings
Age of Housing in Merthyr 45.4% 10.3% 15.8% 27.8%
Age of Housing in Wales 32% 13.9% 20.5% 33%
The Council’s 2008 Private Sector House Condition Survey further illustrates the age
of the housing stock of the area stating that 53.9% of private sector homes were built
before 1919.
In Wales the house type that has the highest rate of unfitness is terraced housing,
mainly because much of it was built before 1919. Table 18 shows the types of
accommodation in Merthyr and the proportion of the housing stock that they
represent, compared with the Welsh average.
18Table 17 Types of Accommodation. Source 1997 Welsh House Condition Survey WAG
1997 Welsh House Condition Terraced Semi - Detached Flats
Survey Findings detached
Types of Housing in Merthyr 59% 27% 7.7% 4.7%
Types of Housing in Wales 34% 33.4% 22.8% 8.7%
Merthyr has significantly more terraced housing than the Welsh average, and
substantially less of the other types of housing.
The area has a significantly greater rate of unfitness within its terraced housing stock
than the Welsh average. At the time of the 1997 Welsh House Condition survey,
Merthyr had the highest rate of unfitness in this type of accommodation (16.9%) than
any other local authority in Wales. Table 19 shows the rate of unfitness by
accommodation type in Merthyr and Wales.
Table 18. Types of Housing and Unfitness Source Welsh House Condition Survey WAG
1997 Welsh House Condition Terraced Semi - Detached Flats
Survey Findings detached
Unfitness rate by type of housing in 16.9% 7.7% 0.8% 6.2%
Merthyr
Unfitness rate by type of housing in 11.4% 6.8% 6.1% 9.5%
Wales
The rate of unfitness amongst owner occupiers in Merthyr was almost twice the
national average (13% compared with 7.6%), and whilst the rate of unfitness in the
social housing sector and the privately rented sector were greater than the Welsh
average the gap between the national average and Merthyr was not as pronounced.
It is therefore no surprise to find that at the time of the 1997 Welsh House Condition
Survey, Merthyr had the highest rate of unfitness of any local authorities in Wales,
with 12.5% of the housing stock unfit compared with the Welsh average of 8.5%.
Stock Condition Surveys commissioned by the Council shows that the investment of
both public and private resources in the improvement of the private sector housing
stock of the area, and in particular the policy of targeting concentrations of poor
quality housing through the use of Renewal Areas, has done much to improve the
quality of private sector homes in the area. The 2004 Survey measured unfitness in
the private sector at 8% and the 2008 survey found that the rate of unfitness had
subsequently reduced to 4.9%.
The 2008 Stock Condition Survey estimated that 39% of private sector homes across
Merthyr had a Category 1 hazard (using the statutory Housing Health and Rating
System), and that 80% of these category 1 hazards were due to the presence of
excess cold hazards.
The number of empty properties in Merthyr Tydfil is slowly reducing. Table 20 shows
the empty properties in Merthyr, drawn from the Council Tax database.
Table 19. Empty properties in Merthyr Tydfil. Source MTCBC Council Tax
Year Number of Empty Homes
2001 1391
2006 1200
2007 1238
2008 1455
2009 1206
19Figure 6 shows the distribution of empty homes in April 2009, which would appear to
be fairly evenly distributed across the Borough.
Figure 6. Empty properties in Merthyr Tydfil April 2009. Source MTCBC Council Tax
Of these empty properties:
‑ 611 are long term empty properties (i.e. empty for over 6 months)
‑ 10% of the long term empty properties have been empty since 2004 or
earlier
The 2004 and 2007 Housing Market Assessments commissioned by the Council
indicated that there was continuing growth in the private rented sector in Merthyr
Tydfil. This is borne out by the findings of the 2008 Private Sector House Condition
Survey which estimates that 14.2% of the private sector stock is rented (2,883
properties) compared with the 2001 Census figure of 10% of all homes were privately
rented (2,326 properties).
The Houses in Multiple Occupation (HMO) survey published by the Council in March
2003, identifies approximately 140 HMO’s in Merthyr, which constitute 22% of the
private rented housing stock in the County Borough. The survey found that:
• 63% were 3 storeys or over
20• 4% had major failings with regard to facilities • 63% had inadequate means of escape • 18% failed to comply with the furniture fire safety regulations • 25% needed action in relation to management issues • 11% were unfit and a further 12% were in disrepair The survey also found that 21% of occupants of HMO’s in Merthyr could be described as vulnerable, and that a further 10% of occupants were migrant workers from Portugal. House prices in Merthyr are generally lower than elsewhere in Wales and the UK but between 2000 and 2007 house prices increased significantly, the average house price, shown by figure 7 increased by 182%. However since their peak in February 2008 house prices in Merthyr Tydfil have reduced significantly. Figure 7 is based on sales price and mortgage valuation figures and shows a slight up turn in values towards the end of 2009. Land Registry data for 2009, which records purchase price only, show the mean average house price in Merthyr Tydfil was £94,669 and the median average house price was £82,000. Figure 7, Average house prices in Merthyr Tydfil 2000 to November 2009. As at April 2009 there were 26,006 residential dwellings in Merthyr Tydfil. Table 21 shows the rate of construction between 1999/00 and 2007/08. This shows that the
average rate of construction over the last 9 years has been 133 units a year, which
has been surpassed in 2007-08 and 2008-09 despite the recession and its impact on
the construction industry.

Table 20. House completions in Merthyr Tydfil 1999/00 to 2008/09.     Source Joint Housing Land
Availability Report. Welsh Assembly Government.
                       Year                         Number of Completions
                    1999 – 2000                                      166
                    2000- 2001                                       119
                    2001- 2002                                        49
                    2002- 2003                                       102
                    2003- 2004                                       137
                    2004- 2005                                       144
                    2005- 2006                                       112
                    2006- 2007                                       133
                    2007- 2008                                       243
                    2008 - 2009                                      191

Housing Market sub areas and their characteristics
As stated in Chapter 1, this study divides the housing market in Merthyr into 3
housing submarket areas, these are:
   •    the Merthyr Tydfil housing submarket area
   •    the Mid Valleys Communities housing submarket area
   •    the Treharris and Trelewis housing submarket area

Table 21 shows the mean and median average household incomes of households in
Merthyr Tydfil in each of the 3 housing submarket areas and the electoral divisions
that comprise each area. Using the median average figures as representative of the
mid point of all points in each area, the table shows considerable variation between
the housing submarket areas with the highest and lowest median incomes Treharris
and Trelewis (£25,511) and the Mid Valley communities (£21,866). The Merthyr
Tydfil housing submarket area contains wards which show the greatest variation in
median incomes, ranging from £18,467 in Gurnos to £26,211 in Cyfartha.

Table 21. Average household income by housing market sub area and electoral ward in
Merthyr Tydfil. Source CACI Paycheck
 Sub Area                 Ward          Mean average         Median average
 Merthyr Tydfil                                          £25,177            £22,494
                              Vaynor              £28,253             £25,150
                              Dowlais             £25,193             £22,488
                              Gurnos              £20,253             £18,467
                              Penydarren          £23,030             £20,711
                              Cyfarthfa           £29,397             £26,211
                              Park                £26,728             £23,860
                              Town                £23,535             £20,950
 Mid Valley Communities                                  £24,432            £21,866
                              Plymouth            £25,150             £22,389
                              Bedlinog            £25,302             £22,749
                              Merthyr Vale        £23,058             £20,769
 Treharris and Trelewis                                  £28,584            £25,511
                              Treharris           £28,904             £25,766

A description of each housing submarket area and the neighbourhoods that they
contain is provided below. The description draws upon a range of sources of data,
including Land Registry data on average house prices. The sample in some wards

                                                                                             22
were small which meant that average house prices can vary significantly from year to
year.
The Merthyr Tydfil housing submarket area
The Merthyr Tydfil area is comprised of the following electoral divisions:
• Vaynor
• Dowlais and Pant
• Gurnos
• Pennydarren
• Cyfartha
• Park
• Town
In addition the area also includes one third of the Plymouth electoral division,
including the communities of Pentrebach and Abercanaid.
Vaynor – the area of Vaynor has a significantly higher proportion of detached and
semi-detached homes than the Merthyr average and consists of mainly owner
occupied housing. It contains the communities of Trefechan and Cefn Coed.
Trefechan has a high proportion of detached and semi-detached homes, whereas the
urban core of Cefn Coed has a high proportion of terraced homes. The area is
predominantly owner occupied. It also contained some of the most modern housing
stock in the area with only 35% pre dating 1919. The area generally has low rates of
unfitness and high income levels. However, the Council’s 2004 Private Sector Stock
Condition Survey found high levels of disrepair and fuel poverty amongst older
households in Cefn Coed, resulting in the housing stock in Vaynor ward being ranked
5th worst in the locality.
In 2008 Vaynor had a median average annual household income of £25,150 the 3rd
highest level of income in the locality.
Cefn Coed and Trefechan are also described as good locations to sell and let private
sector homes, a consequence of the fact of the areas proximity to the Brecon
Beacons. In terms of letting social housing the area is described as popular and easy
to let homes in, with the exception of accommodation designated for older people in
Trefechan, these difficulties being related to the quality of public transport services to
the area.
The area is described as one of high demand where property sells quickly. The
average house price in the area in 2009 was £89,060, the eighth highest in the area.
This represents a continuing reduction on the average house price in the area when
compared with the 2007 and 2009 studies, and this we assume is related to the fact
that high value homes are particularly difficult to sell at present.
The area has recently seen new housing developed in Trefechan area and the
Trefechan area is expected to yield a further 100 new homes in the medium to longer
term.
Dowlais – the area includes the electoral division of Dowlais which contains the
communities of Dowlais and Pant. The area is predominantly owner occupied but
with a substantial social housing sector which is concentrated in the more urban
parts of the area. The more rural parts of the area contain some detached and semi-
detached homes but the area can be characterised as containing a significant
proportion of terraced homes. In terms of household types, the more rural parts of the
23area appeared to contain more mature families, whereas the more urban areas
appear to contained young and older households.
The areas housing stock is old, 64% predates 1919 and 75% of the homes in the
area were terraced properties. The Council’s 2004 Private Sector House Condition
Survey found that 11% of the homes in the area were unfit. The condition of homes
in the area was ranked third worst in Merthyr Tydfil by the survey. The area of
Dowlais forms a Renewal Area, established in 2003 in response to the poor housing
conditions found there.
The older parts of Dowlais were previously described as one of the most difficult
areas to sell and let homes in, as they contain the housing that is oldest, generally in
poorest condition and smallest in size. This perception of the area has changed with
demand for owner occupied homes, social rented homes and privately rented homes
being described as strong. The area would appear to have a growing private rented
sector. Demand for rented accommodation in the area is reported to be high, in part
from migrant workers who are employed at two major employers who are based in
Dowlais, St.Merryn Meat and OP Chocolate. However, we were advised by one
Letting Agent who has a substantial portfolio in the Dowlais area that demand for
private rented housing in the area had reduced and that relet times for homes in the
area have lengthened recently. This is thought to be a consequence of a reduction in
the number of foreign workers employed in factories in the Dowlais area.
The median average annual household income in the Dowlais and Pant area was
£22,448, the sixth highest in the locality. The average house price in the area in 2009
was £88,414 the ninth highest average price in the locality.
The area has seen some new development at Japonica Drive and is likely to see
substantial new development over the medium to longer term. Two key sites will
provide in the region of 540 new homes over the medium to longer term. The
Foundry site, whilst heavily contaminated, is in the process of being marketed as
“Project Heartland” which will provide a site for approximately 440 new homes and
the site adjacent to the Old Forge will yield a further 100 new homes.
Gurnos – this area comprises the Gurnos electoral ward which incorporates the
large social housing estate in Gurnos and the modern private development at
Lakeside Gardens. The area is dominated by the Gurnos housing estate with 52% of
households living in social housing and only 35% living in owner occupied housing at
the time of the 2001 Census.
The age of the housing stock is relatively modern with only 4% of the stock predating
1919, the majority of the social housing estate being constructed in the post war era.
The area contains a broader mix of property types than most other areas.
In terms of the age profile of the population, there is an even distribution of age
groups.
The area has the lowest annual household income in the locality, with a median
average annual household income of £18,467. The average house price in Gurnos in
2009 was £77,875 was the lowest in the locality.
Gurnos was previously described as a difficult to let estate but would appear to be
gradually losing this label as a result of action undertaken by the Council and Merthyr
Valleys Homes to improve the estate and housing market change. Demand for social
housing is described as relatively strong and difficult to let housing is now restricted
24You can also read