Electrifying the Ride-Sourcing Sector in California
←
→
Page content transcription
If your browser does not render page correctly, please read the page content below

Electrifying the
                          Ride-Sourcing
                     Sector in California
                                ASSESSING THE OPPORTUNITY

California Public Utilities Commission
Policy & Planning Division
 Simi Rose George
 Principal Author
 Policy and Planning Division

 Marzia Zafar
 Director
 Policy and Planning Division
                                                April, 2018
Acknowledgements:

     We wish to thank the following individuals who contributed to the development of this paper:

  Michael Colvin, Senior Regulatory Analyst, Policy and Planning Division, California Public Utilities
                          Commission (CPUC), provided substantive input.

   Members of the CPUC’s Internal Steering Committee for this research project provided input on the
 strategic direction and scope of this research project: Commissioner Liane M. Randolph; Commissioner
   Carla J. Peterman; Nick Zanjani, Director, Consumer Protection and Enforcement Division; Rachel
   Peterson, Chief of Staff to Commissioner Randolph; Edward Randolph, Director, Energy Division;
Jennifer Kalafut, Chief of Staff to Commissioner Peterman; and Amy Mesrobian, Senior Analyst, Energy
                                                  Division.

 Members of the External Advisory Committee for this research project offered feedback on the scope,
  content, and structure of this paper: Mark Ferron, Former Commissioner, CPUC; Professor Susan
Shaheen, University of California, Berkeley; Professor Dan Sperling, University of California, Davis; and
                     Professor JR DeShazo, University of California, Los Angeles.

  Diane Fellman and Kristin Ralff-Douglas, Senior Regulatory Analysts, Policy and Planning Division,
  CPUC; several other CPUC staff members; and staff at the California Air Resources Board reviewed
              earlier versions of this paper and provided substantive input and feedback.

 In addition, this paper benefited from several conversations with key stakeholders, including Lyft and
 Uber, two of the major ride-sourcing companies operating in California. In order to eliminate errors,
     both companies reviewed their respective data, as presented in this paper, prior to publication.

               A digital copy of this report can be found at: www.cpuc.ca.gov/ppd_work

                                           DISCLAIMER

 This paper was prepared by California Public Utilities Commission (CPUC) staff. It does not
 necessarily represent the views of the CPUC, its Commissioners, or the State of California. The
 CPUC, the State of California, its employees, contractors, and subcontractors make no warrants,
 express or implied, and assume no legal liability for the information in this paper. It has not been
 approved or disapproved by the CPUC, nor has the CPUC passed upon the accuracy or adequacy
 of the information in this paper.
Table of Contents
Introduction, Scope & Problem Motivation .................................................................................... 1
      1.1 Introduction ................................................................................................................................................ 2
      1.2 Objective, Scope and Limitations ............................................................................................................ 2
      1.3 Problem Motivation ................................................................................................................................... 3
            1.3.1 Why consider GHG emissions from the TNC sector ............................................................... 3
            1.3.2 Why consider the potential for electrification to reduce TNC sector GHG emissions ....... 4
      1.4 Background on EVs and TNCs ............................................................................................................... 5
            1.4.1 Regulatory Framework applicable to the TNC sector ............................................................... 5
            1.4.2 An introduction to the EV market................................................................................................ 5
State of the TNC Industry in California .......................................................................................... 7
      2.1 Size of the TNC Sector and Growth Trends ......................................................................................... 8
      2.2 Deadhead miles generated by TNC operations................................................................................... 11
      2.3 Pooled services offered by TNCs .......................................................................................................... 11
Use of EVs on TNC Platforms – Key Trends, Barriers & TNC Initiatives .................................. 14
      3.1 An Opportunity to Increase Economy-Wide EV Adoption............................................................. 15
      3.2 Use of EVs on TNC Platforms – A Statistical Analysis .................................................................... 16
      3.3 TNC Drivers’ EV Charging Behavior – A Discussion of Preliminary Evidence .......................... 20
      3.4 Key Industry Trends Relating to EV Use in the TNC Sector .......................................................... 21
            3.4.1 AV Technology Developments ................................................................................................... 21
            3.4.2 TNC Partnerships and Engagement with Other Industry Players......................................... 23
      3.5 Key Barriers to Use of EVs in the TNC Sector .................................................................................. 23
            3.5.1 Categories of Barriers Experienced by EV drivers on TNC Platforms ................................ 23
            3.5.2 Vehicle Acquisition Barriers Experienced by TNC Drivers ................................................... 25
            3.5.3 Operational Barriers to BEV Use on TNC Platforms ............................................................. 27
            3.5.4 Key Takeaways ............................................................................................................................... 28
      3.6 TNC initiatives to increase EV use ....................................................................................................... 29
Accelerating EV Use in the TNC Sector Through Regulatory Changes ...................................... 31
      4.1 Potential Regulatory Options and Key Questions for Consideration ............................................. 33
            4.1.1 Regulatory Mandates and Targets ............................................................................................... 33
            4.1.2 Fee Structure: Assessing a fee on TNC companies .................................................................. 34
            4.1.3 Incentives to Advance Electrification of the TNC Sector ...................................................... 35
            4.1.4 Reporting Requirements: Environmental Performance Reports ........................................... 37
      4.2 A Framework for Comparison of Potential Regulatory Options ..................................................... 38
            4.2.1 Impact .............................................................................................................................................. 39
            4.2.2 Cost Effectiveness ......................................................................................................................... 39
4.2.3 Implementation Feasibility ........................................................................................................... 39
       4.3 Key Overarching Considerations in Assessing Regulatory Options ................................................ 39
             4.3.1 Size Thresholds for Applicability of Regulatory Requirements.............................................. 39
             4.3.2 Applicability of New Regulations to AVs Operated for Passenger Transportation ........... 40
             4.3.3 Flexibility ......................................................................................................................................... 40
             4.3.4 Hybrid Approaches ....................................................................................................................... 40
             4.3.5 Adaptability ..................................................................................................................................... 40
Conclusions and Questions for Future Research .......................................................................... 41
Appendices .................................................................................................................................... 43
       Appendix A ..................................................................................................................................................... 43
       Appendix B...................................................................................................................................................... 44
       Appendix C...................................................................................................................................................... 45
       Appendix D ..................................................................................................................................................... 46
       Appendix E ..................................................................................................................................................... 47
Tables & Figures
Figure 1: California’s 2015 GHG Emissions By Sector (Total Emissions: 440.4 MMTCO 2E ) ................... 3
Figure 2: Why Consider TNC Sector Electrification.......................................................................................... 5
Figure 3: Year on Year Growth Rate in Aggregate Trip Miles Traveled on Lyft and Uber Platforms in
California (Nov. ’15 – Oct. ’16 & Nov. ’16 – Oct. ’17) ....................................................................................... 9
Figure 4: Chartering Parties Transported via Pooled Services as a Percentage of All Chartering Parties
Recorded by Lyft and Uber in California by Quarter (Q3 2014-Q3 2017) .................................................... 12
Figure 5: Aggregate Number of EVs Used on Lyft and Uber Platforms in California by Quarter (Range
of Values) .................................................................................................................................................................. 17
Figure 6: EV Trip Miles as a Percentage of Total Trip Miles Traveled on Lyft and Uber Platforms in
California by Quarter (Q3 2016– Q3 2017) ........................................................................................................ 18
Figure 7: Levels of Driving Automation ............................................................................................................ 22
Figure 8: Types of Barriers to EV Deployment and Use on TNC Platforms .............................................. 24
Figure 9: Relationship Between Monthly EV Sales and Socio-Economic Indicators ................................. 26
Figure 10: Types of Regulatory Levers ............................................................................................................... 33
Figure 11: Key Parameters for Evaluation of Regulatory Tools ..................................................................... 39
Figure 12: Total kWh Delivered to Evercar and non-Evercar customers at Top 3 Evercar Sites, by week
(08/07/2016 to 10/02/2016) ................................................................................................................................ 43
Figure 13: Average daily DCFC session minutes by Evercar and non-Evercar customers at top 3 sites
Evercar sites, per site, on weekdays, by time (08/07/2016 to 10/02/2016) ................................................. 44
Figure 14: Average daily DCFC session minutes by Evercar and non-Evercar customers at top 3 sites
Evercar sites, per site, on weekends, by time (08/07/2016 to 10/02/2016) ................................................. 45

Table 1: Summary Statistics on Deadhead Miles Driven on Lyft and Uber Platforms in California (Oct.
1-31, 2017) ................................................................................................................................................................ 11
Table 2: Summary Statistics on Use of EVs on Lyft and Uber Platforms in California (Oct. 1-31, 2017)
.................................................................................................................................................................................... 19
Table 3: Categories of EV Acquisition/Use Barriers and Interaction with TNC Vehicle Types.............. 25
Table 4: Illustrative Example of a Fee Structure based on eVMT% ............................................................. 34

Glossary of Key Terms
BEV                Battery Electric Vehicle
CARB               California Air Resources Board
                   A person, corporation, or other entity that prearranges with a transportation
Chartering Party
                   network company for transportation services.
DCFC               Direct Current Fast Charger
Deadhead miles     The sum of Period 1 VMT and Period 2 VMT.
                   Electric vehicle/zero emission vehicle. For the purposes of this paper, “EV” or
                   “ZEV” includes 1) plug-in electric vehicles (PEVs), which include both pure
EV/ZEV             battery electric vehicles (BEVs) and plug-in hybrid electric vehicles (PHEVs), and
                   2) fuel cell electric vehicles (FCEVs) 1. Given the very small number of FCEVs
                   currently in use in California, the discussion in this paper is focused on PEVs.
eVMT               Electric vehicle miles traveled
FCEV               Fuel cell electric vehicle
                   Greenhouse Gas Reduction Fund. GGRF is funded by state proceeds from
                   California’s cap and trade auctions. The California Legislature and Governor
GGRF
                   appropriate cap and trade auction proceeds from the fund to state agencies and
                   programs through the budget process. 2
                   Internal combustion engine vehicle. ICE vehicles are usually powered by fuels
ICE vehicle
                   such as gasoline or diesel.
                   Plug-in hybrid electric vehicle. PHEVs have a battery and an electric motor as well
PHEV
                   as an internal combustion engine.
                   Miles driven by a TNC driver with the online-enabled TNC application (app) on,
Period 1 VMT
                   while waiting to be matched with a passenger.
                   Miles driven by a TNC driver from their location to the passenger’s location to
Period 2 VMT
                   pick up the passenger, after they have been matched through the TNC platform.
                   Plug-in electric vehicle, which includes both pure battery electric vehicles (BEVs)
PEV
                   and plug-in hybrid electric vehicles (PHEVs).
                   Super Ultra Low Emission Vehicle. This is one of California’s six vehicle
SULEV              emissions ratings. SULEVs are 90 percent cleaner than the average new model
                   year vehicle. 3
                   Total costs of ownership. In the context of this paper, TCO refers to the total
TCO                costs of acquiring, operating, and maintaining a vehicle in the course of its
                   lifetime.
                   Charter-party carrier (e.g., limousines, airport shuttles, tour buses). TCPs charter
TCP                vehicles, on a prearranged basis, for the exclusive use of an individual or group,
                   and are regulated by the CPUC.
                   Transportation network company, defined as “an organization whether a
TNC                corporation, partnership, sole proprietor, or other form, operating in California
                   that provides prearranged transportation services for compensation using an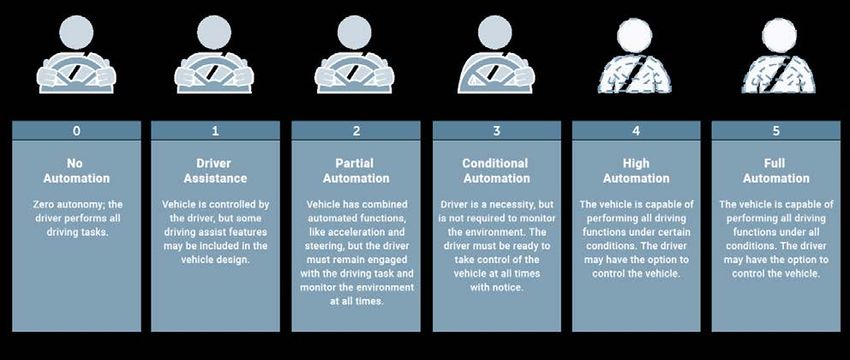
online-enabled application (app) or platform to connect passengers with drivers
       using their personal vehicles.” 4 Lyft and Uber are two examples. TNCs are
       commonly referred to as ride-sourcing companies.
       Ultra Low Emission Vehicle. This is one of California’s six vehicle emissions
ULEV
       ratings. ULEVs are 50 percent cleaner than the average new model year vehicle. 5
VMT    Vehicle miles traveled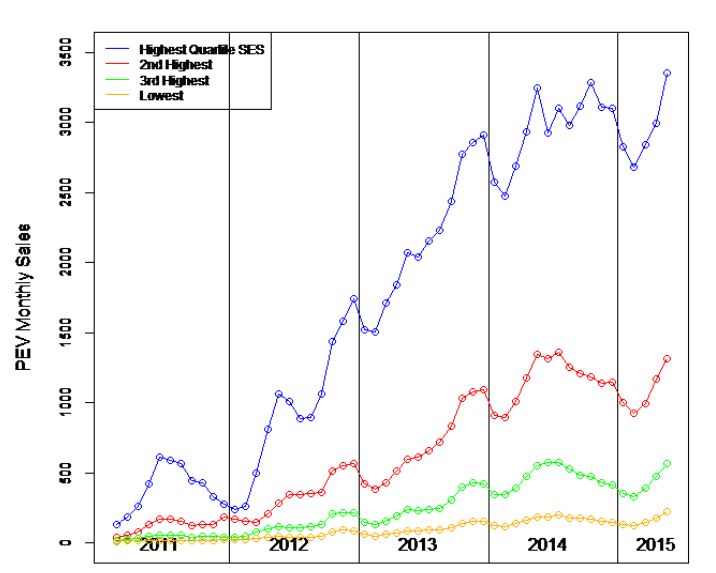
1          Introduction, Scope &
           Problem Motivation

Electrifying the Ride-Sourcing Sector in California – April, 2018   1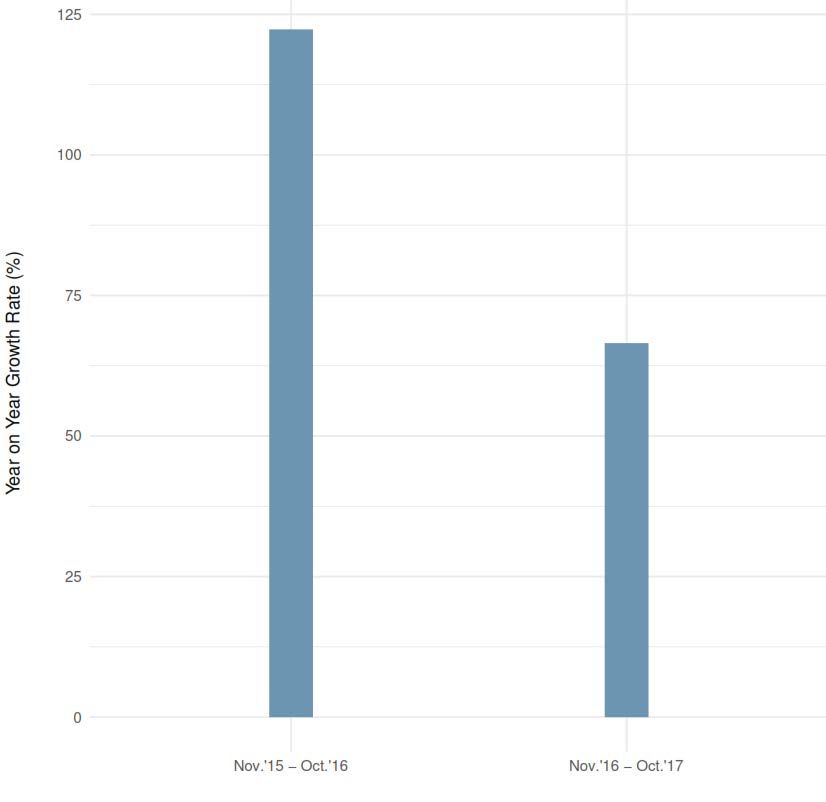
1.1 Introduction
The emergence of on-demand transportation services offered through digital platforms has transformed
the urban mobility landscape, raising complex questions about the implications for the future of
transportation.

In 2013, the California Public Utilities Commission (CPUC) created rules and regulations applicable to
companies offering these services – referred to as transportation network companies (TNCs) – in order
to ensure public safety and customer protection. The rapid growth of the TNC sector raises new
questions around its environmental impacts. This paper offers qualitative and quantitative data and
analysis to allow the California Public Utilities Commission (CPUC) to address the following questions:

        Is there a need for the CPUC to initiate regulatory changes by exercising its
        jurisdiction over TNCs in order to reduce greenhouse gas (GHG) emissions
        through increased use of electric vehicles (EVs) 6 in the TNC sector? If so, what
        types of regulatory tools might the CPUC consider?

We use the definition of TNC set out in the California Public Utilities Code, i.e., a company that
provides prearranged transportation services for compensation using an online-enabled application or
platform to connect passengers with drivers using a personal vehicle. 7
1.2 Objective, Scope and Limitations
Objective: The objective of this research paper is to (1) serve as a useful starting point for the CPUC to
assess the opportunity for GHG emissions reduction in the TNC sector through increased use of EVs,
(2) offer a framework for comparison of available regulatory options, and (3) identify key questions for
the CPUC to consider, should it choose to initiate regulatory changes.

We consider the potential for increasing the use of EVs on TNC platforms through the lens of electric
vehicle miles travelled (eVMT) as a percentage of total vehicle miles traveled (VMT). Whilst total GHG
emissions is the ideal metric in considering the sector’s overall environmental impact, it is too broad a
metric to gauge the extent of EV deployment and use in the sector, which is the subject of this paper.

Scope Limitations: This paper does not consider solutions that involve energy utility ratepayer funds or
the exercise of the CPUC’s jurisdiction over investor-owned electric utilities. There are certain other
avenues for inquiry that are beyond the scope of this paper but constitute key questions for future
research. 8 The impact of TNCs on congestion 9, and the distributional effects of TNC operations 10 are
two such critically important questions that are in the early stages of being considered by researchers, and
merit significantly more research and analysis.

Data sources and Limitations: In addition to qualitative and quantitative information shared by Lyft and
Uber, both in response to data requests, and in various follow-up meetings, this paper draws on
discussions with several industry experts, market participants, state and local agencies, and other
stakeholders, and on existing literature. Additional information was gathered from a focus group meeting
with EV drivers on the Uber platform, organized by Uber in San Francisco on January 25, 2018, in
which the CPUC participated.

To date, the CPUC has issued TNC permits to 14 companies. 11 However, the market is dominated by
two major players – Lyft and Uber. Other competitors do not operate at a comparable scale. Only data
relating to the operations of Lyft and Uber in California has been considered in this paper. The
companies characterized data shared with the CPUC for this research project as their best estimates.
Although calculation methodologies were discussed at length with both companies to eliminate
differences, there may be some methodological differences in how the two companies derived these
estimates that could not be identified.
Electrifying the Ride-Sourcing Sector in California – April, 2018                                            2
Certain data gaps limited the nature and extent of analysis that could be performed as part of this
research project. For instance, the lack of CPUC access to reliable data on emissions from other
segments of the transportation sector, such as taxis, limited the extent to which a comparative analysis
could be performed. The CPUC does not have regulatory authority over the taxi industry, which is
regulated at the local level by cities and counties in California.
Finally, the overall impact of TNC operations on VMT in California remains ambiguous. To identify
these impacts in a rigorous way, we need reliable data on how TNC passengers would have traveled if
they had no access to TNC services (e.g., driving alone in a personal vehicle, using public transit, or
active modes of travel such as biking), which is not currently available. The analysis presented in this
paper must be considered keeping this context in mind.
1.3 Problem Motivation
1.3.1 Why consider GHG emissions from the TNC sector
The transportation sector has historically been the largest source of GHG emissions in California. In
2015, it accounted for approximately 39 percent of the state’s overall GHG emissions. 12 While aggregate
statewide emissions fell between 2014 and 2015, transportation sector GHG emissions increased by
close to 3 percent (see Figure 1). 13
Figure 1: California’s 2015 GHG Emissions By Sector (Total Emissions: 440.4 MMTCO 2E ) 14
0
Agriculture
Residential and 8%
Commercial
11%
Industrial 23%
Electricity Generation
19%
Transportation 39%
In order to significantly reduce emissions from the transportation sector, focusing on the light duty
vehicles segment is critically important. In 2015, light duty vehicles, including passenger cars,
motorcycles, and light duty trucks, accounted for about 69 percent of transportation sector GHG
emissions. 15 Emissions from this segment increased by 4.44 percent from 2014-15.
Passenger car emissions accounted for approximately half of the total emissions from the light duty
vehicles segment in 2015, and registered an increase of approximately 5.6 percent from 2014-15.
Nineteen percent of transportation sector emissions came from on-road heavy-duty trucks, and the
Electrifying the Ride-Sourcing Sector in California – April, 2018 3remaining 12 percent came from other sources (e.g., ships, boats, off-road vehicles). 16
Relative to other categories of commercial use passenger vehicles regulated by the CPUC, the TNC
sector is the largest and fastest growing, representing the biggest opportunity to reduce transportation
sector GHG emissions through CPUC intervention. 17 TNC sector growth trends are addressed in
Section 2.
Other segments of the transportation sector do, of course, present opportunities for emissions
reduction. However, the CPUC’s regulatory authority does not extend to all these segments. As
previously noted, taxis fall outside CPUC jurisdiction (see Box 1) 18. Similarly, the CPUC lacks the
authority to directly regulate privately owned vehicles that do not fall within the definition of TNCs or
charter-party carriers (TCPs). It may issue regulations that impact electrification of the transportation
sector as a whole by exercising its jurisdiction over electric utilities. However, these aspects, as noted
earlier, are being considered by the CPUC in an ongoing Rulemaking proceeding, and are therefore not
discussed in this paper.
BOX 1: Taxis & TNCs – Differences Explained
Under California law, a TCP/TNC may not operate or advertise itself as a taxi service. Taxis are
licensed and regulated by cities and counties, while TCPs/TNCs are regulated by the CPUC, subject
to the California Public Utilities Code and CPUC regulations. The most important operational
difference is that while TCP/TNC transportation must be “prearranged,” no such requirement
applies to taxis. In the case of TNCs, this pre-arrangement is done through a ride request submitted
through the TNC platform. Taxis may provide transportation “at the curb,” i.e. a customer may
“arrange” taxi transportation by simply hailing a taxi from the sidewalk.
1.3.2 Why consider the potential for electrification to reduce TNC sector GHG emissions
There are two primary ways in which TNC sector emissions can be reduced:
1. Reducing total miles traveled (e.g., by reducing deadhead miles or increasing use of pooled
services such that it reduces total VMT); and
2. Reducing emissions per mile (e.g., by prescribing fuel efficiency standards for TNC vehicles or
increasing the use of EVs on TNC platforms).
Increasing dispatch efficiency (i.e., optimally matching drivers and passengers) is a priority for TNCs
because every deadhead mile represents a lost revenue generation opportunity. Deadhead miles can – to
some extent – be expected to decrease organically over time as TNCs continue to improve their dispatch
algorithms, and the density of TNC vehicles increases as TNC operations continue to grow.
TNC emissions per mile may be reduced by prescribing fuel efficiency standards for TNC vehicles.19
This paper focuses on the potential to reduce TNC sector emissions through increased EV use,
consistent with California’s statutory framework, which is increasingly focused on reducing
transportation sector GHG emissions through electrification. Figure 2 is a graphical representation of
the motivation for this study. 20
Electrifying the Ride-Sourcing Sector in California – April, 2018 4Figure 2: Why Consider TNC Sector Electrification
Transportation sector:
largest GHG emissions
source in CA
Light duty vehicles:
largest segment of
transportation sector
emissions
Other passenger Privately owned non-
vehicles for commercial TNCs TNC vehicles for
use (e.g., TCPs) personal use
Reduce emissions per Reduce miles travelled
mile (e.g., deadhead miles)
Fuel Efficiency
Electrification Standards
1.4 Background on EVs and TNCs
1.4.1 Regulatory Framework applicable to the TNC sector
In 2013, the CPUC created a regulatory framework for the TNC sector through its rulemaking process, 21
with the objective of ensuring public safety and protecting customers while encouraging the entry of new
players. Under the existing regulatory framework, TNCs are required to comply with several
requirements, e.g., each TNC must obtain a permit from the CPUC prior to commencing operations,
establish a driver training program, comply with annual reporting requirements, and require insurance
coverage as specified by the CPUC.
The CPUC clarified and expanded on these issues in a Decision (D.16-04-041) issued in 2016 as part of
Phase II of this Rulemaking proceeding. 22 Phase III of the proceeding is underway.
1.4.2 An introduction to the EV market
There are two types of PEVs – pure battery electric vehicles (BEVs), and plug-in hybrid vehicles
(PHEVs). BEVs run entirely on electricity stored in batteries and have an electric motor rather than a
gasoline engine. PHEVs combine an electric motor that is powered by rechargeable batteries, and an
internal combustion engine that can be refueled with gasoline. 23 BEVs have zero tailpipe emissions– the
only emissions are associated with the generation of electricity used to charge the battery. Emissions
from PHEVs depend on the electricity to gasoline ratio used. Like BEVs, fuel cell electric vehicles
(FCEVs) use electricity to power an electric motor. Unlike PEVs, FCEVs produce electricity using a fuel
Electrifying the Ride-Sourcing Sector in California – April, 2018 5cell powered by hydrogen, rather than drawing electricity from a battery. 24 While the TNC data presented in this paper incorporates data on FCEVs, the discussion in this paper is focused on PEVs given the very small number of FCEVs currently in use. Level 1, Level 2 and DC Fast Charging (DCFC) are the most widely deployed classes of EV chargers. In broad terms, this classification pertains to the charger’s power level, and reflects charging speed. The use of higher charging levels can significantly reduce charging time. Level 1 chargers are used in a residential setting, and Level 2 chargers are used in both residential and commercial settings. Due to the higher power requirements, DCFC stations are only suited to commercial settings. Charging speeds are increasing as EV charging technology continues to become more sophisticated. In 2012, the Governor of California issued Executive Order B-16-2012 25, setting a goal of having 1.5 million ZEVs in California by 2025. The 2016 ZEV Action Plan outlined new actions to be taken by state agencies in order to achieve this goal. In January 2018, the Governor issued Executive Order B-48- 18, setting a target of 5 million ZEVs in California by 2030, and launched an eight-year initiative to accelerate ZEV sales through a $2.5 billion package of vehicle rebates and infrastructure investments. 26 Spurred by supportive state and federal policies, there has been a surge in the California EV market over the last few years. More than 350,000 EVs are in use in California, representing roughly half the EVs sold across the country. 27 In the first quarter of 2017, 4.8 percent of new vehicles registered in California were EVs, the highest share ever recorded. 28 Significant investments in EV infrastructure have been made in California. More than 10,000 Level 2 and 1,500 DCFC connectors have been deployed across the state. 29 More than 40 EV models are currently available in California. 30 Car manufacturers have announced the release of more than 70 new models over the next five years.31 Several new long range EVs are in the launch pipeline. Many leading automakers – including Jaguar, Volvo, and General Motors (GM) – have announced that they will no longer manufacture new vehicle models powered solely by internal combustion engines. 32 However, barriers to accelerated deployment of EVs remain. These issues, pertaining to the EV market as a whole, are being considered by the CPUC 33 and other state agencies. This paper discusses barriers relating to EV acquisition and use in the specific context of the TNC sector (Section 3). Electrifying the Ride-Sourcing Sector in California – April, 2018 6
2            State of the TNC Industry
             in California

Electrifying the Ride-Sourcing Sector in California – April, 2018   7
This section analyzes trends in the California TNC sector relating to trip miles, deadhead miles, and use
of pooled services, based on data provided by Lyft and Uber in response to a data request from the
CPUC. 34
We use the following definitions of trip miles, deadhead miles, and total miles in this paper.
• Trip miles are defined as the miles traveled by a TNC driver with a passenger in the vehicle,
from the passenger pick-up point to the passenger drop-off point.
• Deadhead miles are defined as the sum of miles driven by a TNC driver with the TNC app on,
while waiting to be matched with a passenger (Period 1 VMT), and miles driven by the TNC
driver from their location to the passenger’s location to pick up the passenger, after the match
has been made (Period 2 VMT). 35 In other words, deadhead miles capture non-revenue
generating TNC VMT, over and above trip miles. We define deadhead miles to include Period 1
miles in order to capture VMT by TNC drivers who travel from their residences into dense
metropolitan areas with high demand for TNC services in search of passengers. 36 Period 2 miles
are a function of TNCs’ dispatch efficiency, which, as noted earlier, can be expected to improve
over time. Both TNCs reported that there are several computational challenges associated with
calculating deadhead miles – these are discussed in Section 2.2.
• Total miles are defined as the sum of trip miles and deadhead miles.
Data was requested for the period from September 1, 2014, through October 31, 2017. Lyft only
submitted data relating to EV use on their platform for the period from July 1, 2016 onwards as it did
not regularly track this data before then. Both TNCs provided data on deadhead miles only for the
period from July 1, 2016, through October 31, 2017.
For each of the parameters considered – trip miles, deadhead miles, and use of pooled services – we
offer a snapshot of key statistics for October 2017, which is the latest month for which we have TNC
data. We consider the latest monthly data for these parameters, rather than annual data for 2017, as it
provides us with the most recent picture of a rapidly growing industry.
2.1 Size of the TNC Sector and Growth Trends
The TNC industry has grown rapidly over the last few years, as demonstrated by Figure 3 below, which
shows year-on-year growth in aggregate trip miles traveled on the Lyft and Uber platforms between
November 2015 - October 2016 and November 2016 - October 2017.
Electrifying the Ride-Sourcing Sector in California – April, 2018 8Figure 3: Year on Year Growth Rate in Aggregate Trip Miles Traveled on Lyft and Uber Platforms in
California (Nov. ’15 – Oct. ’16 & Nov. ’16 – Oct. ’17)
Total vehicle miles traveled on the California state highway system in October 2017 amounted to 17.22
billion miles. 37 Based on data provided by Lyft and Uber, total VMT on the two TNC platforms in
California in October 2017 amounted to approximately 2 percent of that figure. As a point of reference,
the California Air Resources Board (CARB) has determined that across the state’s transportation sector,
VMT reductions of 7 percent below projected VMT levels in 2030 are needed to meet statewide
emission reduction targets. 38
A back of the envelope calculation (see Appendix D) shows that the overall CO 2 emissions associated
with TNC operations for the 12-month period between November 2016 – October 2017 is 0.918M
metric tons of CO 2 . This is equivalent to the annual energy use of approximately 100,000 households,
and represents about 0.54 percent of California’s transportation sector emissions in 2015 (the most
recent year for which data on transportation sector GHG emissions is available), and about 0.8 percent
of emissions from the state’s light duty vehicles segment in 2015. More granular data is needed to
develop a more precise estimate of the emissions footprint of the TNC sector.
While some plateauing of growth rates is inevitable, if TNCs continue to grow at a steady rate, all else
being equal, the sector’s GHG emissions footprint is likely to significantly expand in the coming years.
Electrifying the Ride-Sourcing Sector in California – April, 2018 9A comparison with other segments of the transportation sector (e.g., TCPs, taxis) is needed to derive an understanding of the relative size of the TNC sector’s emissions footprint. However, we did not have access to the data needed to perform a robust comparative analysis. The CPUC does not collect data on VMT for the TCP sector, and we were unable to obtain VMT data for taxis, which are regulated by cities and counties in California. This leads us to a fundamental question about the net impact of TNC operations on total VMT in California – all else being equal, is the TNC sector increasing total VMT in the state? The answer to this question depends on how TNC users might have traveled if they had no access to TNC services. TNCs compete with public transit, taxis, personal vehicles, and more active modes of transport such as walking and biking. The extent of mode-shifting, and the net effect of TNC use on total VMT is difficult to assess, as it is difficult to accurately capture the counterfactual for a TNC ride. Would the passenger have driven a personal vehicle, used a taxi or public transit or car share, or would they have biked or walked to their destination, or not made the trip at all? 39 Some studies suggest that TNC operations likely contribute to a net increase in VMT. For instance, a 2017 University of California, Davis (UC Davis) study, which considered seven major metropolitan areas (Boston, Chicago, Los Angeles, New York, the San Francisco Bay Area, Seattle, and Washington, D.C.), found that, on average, TNC use is associated with a net 6 percent reduction in overall public transit use in these cities.40 The substitutive/complementary nature of TNC services relative to public transit was found to vary significantly depending on the type of public transit service in question. The study found that TNC operations were associated with decreased use of bus services (6 percent net reduction) and light rail services (3 percent net reduction), and increased use of commuter rail services (3 percent net increase). The authors concluded that 49 percent to 61 percent of TNC trips would not have been made at all, or would have been made by walking, biking, or public transit, and that TNC use is likely to contribute to growth in VMT in the cities studied. However, other studies have concluded that TNC use complements public transit use, and that it is more likely to substitute for automobile trips than public transit travel. 41 For instance, one study found that after Lyft and Uber suspended operations in the city of Austin in 2016, following a regulatory change 42, 42 percent of their users reported turning to other TNCs for trips similar to those that they made using Lyft or Uber prior to the suspension. Forty-one percent reported transitioning to a personal vehicle for such trips. Only 3 percent turned to public transit. The authors note that because this study is based on a convenience sample (i.e., a sample which is not representative of the population studied), the conclusions should not be generalized to the overall population of TNC riders in Austin. 43 The divergent conclusions reached by these studies suggest that the impact of TNC operations on VMT (additive or subtractive) may vary depending on the specifics of the local context. 44 For instance, the impact of TNC operations on total VMT may differ by region depending on the availability of robust public transit options. In cities with a dense public transit system, such as New York, TNC users may be more likely to have walked or used public transit if they had no access to TNC services. In cities without a robust public transit system, TNC rides are more likely to have substituted rides in personal vehicles. 45 The UC Davis study employs a representative sampling approach, designed to create a sample that is representative of urban and suburban populations in the regions studied, making its conclusions more authoritative than those of other studies, which have generally relied on convenience samples. There is, however, no study to date that has identified a causal relationship between the use of TNC services and components of travel behavior such as VMT and multimodality. 46 Further data and analysis is needed to fully understand the net impact of TNC services on VMT in California. 47 Finally, although the overall impacts of TNC operations on total VMT in California are not fully clear, TNC deadhead miles, discussed in further detail below, are likely to be incremental miles. With the Electrifying the Ride-Sourcing Sector in California – April, 2018 10
exception of taxis, none of the modes of transportation that TNCs compete with are known to generate
comparable levels of deadhead miles.

2.2 Deadhead miles generated by TNC operations
Key summary statistics relating to TNC sector deadhead miles for October 2017 are presented in Table 1
below.

  Table 1: Summary Statistics on Deadhead Miles Driven on Lyft and Uber Platforms in California
                                        (Oct. 1-31, 2017)

  Aggregate deadhead miles                                                 134.64 M
  Deadhead miles as a percentage of trip miles
                                                                             64.8%
  traveled

  Deadhead miles as a percentage of total miles
                                                                            39.33%
  traveled

For the two TNCs combined, deadhead miles constituted close to 65 percent of total trip miles, i.e.,
more than one deadhead mile was generated for every two trip miles. For the sector as a whole,
deadhead miles were roughly 40 percent of total VMT. The San Francisco County Transportation
Authority reports the same figure for the San Francisco taxi industry. 48 In contrast, a 2016 National
Bureau of Economic Research working paper found that the percentage of non-revenue generating miles
driven by a sample of taxi drivers in Los Angeles and Seattle exceeded corresponding figures for a
sample of Uber drivers in the two cities. 49 This suggests that deadhead miles for the TNC/taxi industries
may vary depending on the local context. We were unable to access taxi data needed to perform such a
comparative analysis at the state level.

Both Lyft and Uber report that there are significant computational challenges associated with estimating
deadhead miles, and that estimates of Period 1 miles may be exaggerated. Drivers may have multiple
TNC apps open at the same time such that trip miles travelled on one TNC platform may be recorded as
deadhead miles on another. Similarly, miles traveled by a driver with more than one TNC app open,
while waiting to be dispatched by one of the TNCs, would be recorded as Period 1 miles on multiple
apps. Miles driven by TNC drivers, with a TNC app open, during their commute/while running personal
errands are also recorded as Period 1 VMT. These factors need to be taken into account in considering
the data presented in Table 1.

In sum, TNC deadhead miles are generally likely to be incremental miles, but it is challenging to precisely
measure the extent of deadheading by TNC drivers.

2.3 Pooled services offered by TNCs
TNCs have consistently presented their vision for the future as being shared, autonomous and electric,
with the stated goal of reducing emissions from the transportation sector. 50 Both Lyft and Uber offer
pooled services (Lyft Line and uberPOOL) through which passengers pay a reduced trip fare for sharing
their ride, or segments of it, with other passengers traveling in the same general direction. Both
companies recently launched versions of a new shared transportation service – Lyft Shuttle 51 and
uberPOOL Express 52 – that picks up and drops off passengers at designated locations. Unlike Lyft
Line/uberPOOL users, Lyft Shuttle/uberPOOL Express users may need to walk to their nearest pick-
up location to access a ride, or from their drop-off location to their destination. Lyft and Uber have both
advertised this new service as being their most affordable offering. 53 Lyft and Uber also have a fare-
Electrifying the Ride-Sourcing Sector in California – April, 2018                                        11
splitting feature, which allows customers to split the fare for a ride with passengers traveling along with
them from their pick-up point to the same destination. We did not consider rides for which passengers
shared the fare using the fare-splitting feature as pooled rides.
It is important to note that TNCs do not collect data on load factor (i.e., the number of passengers
transported in a given ride) for non-pooled rides, which constitute the bulk of TNC rides. For each such
ride, only the chartering party, i.e., the passenger who requested the ride using the TNC app, is recorded
as a passenger. Therefore, the passenger count recorded by TNCs is an underestimate. 54 It is important
to keep this in mind in considering data on the use of TNCs’ pooling services presented in this paper.
There is a strong case for collection of load factor data by TNCs for all rides, as this data would help
create a fuller picture of the sector’s GHG emissions profile.
In October 2017, 31.7 percent of the chartering parties recorded by Lyft and Uber used a pooled service
(i.e., Lyft Line, Lyft Shuttle, uberPOOL, and uberPOOL Express). Figure 4 reflects growth in the use of
pooled services on TNC platforms.
Figure 4: Chartering Parties Transported via Pooled Services as a Percentage of All Chartering
Parties Recorded by Lyft and Uber in California by Quarter (Q3 2014-Q3 2017)
Electrifying the Ride-Sourcing Sector in California – April, 2018 12We consider total chartering parties transported via pooled rides as a percentage of all chartering parties recorded by TNCs (rather than pooled rides as a percentage of all TNC rides) to gauge the extent of pooling on TNC platforms. The number of pooled rides recorded by TNCs may not always be a true measure of the extent of pooling on TNC platforms – there may be cases in which a TNC customer who requests a pooled ride is not matched with other passengers, so that their ride is effectively a non-pooled ride. A 2017 report filed by Uber with the CPUC states that over the first half of 2016, approximately 11 million vehicle miles were avoided by passengers who opted for pooled rides instead of traveling singly on the Uber platform. However, pooled trips may not always reduce total VMT. If the “detour miles” driven between passenger pick-up and drop-off points exceed VMT saved through pooling, pooled trips could potentially increase total VMT. Broadening the appeal of pooling can be challenging. Passengers must be willing to share their ride, and dispatch algorithms must match passengers efficiently and minimize passenger and driver inconvenience. 55 TNCs will need to address these challenges in order to increase the uptake of pooled services on their platforms. Electrifying the Ride-Sourcing Sector in California – April, 2018 13
3
            Use of EVs on TNC
            Platforms – Key Trends,
            Barriers & TNC Initiatives

Electrifying the Ride-Sourcing Sector in California – April, 2018   14
Certain attributes of EVs make them particularly well suited for use on TNC platforms. BEVs can be expected to have lower maintenance costs than ICE vehicles as they have significantly fewer moving parts. 56 Maintenance costs can be significant for ICE vehicles with heavy duty cycles. 57 While charging costs can vary significantly depending on factors such as the type and time of charging, EVs have been found to generally have lower fuel costs than ICE vehicles when residential electricity rates are considered. 58 Fuel costs could be even lower for EVs that are charged at night as most utilities offer cheaper electricity rates at night. 59 A recent study based on 2017 data found that in California, BEV fuel costs could be less than half as much as for ICE vehicles, when considering the average annual number of miles traveled by light-duty vehicles in the U.S. 60 At higher levels of annual VMT – as in the case of vehicles used intensively for TNC purposes – the operational cost savings associated with EVs could be significant enough to offset the higher upfront costs. One study, based on 2015 data, found that in California, the TCO for at least one BEV model could be lower than that for a comparable ICE vehicle when considering the average annual number of miles traveled per capita on California highways. 61 These studies considered residential electricity rates, rather than rates applicable to use of DCFC stations. Estimates of EV operating costs may be higher if use of DCFC is considered. Lyft and Uber report that many EV drivers on their platforms rely on DCFC charging for their EV charging needs. Barriers relating to EV acquisition and use (e.g., sticker price, access to charging infrastructure, and charging costs) can make it challenging for TNC drivers to capture the benefits associated with EVs. These barriers are discussed in detail in Section 3.5. 3.1 An Opportunity to Increase Economy-Wide EV Adoption The large, growing scale of TNC operations suggests that there may be a sizeable opportunity to increase awareness of EVs through information sharing between TNC EV drivers and passengers. Multiple studies have found that the level of awareness about EVs in California is very low. For instance, a 2016 UC Davis study found that around 70 percent of new car buyers in California —who had searched for information about cars, visited new car lots, and purchased a vehicle — could not name a single BEV model. 62 Even more troublingly, EV awareness levels seem to have largely remained static over the last few years despite concerted EV marketing efforts by the government and the EV industry. Researchers at the UC Davis Institute of Transportation Studies conducted five surveys from June 2014 to June 2017 to assess Californian car-owning households’ engagement with EVs. 63 The percentage of car-owning households who considered an EV when they completed their questionnaire was no higher in 2017 than in 2014. Awareness of EV purchase incentives and how PHEVs and BEVs are fueled also remained static over this time period. Even though the number of EV makes and models offered for sale nearly doubled between 2014 and 2017, fewer Californians were able to name an EV model for sale in 2017 than in 2014. Knowledge of, and exposure to, EVs has been found to result in lasting positive impressions that influence subsequent vehicle purchase decisions. 64 Exposure to EVs through ride and drive events and car-sharing programs, and information from other EV drivers have been found to be the most powerful information sources influencing new buyers to opt for an EV. 65 A key focus area in California’s 2016 ZEV Action Plan is increasing familiarity with EVs through a public campaign enabling 20 million test drives of ZEVs by 2025, and by promoting ZEV use in car sharing services, rental car services, and carpool and vanpool programs. 66 The TNC sector presents a viable platform to advance these goals. TNC EV drivers have consistently reported 67 that passengers commonly notice the vehicle technology, that EV technology is routinely a topic of conversation with passengers, and that passengers generally leave with a positive impression of EV technology. 68 It is, however, difficult to assess the extent to which TNC passengers – who tend to be relatively affluent, Electrifying the Ride-Sourcing Sector in California – April, 2018 15
young, college educated individuals 69 – may have had prior exposure to EVs.

Increasing TNC drivers’ exposure to EVs also creates a channel for information about acquiring and
owning EVs to be disseminated to their network of friends and families who are likely to represent a
different, more diverse set of demographic groups than TNC riders and the average EV owner – on
average, TNC drivers tend to be lower income individuals with socioeconomic characteristics different
from those of TNC riders. 70
3.2 Use of EVs on TNC Platforms – A Statistical Analysis
Figures 5 and 6 below reflect growth trends in the aggregate number of EVs operated on TNC
platforms, and EV trip miles (i.e., total number of trip miles travelled in EVs) as a percentage of total trip
miles (i.e., trip miles travelled in EVs and non-EVs). Table 2 provides key summary statistics relating to
EV use on TNC platforms for October 2017, including EVs as a percentage of total vehicles registered
on TNC platforms. FCEVs were included within the meaning of EVs for the purposes of Figures 5 and
6, and Table 2. An extremely small number of FCEVs are currently being used on TNC platforms. The
TNCs reported that a conservative approach was employed in identifying EVs registered on their
platforms, and that the EV counts provided to the CPUC are low estimates. The information presented
in Figures 5 and 6, and in Table 2 must be considered in light of this caveat.

As TNC drivers often operate on multiple TNC platforms, summing the number of vehicles/EVs
registered on the two platforms to derive an aggregate figure for the overall sector could lead to double
counting. Therefore, we derived an approximate range of values for the aggregate number of
vehicles/EVs for the two TNCs combined for the purposes of Figure 5 and Table 2 – the upper end was
calculated assuming no overlap between vehicles registered on the two platforms, and the lower end was
calculated assuming that all vehicles registered on one platform were also registered on the other.

Electrifying the Ride-Sourcing Sector in California – April, 2018                                          16
Figure 5: Aggregate Number of EVs Used on Lyft and Uber Platforms in California by Quarter
                                       (Range of Values)
                                       (Q3 2016– Q3 2017)

* Lyft did not collect data on the number of EVs on its platform prior to July 2016.
** As TNC drivers often operate on multiple TNC platforms, summing the number of EVs registered on the two platforms to derive
an aggregate figure for the overall sector could lead to double counting. Therefore, we derived an approximate range of values for the
aggregate number of EVs for the two TNCs combined, which is represented by the shaded region.

Electrifying the Ride-Sourcing Sector in California – April, 2018                                                                   17
Figure 6: EV Trip Miles as a Percentage of Total Trip Miles Traveled on Lyft and Uber Platforms in
California by Quarter (Q3 2016– Q3 2017)
* Lyft did not collect data on the number of EVs on its platform prior to July 2016.
** Given data limitations, all miles traveled in EVs (including PHEVs) were counted as EV miles. Considering only miles traveled in
fully electric cars would leave us with an overly conservative estimate of EV miles traveled.
In October 2017, the aggregate number of EVs as a percentage of all vehicles registered on the Lyft and
Uber platforms fell in the range of 0.89 percent to 1.12 percent. It is instructive to compare EV use figures
in the TNC sector with corresponding figures for California as a whole. Through May 2017, approximately
300,000 EVs had been sold in California. 71 The most recently available data shows that there were just
over 25 million automobiles registered in the state at the end of 2016. 72 Based on this data, as a rough
estimate, the percentage of EVs registered in California is approximately 1.19 percent.
Electrifying the Ride-Sourcing Sector in California – April, 2018 18Table 2: Summary Statistics on Use of EVs on Lyft and Uber Platforms in California (Oct. 1-31, 2017)
Aggregate number of EVs 2,596 – 3,259* (approx. range)
EVs as a percentage of all vehicles registered
0.89% - 1.12%* (approx. range)
on the platforms
Aggregate number of EV miles traveled (trip
2.25 M**
miles only)
EV trips (pooled and non-pooled) as a
1%
percentage of total trips
EV miles traveled as a percentage of trip miles 1%
EV miles traveled as a percentage of total miles
1%
(trip miles + deadhead miles)
*Given data limitations, all miles traveled in EVs (including PHEVs) were counted as EV miles. Considering only miles traveled in
fully electric cars would leave us with an overly conservative estimate of EV miles traveled.
**As TNC drivers often operate on multiple TNC platforms, summing the number of EVs registered on the two platforms to derive
an aggregate figure for the overall sector could lead to double counting. Therefore, we derived an approximate range of values for the
aggregate number of EVs for the two TNCs combined, which is represented by the shaded region.
Comparing these figures with the corresponding figures for other modes of transportation puts them in
perspective.
Public transit: Three percent of statewide buses are fully electric. An additional 7 percent are diesel
electric hybrids. 73 The higher load factor generally associated with public transit translates into higher
overall efficiency and lower emissions per passenger, relative to other commercially used passenger
vehicles, such as TNCs. CARB is in the midst of developing an Innovative Clean Transit (ICT) proposal
for complete transition of public transit fleets to zero emission technologies. The long term vision of the
ICT effort is to achieve a zero emission public transit system by 2040. 74
Taxis: Taxis operating in the largest cities in California – where TNC rides tend to be most densely
clustered 75 – are subject to emission standards imposed by local regulatory bodies.76 Some examples are
set out below.
o San Francisco: In 2007, the San Francisco Taxi Commission (SFTC) passed a resolution setting a
target of 20 percent reduction in emissions from 1990 levels by 2012 for taxis operating in the
city, a goal that has been surpassed. 77
o Los Angeles: In 2000, the South Coast Air Quality Management District passed Rule 1194
requiring taxis operating at local airports to transition fleet vehicles to Super Ultra Low Emission
Vehicles (SULEV) or Ultra Low Emission Vehicles (ULEV). 78 As part of the Green Taxi
Program, Los Angeles taxi operators have been required to bring approved “green” vehicles into
taxicab service since 2011. 79
o San Diego: In 2015, the City of San Diego announced that new taxicab permits would only be
issued to drivers who drive a ZEV or low emission vehicle as defined by CARB. 80
In addition, CARB is in the process of discussing regulatory concepts and developing a strategy to
accelerate the deployment of zero-emission airport transportation. 81
Electrifying the Ride-Sourcing Sector in California – April, 2018 193.3 TNC Drivers’ EV Charging Behavior – A Discussion of Preliminary Evidence Data on TNC drivers’ charging behavior is limited as TNCs do not collect this information. However, some preliminary conclusions may be drawn based on other sources of data. A March 2017 report by EVgo Services LLC (EVgo) – the operator of a network of DCFC charging stations – analyzes utilization data for the top three EVgo charging stations in the Los Angeles area used by drivers who rented EVs from Evercar, a company that offered all-inclusive hourly EV rental packages (including charging costs) to TNC drivers and other drivers working with companies in the sharing economy space. Evercar ceased operations in October 2016. 82 Based on data collected over a 16-week period in 2016, EVgo reported that use by Evercar drivers led to a significant increase in the overall utilization of the three charging stations. EVgo also reported that Evercar drivers’ charging patterns largely complemented charging by non-Evercar drivers during the study period (see Appendices A-C). Further information on the study can be found in Box 2. The limited duration of the study, the small sample size, and the fact that it considered only one EV model with more limited range than the latest EV models in the market today, limit the extent to which its conclusions can be generalized. 83 Nonetheless, these results provide preliminary evidence suggesting that there may be an opportunity to increase the load factor of public charging stations through increased off-peak charging by TNC EVs, which could potentially increase charging station profitability. Some commentators have noted that the high upfront capital expenditure associated with the installation of DCFC charging stations combined with low utilization levels – due to the low number of EVs that are currently in use – limits the business opportunity for deployment of such chargers. 84 Increasing DCFC charging station utilization levels through increased TNC use would help address this challenge. Additionally, policy interventions (e.g., target setting) that create certainty around the increased use of EVs in the TNC sector would send a clear market signal to the EV charging infrastructure industry, and potentially increase the attractiveness of investments in this space, thereby accelerating the buildout of such infrastructure. Electrifying the Ride-Sourcing Sector in California – April, 2018 20
You can also read