Travel adaptive capacity assessment for particular geographic, demographic and activity cohorts July 2012
←
→
Page content transcription
If your browser does not render page correctly, please read the page content below
Travel adaptive capacity assessment for
particular geographic, demographic and
activity cohorts
July 2012

Associate Professor Susan Krumdieck
Dr Shannon Page
Dr Montira Watcharasukarn

Advanced Energy and Materials Systems Laboratory
Department of Mechanical Engineering
University of Canterbury, Private Bag 4800, Christchurch

NZ Transport Agency research report 486
ISBN 978-0-478-39447-4 (electronic)
ISSN 1173-3764 (electronic)

NZ Transport Agency
Private Bag 6995, Wellington 6141, New Zealand
Telephone 64 4 894 5400; facsimile 64 4 894 6100
research@nzta.govt.nz
www.nzta.govt.nz

Krumdieck, S, S Page and M Watcharasukarn (2012) Travel adaptive capacity assessment for particular
geographic, demographic and activity cohorts. NZ Transport Agency research report 486. 91pp.

This publication is copyright © NZ Transport Agency 2012. Material in it may be reproduced for personal
or in-house use without formal permission or charge, provided suitable acknowledgement is made to this
publication and the NZ Transport Agency as the source. Requests and enquiries about the reproduction of
material in this publication for any other purpose should be made to the Research Programme Manager,
Programmes, Funding and Assessment, National Office, NZ Transport Agency, Private Bag 6995,
Wellington 6141.

Keywords: active modes, adaptation, alternative mode, behaviour change, choice, Christchurch, Dunedin,
fuel shortage, mode, New Zealand, Oamaru, public transport, survey method, travel, travel adaptive
capacity, virtual reality.
An important note for the reader
The NZ Transport Agency is a Crown entity established under the Land Transport Management Act 2003.
The objective of the Agency is to undertake its functions in a way that contributes to an affordable,
integrated, safe, responsive and sustainable land transport system. Each year, the NZ Transport Agency
funds innovative and relevant research that contributes to this objective.

The views expressed in research reports are the outcomes of the independent research, and should not be
regarded as being the opinion or responsibility of the NZ Transport Agency. The material contained in the
reports should not be construed in any way as policy adopted by the NZ Transport Agency or indeed any
agency of the NZ Government. The reports may, however, be used by NZ Government agencies as a
reference in the development of policy.

While research reports are believed to be correct at the time of their preparation, the NZ Transport Agency
and agents involved in their preparation and publication do not accept any liability for use of the research.
People using the research, whether directly or indirectly, should apply and rely on their own skill and
judgment. They should not rely on the contents of the research reports in isolation from other sources of
advice and information. If necessary, they should seek appropriate legal or other expert advice.
Acknowledgments
The research team thanks Dr Andre Dantas (Transport Engineering, Department of Civil Engineering,
University of Canterbury) and members of the AEMSLab Energy and Transport Group, particularly Stacy
Rendall. The research team also thanks the steering committee members for providing valuable feedback
and ideas: Mark Walkington, Ministry of Economic Development; Rose Dovey, Environment Canterbury;
Louise Lennane, Ministry of Social Development; Sue Philbin, Opus Consultants, and Nick Bryan, Ministry
of Transport.

Thanks also to the peer reviewers: Axel Wilke of ViaStrada and Stuart Woods of MWH NZ Ltd. Dr
Watcharasukarn acknowledges financial support from the Brian Mason Scientific and Technology Trust,
which helped to support her work developing the TACA Sim virtual reality game survey. Finally, the
research team expresses sincere thanks to the survey participants and council officers in Oamaru and
Dunedin who facilitated the surveys.

Abbreviations and acronyms
AA:                Automobile Association

AEMSLab:           Advanced Energy and Material Systems Laboratory, a research group at UoC

IEA:               International Energy Agency

MoT:               Ministry of Transport

NZTA:              NZ Transport Agency

NZHTS:             New Zealand Household Travel Survey

RECATS:            Risk of Energy Constrained Activity Transport Systems; computer software

Travel Sim:        A virtual reality sim game survey; used in previous research

TACA survey:       Travel adaptive capacity assessment survey; a web-based survey used in this study

TDM:               Travel demand management

UoC:               University of Canterbury

UK:                United Kingdom

USA:               United States of America

VKT:               Vehicle kilometres travelled

VTBC:              Voluntary travel behaviour change

                                                    4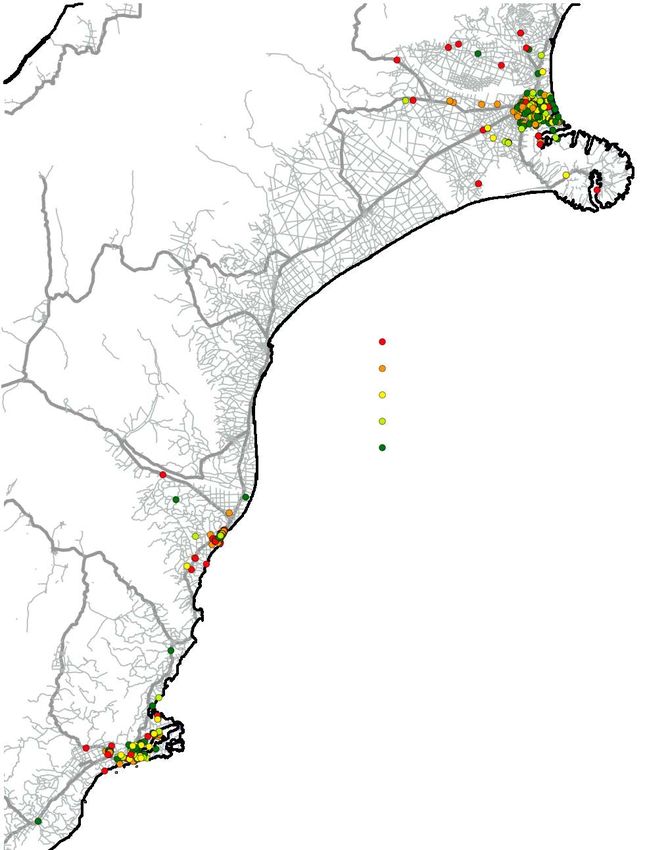
Contents
Executive summary ............................................................................................................................................................................................... 7
Abstract ................................................................................................................................................................................................................... 10
1            Introduction ............................................................................................................................................................................................ 11
             1.1           Context.................................................................................................................................................... 11
                           1.1.1         Why oil shocks must be considered............................................................................................ 11
                           1.1.2         Key definitions ............................................................................................................................ 11
                           1.1.3         Previous research on fuel supply risk and travel adaptability .................................................... 11
                           1.1.4         Previous research on surveying for travel adaptation to oil shocks ........................................... 12
             1.2           Research objectives................................................................................................................................. 12
             1.3           Study overview and outputs .................................................................................................................... 13
                           1.3.1         Data collection ............................................................................................................................ 13
                           1.3.2         TACA survey data ........................................................................................................................ 13
                           1.2.3         Travel adaptive capacity analysis ................................................................................................ 13
             1.4           Structure of this report ........................................................................................................................... 13
2            Literature review and background .............................................................................................................................................. 15
             2.1           Transport fuel supply issues................................................................................................................... 15
                           2.1.1         Context ........................................................................................................................................ 15
                           2.1.2         Alternatives do not mitigate fuel supply issues ......................................................................... 15
             2.2           Travel behaviour adaptation ................................................................................................................... 16
                           2.2.1         Causes of shocks ........................................................................................................................ 16
                           2.2.2         Fuel supply issues and travel behaviour change ........................................................................ 17
                           2.2.3         Travel behaviour change surveys ................................................................................................ 19
             2.3           TACA survey calibration using the Travel Sim game .............................................................................. 21
                           2.3.1         The Travel Sim game ................................................................................................................... 21
                           2.3.2         Future planning for petrol price pressure and reduced oil supply............................................. 25
             2.4           Summary of background and literature review ...................................................................................... 27
3            Description of the TACA survey tool and survey methodology ................................................................................... 28
             3.1           Introduction ............................................................................................................................................ 28
             3.2           The web-based TACA survey tool ........................................................................................................... 28
             3.3           The TACA survey methodology .............................................................................................................. 31
                           3.3.1         The survey locations ................................................................................................................... 31
                           3.3.2         Survey approach .......................................................................................................................... 32
             3.4           The TACA survey database ..................................................................................................................... 33
             3.5           Survey validation ..................................................................................................................................... 34
                           3.5.1         General overview ......................................................................................................................... 34
                           3.5.2         Dunedin TACA survey data compared to NZHTS data ................................................................ 34
                           3.5.3         TACA survey validation using the UoC travel survey .................................................................. 35
             3.6           Data quality ............................................................................................................................................. 36
                           3.6.1         Demographic profile of TACA survey participants ..................................................................... 36
                           3.6.2         Geographic locations of TACA survey participants .................................................................... 37
             3.7           Summary ................................................................................................................................................. 40

                                                                                                                 5
4 Travel adaptive capacity data......................................................................................................................................................... 41
4.1 Overview .................................................................................................................................................. 41
4.2 Essentiality of trips ................................................................................................................................. 41
4.3 Travel demand patterns .......................................................................................................................... 43
4.4 Adaptive potential ................................................................................................................................... 45
4.3.1 All study groups .......................................................................................................................... 45
4.3.2 Adaptive potential and income ................................................................................................... 48
5 Adaptability analysis .......................................................................................................................................................................... 51
5.1 Calculating adaptability .......................................................................................................................... 51
5.2 Adaptability of TACA survey participants ............................................................................................... 52
6 Summary and conclusions ............................................................................................................................................................... 60
6.1 Summary overview .................................................................................................................................. 60
6.2 Main findings .......................................................................................................................................... 60
6.3 Main limitations ...................................................................................................................................... 61
6.4 Future directions ..................................................................................................................................... 62
7 References ................................................................................................................................................................................................ 64
Appendices ............................................................................................................................................................................................................. 70
6Executive summary
Oil shocks, peak oil and long-term oil supply reduction are emerging as major issues in transportation
planning. Over the last decade, the price of oil in real terms increased nearly ten-fold. Currently, world oil
production has little spare capacity. The large conventional oil fields around the world are either unable to
increase production or are in decline. New oil extraction tends to be from more expensive resources such
as offshore, deep water, oil sands and remote locations. A survey of international government, economic
and military analyses reveals a consensus that alternatives to conventional oil will not fill the gap between
flat or declining oil production and increasing demand. All sources of analysis predict destabilising trends
that will put downward pressure on demand.
Data and analysis methods available for assessing the vulnerability, responsiveness and sustainability of
personal vehicle transportation in the future climate of constrained world oil supply are lacking. Nearly all
published studies of fuel price elasticity were conducted in times of surplus world oil supply capacity.
These studies examine costs and social drivers for behavioural change when the option of the convenient
personal car is readily available and when no fuel crisis is occurring. Research into behaviour change as
fuel prices spike is nearly impossible to carry out because participants cannot be artificially subjected to
these disruptions under controlled conditions. Researchers examined the travel behaviour change of
drivers during the 1970s oil embargo in the USA and the 2000 petrol shortage in the UK. These events
had very high levels of behaviour change even though real fuel costs changed only slightly. Some
important findings were that the work trip and other trips which were important to family wellbeing were
the least likely to be changed, and that cities that had effective public and cycling transport infrastructure
had much higher levels of mode change than cities where people did not have these options.
We propose that travel adaptive capacity to reduce fuel use is a key metric for future resource allocation,
asset management, safety and transport engineering. Travel adaptive capacity is a measure of the
resilience of transport activity systems to a reduction in fuel use for personal vehicle trips while not
reducing participation in activities. Travel adaptive capacity characterises the vulnerability to oil shocks of
a particular urban area, organisation, socioeconomic or demographic group.
The long-term potential demand growth for public transport, ride sharing or active modes is measured by
the travel adaptive potential for mode change. The travel adaptive potential is a measure of the
alternative mode uptake currently possible for private travellers. We propose that the currently perceived
options, while not strictly predictive, provide a relevant indication of the shifts that can be expected as
pressure on fuel supply increases for a given urban form.
A web-based interactive travel adaptive capacity assessment survey (the TACA survey) was used for this
project. The TACA survey collects habitual or ‘normal’ weekly travel activity patterns and does not attempt
to capture all random or occasional trips. After recording a normal trip (mode, origin, destination,
purpose, time, route and importance), the TACA survey participants are simply asked to indicate up to
three alternative modes for each trip. The survey asks ‘Do you have an alternative mode for this trip?’ The
first alternative selection in the drop-down menu is ‘no alternative’. This is different from surveys that ask
about choices between alternatives at particular prices.
The TACA survey resulted from previous research that developed a virtual reality sim game survey (Travel
Sim). The adaptive capacity data from the TACA survey was calibrated to the sim game survey results. The
Travel Sim game price elasticity with fuel prices rising up to 3.5 times the current price was –0.22,
commensurate with many published studies. However, at 4 and 5 times the current price, the Travel Sim
game elasticity becomes sharply higher. Using the Travel Sim price rise, we calibrated the travel adaptive
capacity data found in this survey to represent the fuel demand reduction associated with a five-fold
7Travel adaptive capacity assessment for particular geographic, demographic and activity cohorts
increase in fuel price. Thus the TACA survey adaptive capacity represents what the participants could do if
a fuel emergency arose and not what they would do under normal circumstances. The TACA survey results
also indicate the relative adaptive capacity of the urban form to long-term pressure for change resulting
from fuel insecurity and scarcity. Many factors influence the availability of alternative modes for carrying
out activities, the geography of the urban from being chief among these. The TACA survey results are not
meant to predict the long-term future of travel behaviour. However, the results indicate which populations
and urban areas will experience greater pressure for change, and which are more resilient and adaptable.
This research makes a contribution to stakeholders, planners and engineers in providing data and models
of travel adaptive capacity. The data can be used to understand possible future trends in urban
development, network designs, motor vehicle use and active transport mode share. Urban transport
demand modellers using the traditional four-step approach can use the long-run adaptive capacity and
adaptive potential to reconsider the trip generation, trip distribution and modal split functions in the event
of a fuel shock or in the long-term context of declining world oil supply. If transport models are based on
the trip-consumer approach, then modellers can incorporate the understanding of behaviour adaptation
under fuel supply pressure.
The data presented in this report was collected from 555 participants in three urban areas in several
sampling exercises between October 2008 and August 2010. The TACA survey was deployed in
Christchurch and Dunedin, and the rural town of Oamaru. In Christchurch, the surveys focused on a major
activity system, the University of Canterbury. Academic staff, general staff and students were surveyed,
representing different income and age groups. In Oamaru, elderly and retired citizens were targeted
during one of three surveys. In Dunedin and Oamaru, the survey solicited random participation from
people who were visiting the central business area of the town. Only one sampling exercise was conducted
in Dunedin. In Dunedin, a group of employees at the Dunedin City Council and residents of nearby
commuter settlements were also surveyed.
The objective of this study was to present the concepts of adaptive capacity and adaptive potential, the
survey method and the data for three different urban areas. The data is available for in-depth analysis by
other researchers, and is being further studied by the Advanced Energy and Material Systems laboratory
investigators. In this report, we present the data as collected and the adaptive capacity, but no in-depth
analysis.
The results indicate that the travel adaptive capacity of the South Island cities with good bus service is
quite high. This result should not be too surprising, given the historical character of the urban forms that
were developed with lower vehicle travel demand than today.
Students in Christchurch have the highest travel adaptive capacity. They currently carry out 50% of trips
without a car and could adapt 88% of their current single passenger vehicle trips to car-pooling, bus,
walking or biking. The higher-income university academics currently carry out 38% of their trips without a
car, and 60% of their car trips have lower-energy alternative modes. Oamaru residents have the lowest
adaptive capacity. Oamaru has a lower adaptive potential for mode shift, mainly because no public bus
service is available. In Oamaru, currently 25% of trips do not use a car and 43% of single passenger vehicle
trips have an alternative mode. Dunedin participants indicated that 22% of their current vehicle trips could
be made by bus but they had much lower adaptive potential for cycling than Christchurch or Oamaru
participants.
People in all demographic categories residing in all parts of the cities have the potential to adapt most of
their current vehicle trips to other modes. In general, young people have the highest adaptability. The
largest share of adaptive potential is bus trips, but walking and biking feature nearly as prominently.
Conversely, some people have no adaptability. While these people are found in all demographic
8categories, a higher proportion was found among the elderly and higher income participants. Participating
in the activity without travelling, as in working from home or conducting a social visit by telephone, was
selected for less than 1% of trips by all participants.
The fuel consumption associated with the alternative modes can be calculated from the travel distances
associated with each individual’s adaptive potential and the vehicle information. Not counting the trip
adaptations that involved cancelling a trip or participating without travel, the adaptive capacity for fuel use
reduction is 55% in Christchurch, 18% in Oamaru and 40% in Dunedin. This suggests that voluntary travel
behaviour change in response to a fuel shock could be substantial, but does necessarily predict long-term
behaviour.
We recommend that the focus of transport policy should shift away from subsidies for measures like
alternative fuels or electric vehicles, as the adaptive capacity for fuel reduction is larger than the capacity
for uptake of new vehicles or making biofuel. Many people are currently aware of their alternatives, which
is the first requirement for future behaviour change.
The high fuel prices of 2008 are likely to be followed by more price shocks and continued high prices. The
world transport fuel supply will continue to be tight and will contract in the future. Further analysis of
TACA survey data could help shape transport policy. Policy needs to deal with the need for reduced fuel
consumption and should focus on facilitating adaptation through providing safe, affordable active mode
and electric public transport infrastructure, and promotion of urban forms with high adaptive capacity.
Other important policy implications are the need for access to affordable housing near activity centres for
low-income people, public transport, cycle and walking infrastructure, and access to activities for elderly
people. Sustainable transport advocates have been calling for these types of measure for many years. The
TACA survey data provides new cost/benefit analysis capability that should be useful in planning for
sustainable transport investments. Adaptive capacity data could be used to allocate infrastructure
expenditure for energy-efficient modes in order to gain the most resilience and adaptive capacity benefits.
The TACA survey has added interesting new insights about adaptive capacity to reduce fuel use, and the
adaptive potential of different modes in Christchurch, Dunedin and Oamaru. The survey is the first of its
kind in the world, and more research is needed to fully analyse the data and use it in adaptation
modelling. We recommend that other urban areas throughout New Zealand conduct TACA surveys to
provide travel adaptive capacity data for specific areas and activity systems. Travel behaviour change with
increased fuel prices is very complex and depends on a whole range of factors, including urban form and
accessibility, income and age, and the political and media situations at the time. More research is needed
in this area, as the context for future urban planning and asset management changes from the historical
pattern of abundant low-cost fuel to the future trend of constrained high-price fuel.
9Travel adaptive capacity assessment for particular geographic, demographic and activity cohorts
Abstract
Transport infrastructure and network planning must now consider oil shocks and future demand growth
for more energy efficient transport modes. However, data and models for this type of fuel reduction
planning are not available. Travel adaptive capacity is proposed as a measure of the resilience of travel
demand to a reduction in fuel use for personal vehicle trips while not reducing participation in activities.
Travel adaptive potential characterises the ways that populations can change modes to reduce fuel use
without reducing participation in activities. The travel adaptive capacity assessment (TACA) survey can
capture the data needed to assess adaptive capacity and the preferred mode alternatives. The survey asks
for the essentiality of each trip and the alternative travel modes currently available. TACA surveys were
carried out in Christchurch, Oamaru and Dunedin. Over 550 participants completed the survey in 2008–
2010. The survey participant demographics, trip generation and mode data compared well with
government data. The report found that for these three South Island centres, some adaptive capacity is
possible, with Christchurch participants showing the greatest adaptive capacity. The TACA survey is a
useful tool for further research into travel behaviour and mode choice.
101 Introduction
1 Introduction
1.1 Context
1.1.1 Why oil shocks must be considered
Oil shocks, peak oil and long-term planning for oil supply decline are becoming mainstream transport and
urban planning issues (Smith 2010). However, no data and no modelling methods are available for
assessing short-term oil shock vulnerability and informing long-term investments for an integrated, safe,
responsive and sustainable land transport system in the context of peak oil issues. Public resources are
primarily being allocated in New Zealand for increasing the capacity of the road transport network. It is
quite probable that personal travel demand and freight movements will not increase significantly from
2007 onward, and fuel use is likely to be at least 50% less than current levels by 2050 (Krumdieck et al
2010). No mitigation measures for oil supply decline are known (Hirsch et al 2005) and alternative vehicles
such as electric cars will not be in great demand because of their high price and manufacturing constraints
(Delucchi and Lipman 2001). All transportation depends on oil and the world supply is constrained, with
major producers declining (Aleklett et al 2008; Höök et al 2009). Therefore, transportation and urban land
use planners must consider oil shocks as a risk and recognise that travel demand for energy-intensive
modes will be declining throughout any long-term planning horizon. In order to allocate resources to meet
future growth in demand for more energy-efficient modes (public transport, cycling, walking and rail), the
NZ Transport Agency (NZTA) requires data and analysis that clearly show what the adaptive potential is for
personal transport in each city and region.
1.1.2 Key definitions
• Travel adaptive capacity: Current indicated fuel reduction capacity available through alternative
mode choices with no reduction in participation in activities
• Mode adaptive potential: Current indicated potential increase in demand for trips by alternative
modes with no reduction in participation in activities
• Adaptability: Non-dimensional number indicating the relative resilience of current travel behaviour
and the ability to reduce fuel use without reducing participation in essential activities.
1.1.3 Previous research on fuel supply risk and travel adaptability
In our previous work (Dantas et al 2007), we developed a method to assess peak oil risks. The method
applies a transport energy constraint to a future transportation planning scenario for a given city plan and
calculates a risk factor related to an oil supply decline scenario. The ‘risk of energy-constrained activity
transport systems’ (RECATS) method requires an adaptation model of private travel demand behaviour. No
such model is available in the literature, although a sizeable body of work has been written on price
elasticity and adaptation to travel demand management (TDM) measures (Loukopoulos et al 2006). Long-
term adaptation are likely to be influenced by policy, economics, technological development and social
norms, but the deterministic effects would be difficult to quantify. A simple adaptation model was used in
the RECATS algorithm, based on hierarchical choice saturation (Krumdieck et al 2010). The cost
minimisation principle of adaptation was combined with the assumed adaptation goal of maintaining
participation in activities. The percentage of car trips that are ultimately adaptable to save fuel was
roughly estimated from the active and public transport mode capacity of the urban form. Negative impacts
of the adaptive changes were assigned to loss of activities. In the RECATS model, the unconstrained travel
11Travel adaptive capacity assessment for particular geographic, demographic and activity cohorts
demand frequency, distance and mode were modified via a Monte Carlo random selection of trips to adapt
the pattern until the modified fuel demand matched the constraint value. A certain percentage of short car
trips are adapted to active mode, and medium and long car trips are adapted to car-pooling and public
transport. However, it became clear that real data about travel adaptive potential amongst a particular
population in a given urban form would be needed for accurate oil supply risk assessment. In addition,
this type of adaptation potential data would be highly valuable for transportation and urban planning.
1.1.4 Previous research on surveying for travel adaptation to oil shocks
Our interdisciplinary research group at the Advanced Energy and Material Systems Laboratory (AEMSLab)
developed a novel virtual reality sim game survey method (Travel Sim) where oil shocks are simulated and
adaptation of normal travel behaviour is recorded (Watcharasukarn 2010). The Travel Sim game uses an
immersive environment to prompt participants to respond to a steep fuel price rise as they carry out their
weekly activities (Watcharasukarn et al 2010). The Travel Sim game has two-dimensional environments,
avatars and simulations of travel to work, shopping, socialising and recreation (Watcharasukarn et al
2009a). Travel Sim runs from a basic visual platform on a CD. A survey of 155 participants was conducted
in Christchurch, showing that people responded to the simulated fuel price rise (Watcharasukarn et al
2011). Travel Sim has three levels:
1 personal, household and vehicle information
2 normal weekly travel activities
3 simulation of three weeks of normal activities while fuel price rises sharply.
A web-based personal travel adaptive capacity assessment (TACA) survey was developed that only used the
first two levels of the original sim game survey. The TACA survey was found to produce similar travel
adaptive capacity results to the Travel Sim game survey (Watcharasukarn et al 2009b). In the TACA survey,
TM
participants fill in an online diary with their typical or habitual activities and then use Google Maps to
locate the origin, destination and route of the trip. They report departure and arrival times, and the
importance of each the trips. Finally, a drop-down menu prompts participants to answer the question, ‘Do
you have another way to get to this activity?’ The resulting data records the current habitual travel pattern
for a week and the alternatives that participants reported. Participants are not asked to consider price or
environmental issues, and they are not encouraged to reduce vehicle travel or use an alternative mode. We
have no way to test the hypothesis, but we propose that the TACA survey assessment of travel adaptive
capacity is a proxy for emergency fuel reduction behaviour and for long-term trends induced by pressure
from a decline in fuel supply.
1.2 Research objectives
The NZTA funded the AEMSLab, an interdisciplinary research group at the University of Canterbury (UoC),
to undertake this programme of research, aiming to break new ground in the area of future travel demand
adaptation in response to oil shocks, fuel price pressure and peak oil issues. The research programme
included the following objectives:
• to review the literature on travel behaviour change in response to fuel shocks, price spikes or scarcity
• to conduct statistically relevant TACA surveys of UoC students and staff in Christchurch, and citizens
of Oamaru (a TACA survey in Dunedin was added to the project scope in 2010 at the request of the
Dunedin City Council)
121 Introduction
• to produce a well-organised and searchable database of the data that can be used by other
researchers and practitioners
• to propose analysis methods for adaptability and carry out basic analysis of the data, including travel
adaptive capacity and personal adaptability assessment
• to report the results to UoC, city councils and regional councils.
1.3 Study overview and outputs
1.3.1 Data collection
The research programme focused on conducting surveys in urban and rural communities, and reporting
the data in a format that allows other stakeholders to use the data for further analysis. This research
deployed the TACA survey in three South Island centres, Christchurch, Oamaru and Dunedin over 2008–
2010. During the study period, the price of petrol and diesel for private transport remained relatively
constant at $1.60–1.80 per litre. Over 550 participants were surveyed. The data was collected and
organised into a searchable database. A basic adaptive capacity analysis was conducted by plotting in the
data. A method for calculating personal adaptability was also developed.
1.3.2 TACA survey data
The TACA survey was carried out in Christchurch at UoC. The subjects were all participants in one of the
city’s largest activity centres. Surveys were also conducted in Oamaru and Dunedin. The sample sizes were
statistically valid and the demographics of the participants compared well with census data. The trip
generation and travel demand patterns were validated against New Zealand travel survey data. A
searchable database has been constructed along with a data dictionary describing the logic codes used to
search in different fields.
1.2.3 Travel adaptive capacity analysis
The travel demand patterns for each cohort showing the current and adapted mode splits are presented.
The adaptive potential for fuel savings is analysed by looking at the current vehicle travel that could be
adapted to lower energy modes. The essentiality of trips is examined against trip purpose. A method for
calculating personal adaptability from the data is presented and analysed according to participant income
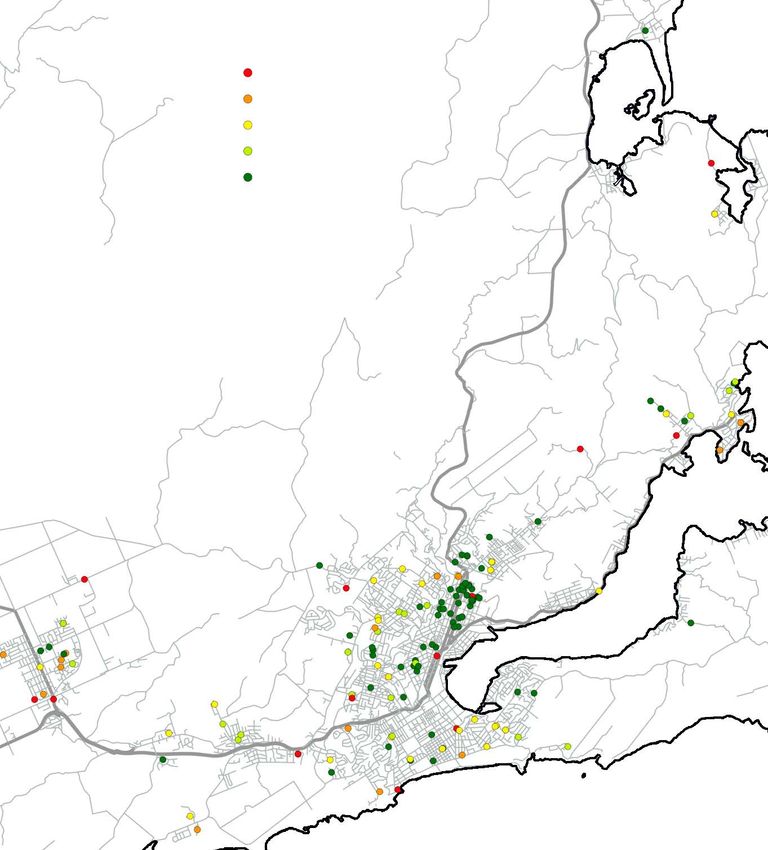
levels. The personal adaptability for participants is calculated and plotted on a map of the town at their
location of residence to illustrate the relationship between adaptability and urban form.
1.4 Structure of this report
Chapter 2 of this report describes the literature available on voluntary behaviour change and adaptation of
travel behaviour. The literature review focuses on existing work around personal travel adaptive capacity,
essentiality of travel activities and previous studies of fuel shocks. This section reviews the background
and literature in the areas of future fuel supply issues, behaviour change during fuel shocks, and progress
in surveying and modelling travel behaviour change. The literature is rather thin in this area. The
background includes a discussion of the Travel Sim virtual reality survey and the calibration of the web-
based TACA survey using previous results from the sim game surveys at UoC.
Chapter 3 describes the TACA survey and the survey methods used in the three target centres. The section
also gives analysis to validate the survey including comparisons with existing statistics. The database
structure is described and the database dictionary provided.
13Travel adaptive capacity assessment for particular geographic, demographic and activity cohorts
Chapter 4 presents the data collected from the surveys. Graphs of the travel demand patterns and
adaptations are presented for each of the centres and for different groups in the survey. The essentiality
data is also presented.
Chapter 5 presents a method to calculate personal adaptability. A computer program was developed to
calculate the personal adaptability of participants, geocode their personal residence and produce maps
using a geographic information system. Finally, the adaptive potential for mode change is examined.
Chapter 6 provides a summary, discussion and suggestions for future work. In this section of the report,
we also discuss the policy implications of the findings regarding allocation of resources for the safety,
resilience and sustainability of the transport network.
142 Literature review and background
2 Literature review and background
2.1 Transport fuel supply issues
2.1.1 Context
Energy researchers have been analysing future oil supply for the past 40 years. Peak oil – the inflection
point between increasing and decreasing world oil production – has been discussed since the 1970s when
oil production peaked in the United States of America (USA) and the Organisation of Petroleum Exporting
Countries oil embargo caused widespread transport disruption and economic recession. The timing of
peak oil from expert analysts ranges from 2006 to after 2025 (Campbell and Laherrere 1998; Davis 2003;
Deffeyes 2003; World Energy Council 2003; Bakhtiari 2004; Skrebowski 2004; Hirsch et al 2005). All of the
expert analysts agree that the production rate of conventional oil will be in permanent decline within 10
years. This is a short timeframe for transportation planning and urban development.
New Zealand is dependent on imported fossil fuels. Around 50–60% of the crude oil and feedstock
processed by the New Zealand Refining Company is imported from the Middle East to combine with 30–
40% from the Far East/Northern Australia and indigenous production (Colegrave et al 2004). Imported oil
accounted for approximately 41.4% (321.59PJ) of total primary energy supplied (776.6PJ) in New Zealand
in 2009 (Ministry of Economic Development (MED) 2010a). The MED reported that the net oil import
dependency of New Zealand in 2009 was 63%. It increased from 2008 because of a drop in domestic oil
production (MED 2010b). The domestic oil consumption by the transport sector has increased at an
average annual rate of 0.3% between 2005 and 2009. A recent New Zealand parliamentary report
forecasted that oil shocks will be likely because oil supply will not increase in the next five years while
demand will continue to rise (Smith 2010).
2.1.2 Alternatives do not mitigate fuel supply issues
Peak oil will cause significant travel behaviour change (Campbell 2003). The world oil supply outlook
indicates that high prices will continue and thus put pressure on personal transport, as will carbon
emission pricing and increasing media coverage of oil supply issues (International Energy Agency (IEA)
2010). The IEA points out that resources of unconventional oil are possibly several times larger than
conventional resources. However, Canadian oil sands, coal-to-liquids, Venezuelan extra-heavy oil and gas-
to-liquids are all significantly more capital intensive and more environmentally damaging, and have higher
emissions per unit of consumer energy delivered than conventional oil. The IEA also notes that carbon
capture and storage, as well as other new improved water and land management technologies, would be
needed to make unconventional oil acceptable. However, carbon capture and storage technology is not
viable and coal-to-liquids are likely to be very expensive (Page et al 2009).
Hirsch et al (2005) was one of the first government-sanctioned reports to state definitively that a sizeable
gap exists between projected future fuel demand and known or alternative fuel supply. Alternative fuels
and electric vehicles are not available, or ready to bring into the market at prices and in the quantities that
will replace declining oil production (Barker 2010). The United States Joint Forces Command (2010) has
identified oil supply as one of the 10 major security issues for the next quarter century, stating: ‘By 2012,
surplus oil production capacity could entirely disappear, and as early as 2015, the shortfall in output could
reach nearly 10 [thousand barrels per day]’. This Joint Operating Environment report also expects that
biofuels will not supply more than 1% of global liquid transport fuel demand, and wind and solar energy
will supply less than 1% of global energy supply by 2030. Hydrogen is not a feasible transport fuel and the
technologies to use it are not available (Page et al 2009).
15Travel adaptive capacity assessment for particular geographic, demographic and activity cohorts
Automobiles that are much more efficient than the current average fleet fuel consumption of over 10 litres
per 100km are currently available in the market in New Zealand and are usually priced lower than the
larger, less efficient vehicles. Reducing fuel demand through more efficient vehicles is currently an
available travel behaviour adaptation that requires a capital investment, but results in fuel cost savings
(MED 2010c). Through simple depreciation and fuel savings calculations, urban travellers can determine
whether purchasing a more fuel-efficient vehicle will reduce their costs. In general, if the current vehicle
has poor efficiency and the driving distances are large, then cost savings can be realised.
Urban travellers can effectively control their transport costs by choosing a residential location with active
mode access to shopping and services, and a short distance or low-cost public transport link to the work
location (Handy et al 2005). The decision to reduce fuel costs or increase walking or biking activity can be
hampered by the availability of affordable residential locations and by urban form. Where such residential
locations exist, they are usually in high demand.
The probability of fuel shortage events and price shocks are likely to increase as oil supplies tighten.
According to economic utility theory, the lowest cost choice for urban travellers to reduce fuel costs is
travel behaviour change (Oppenheim 1995). Transportation planners need information on how people will
carry out their activities when they choose to reduce fuel use or not to use their car. Urban planners and
land use planners will need to understand the long-range trends in personal urban travel in their city in
order to accurately model future travel demand and inform investments in infrastructure and urban
development. This literature review investigates this critical issue of travel behaviour adaptability in
relation to fuel shocks and pressure from the long-term fuel supply contracting. The probability of fuel
shortages and price shocks are likely to increase as oil supplies tighten (Chatterjee and Gordon 2006).
2.2 Travel behaviour adaptation
2.2.1 Causes of shocks
Transportation infrastructure currently supports fossil fuel-based technologies nearly exclusively.
Individual private vehicle transport is the most energy-intensive mode of transport in urban settings.
Systematic investigation of travel mode choice in response to fuel issues is rare because of the
unpredictability and rarity of fuel supply disruption events. Fuel-conserving travel behaviour adaptation
can be studied by looking at historical oil shocks. This section reviews the literature around the 1970s oil
shocks and the more recent 2000 United Kingdom (UK) tax revolt fuel shortage.
A fuel shock can arise from any number of events causing a price spike, a fuel shortage or government
action to curb consumption. Clearly, the doubling of the price at the pump in New Zealand over the 2007–
2008 timeframe would constitute a fuel price spike. A fuel crisis refers to a supply shortage experienced
by end users. Again, the perception of a fuel crisis can be heightened by media coverage. Government
action to curb consumption could be in response to high prices or IEA international agreement.
Government actions can include relatively innocuous measures like lowering the speed limit or giving
incentives for public transport, but may also include restrictions on vehicle use or fuel rationing. A fuel
shock may cause temporary as well as long-term effects on personal travel behaviour.
The price elasticity of travel demand and fuel use has been found to be relatively consistent over many
studies through the 1990–2004 timeframe. For a 10% fuel price rise, the volume of fuel consumed will fall
by about 2.5% within a year and continue to fall to 6% in the longer run (Goodwin et al 2004). This typical
price elasticity can be expected for a situation like a gas tax increase but does not include the effect of
fuel shortages. The fuel price spike of 2007–2008 was followed by fuel demand contraction of 2% in 2009
(British Petroleum 2010). It is highly likely that the transport fuel supplies available to end users will
162 Literature review and background
contract steadily, if not precipitously, for any planning horizon considered (Krumdieck et al 2010). This
continuous contraction will be experienced as periodic fuel price and economic shocks (Rubin 2009). How
will travel behaviour and travel demand change as price and supply security issues continue to apply
pressure on end users? An obvious place to look for answers is research into previous oil shocks.
2.2.2 Fuel supply issues and travel behaviour change
2.2.2.1 Recent New Zealand experience
Retail petrol prices in New Zealand rose sharply in 2000–2001 and then continued rising steadily from
2005. Historically, traffic volumes and vehicle kilometres travelled (VKT) in New Zealand have responded
consistently to price increases. Urban travellers have responded quickly to fuel price rises, with a
statistically significant reduction in petrol consumption occurring within a year. In a study of the past fuel
price rises by Kennedy and Wallis (2007), a petrol price increase of 1% caused at least a 0.15% reduction in
petrol consumption and 0.3% reduction in car and van traffic on state highways. The 2001 and 2005 price
rises were not accompanied by supply shortages at the pumps, or by news about shortages elsewhere in
the world.
2.2.2.2 Experience of the 1970s fuel shocks
The 1970s oil shocks involved both price rises and issues with supply security. In 1973, the Arab oil
embargo dramatically affected transport fuel supply in the USA and allied nations. Earlier, natural gas
shortages had led to increased demand for oil for power generation, increased car ownership had led to
increased petrol demand, increased freight movement had led to increased demand for diesel, and the oil
production in the USA had already peaked and was declining, despite development of the new massive
Alaskan resources (Franssen 1980). In response to the embargo, in 1974, the US government developed,
for the first time, an energy policy called ‘Project Independence’, which aimed to have the country
independent of foreign oil imports by 1980.
The fuel shocks of the 1970s provide historic examples of how events gave rise to pressures on fuel
demand (Peskin 1980). Research on the response of urban travellers to the oil shocks in the USA gives the
following observations, which appear to be consistent across the country and over time:
• Accessibility to fuel is a much stronger driver for conservation behaviour than price increase.
Travellers were more likely to decide to conserve fuel if gas stations were out of gas, when long lines
at filling stations were portrayed in the media or when fuel purchase limits were imposed (Peskin et al
1975; Skinner 1975; Sacco and Hajj 1976).
• Both high-income and low-income urban travellers changed to more energy-efficient travel
modes during the fuel shock. However, low-income households that changed were more likely to
remain changed after the crisis ended (Becker et al 1975; Sterns 1975).
• The journey to work was the least flexible trip. Shopping trips were changed or reduced long
before any car pooling or mode change was made to the work trip as the fuel crisis deepened. Holiday
and recreation travel would be curtailed before the work trip would be altered. Only in areas with very
good public transportation systems were changes to work trip mode observed (Hartgen 1975; Lessieu
and Karvasarsky 1975; Peskin et al 1975; Corsi and Harvey 1979; Hartgen 1979).
• Trip chaining of non-work trips was a common adaptation, particularly for shopping trips (Peskin
et al 1975; Kostyniuk and Recker 1977).
• Walking or biking was one of the first changes observed during the gasoline shortage, depending
on automobile availability, prior use of the alternative mode, and employment status and income; and
17Travel adaptive capacity assessment for particular geographic, demographic and activity cohorts
was seen as a relatively easy way to conserve energy (Hartgen 1975; Opinion Research Corporation
1976; Neveu 1977).
• Driving at a reduced speed was one of the most common adaptations to reduce fuel
consumption. Researchers found that the public preferred easily taken personal actions over
restrictive government actions or punitive measures like increased gas taxes (Neveu 1977; Hargten
1979).
• Public transport use was found to surge during the energy crisis. However, numerous researchers
found considerable reluctance to change mode to public transportation as a first choice. Automobile
use was usually modified first (eg driving slower, tuning up the car) and public transport was taken up
as a last resort (Keck 1974; Peskin et al 1975; Sterns 1975; Sacco and Hajj 1976).
• Car-pooling was not found to be an action taken in response to either fuel price rises or fuel
shortages. The only study that found an increase in vehicle occupancy was among people who also
purchased high-efficiency, smaller automobiles, indicating that energy conserving individuals were the
only group willing to share an automobile ride (Trentacost and Milic 1974; Beglinger and Behnam
1975; Peskin et al 1975; Hartgen 1979).
• Urban travellers adapt to use less fuel through consistently adjusting small, unobtrusive and
frequently taken actions. The public is receptive to policy actions that encourage fuel savings by
increasing travel options and offering incentives for their use (Rappaport and Labaw 1975; Meyers
1979; Hartgen 1979).
Lessons learned from the 1970s fuel shock are still important for urban planners and policymakers where
the main focus of transport planning is in the trip to work. The fact that all research from the 1970s
shows that the journey to work was the least adaptable is important when considering investment in
commuter infrastructure. People shifted mode to public transport, but only where well-established services
were present and where the travellers had some previous experience with the system, such as in New York
City. It should be noted that many cities in the USA were not well served with public transport systems,
which may account for the observed unwillingness to change mode for an important work trip. The
willingness to reduce speed may not be as applicable to New Zealand because our urban areas do not
have the same number of kilometres of high-speed freeways as US cities. Travellers were willing to change
to walking and biking, but only where these modes were possible. Again, in an urban area like New York
City, walking access is possible, whereas in a sprawling western city like Los Angeles, the distances are
too great for active modes.
Reducing the number of parking places at work destinations was thought to be a way to put pressure for
change on the work trip, but no parking restriction measures were put in place during the energy crisis.
The researchers in 1980 noted a need for further research to develop analytical tools to do long-range
planning under energy constraints, and for modelling land use and energy relations (Peskin 1980).
2.2.2.3 The 2000 UK fuel crisis
Contingency planning for fuel shortages and fuel price shocks gained substantial attention in the early
1980s, but recent fuel shortages induced by natural disasters or civil unrest have proven that the
transport activity system has little or no resilience. Recent fuel shortages, particularly during the fuel tax
protest in the UK in 2000, provide a case study for an unexpected fuel crisis and the resulting travel
behaviour change. Widespread protests against high petrol and diesel prices had taken place in several
European countries, including the UK, in the first half of the year 2000. The world oil price had risen
rapidly to the record level of $35 a barrel and the 91 unleaded price in the UK was over 80p/L. Fuel taxes
in the UK had put even more pressure on the consumer price, as they had recently increased to 81.5% of
182 Literature review and background
the total cost of unleaded petrol. This caused the fuel prices in the UK, which were previously amongst the
lowest in Europe, to become the most expensive in a short period (Hammar et al 2004). (For reference, the
price of 95 octane petrol in the UK at the time of writing was 122–144p/L (Whatprice 2009).)
On 7 September 2000, about 100 farmers and lorry drivers from Wales and northwest England set up a
blockade of the Stanlow Shell oil refinery. The next day, a further 100 bus drivers blockaded the Texaco
refinery in Pembroke. By 10 September, motorists started to stockpile fuel, causing a run on petrol
stations. Media coverage of lines of anxious motorists at petrol stations sparked further panic buying.
Petrol stations began rationing fuel sales by limiting purchases to £5. It is estimated that by 13
September, more than 90% of petrol stations had run out of fuel (Chatterjee and Lyons 2002). Eight days
after the initial fuel disruption, the protesters called off the blockade and fuel supplies returned to normal
during the following week.
The temporary fuel shortage caused car users to change their travel behaviour. This resulted in a
significant reduction in car traffic of, on average, 39% on motorways, 25% on major roads and 16% on
minor roads, as measured on 14 September 2000 at 135 sites throughout the UK (Polak et al 2001). The
number of public transport users increased markedly, but the government reduced bus services as fuel
supplies ran low. The year 2000 marked a turnaround in the continuous trend of decreasing bus ridership
in the UK (Department for Transport 2010).
Chatterjee and Lyons (2002) surveyed car users 34 days after the 2000 fuel crisis in five areas of England:
Hampshire/Wiltshire, West Yorkshire, the London boroughs of Hillingdon, Leicester and Hertford. Ten
thousand mail-back questionnaires were distributed with a 16% response rate. The results showed that
12% of 1065 car users reduced their trips to or from work, and 16% reduced their business trips. A further
14% changed their destination for grocery shopping trips. Respondents reported shifting 12% of work trips
to other modes. Walking was the most popular mode shift choice for school travel (21%). The reduction of
work trips seems to contrast with the travel behaviour seen during the 1970s oil shock. The availability of
access to computers and the internet in the home may have facilitated the reduction of work trips in 2000,
but this is speculation, as the questions were not asked in the survey.
The travel behaviour change observed during both the Organisation of Petroleum Exporting Countries
embargo and the UK tax revolt fuel crises included mode shifting, reducing travel distance, reducing
unnecessary trips made by car and changing destination (Habermann 1980; Chatterjee and Lyons 2002).
Previous studies showed that it is not easy for car commuters to adapt without feasible public transport
services. For example, in a survey conducted in the UK, over 50% of 563 respondents who normally drove
to work, school or college declared that they had difficulties in using another mode. In addition, 15%
stated that they did not go to work during the UK 2000 fuel crisis (Thorpe et al 2002).
2.2.3 Travel behaviour change surveys
2.2.3.1 Limitations of predicting actual change
Investigating adaptation behaviour in travel demand research is a recent topic and mostly concentrates on
activity scheduling adaptation processes which may not be related to fuel shortage or even a price rise
(Roorda and Andre 2007). Few of the conventional travel surveys that are regularly conducted by the
government include an adaptability measurement, as the survey aim is to capture current travel behaviour
only (de Dios Ortuzar and Willumsen 2001). The best way of modelling travel behaviour change when a
fuel shock occurs is not known as yet. It is also not known whether behaviour change during an actual fuel
supply disruption would give an indication of future trends in response to long-term price or supply
pressure. Several factors are in play during a short-term fuel supply crisis that would not be present over a
longer period of gradual fuel price increases. For example, panic buying and fuel purchase quantity limits
19You can also read