Technology and Supply Chains for Critical Industries Agriculture sector (Working paper 2 of 3)
←
→
Page content transcription
If your browser does not render page correctly, please read the page content below
www.pwc.com.au

                       Technology and
                       Supply Chains for
                       Critical Industries
                       Agriculture sector
                       (Working paper 2 of 3)

Department of
Infrastructure and
Regional Development

Agriculture sector

October 2017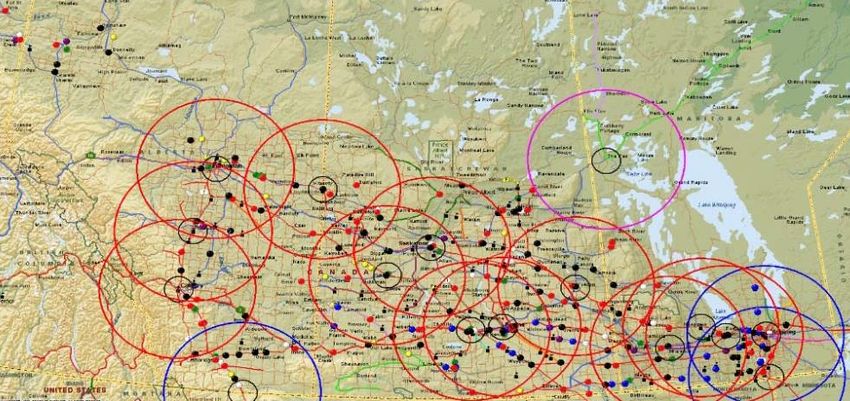
Disclaimer
This report is not intended to be read or used by anyone other than the Department of Infrastructure
and Regional Development (the Department).
We prepared this report solely for the Department’s use and benefit in accordance with and for the
purpose set out in our engagement letter with the Department dated 6 October 2017 and section 1 of
the report. In doing so, we acted exclusively for the Department and considered no-one else’s interests.
We accept no responsibility, duty or liability:
to anyone other than the Department in connection with this report
to the Department for the consequences of using or relying on it for a purpose other than that
referred to above.
We make no representation concerning the appropriateness of this report for anyone other than the
Department. If anyone other than the Department chooses to use or rely on it they do so at their own
risk.
This disclaimer applies:
to the maximum extent permitted by law and, without limitation, to liability arising in negligence or
under statute; and
even if we consent to anyone other than the Department receiving or using this report.
Liability limited by a scheme approved under Professional Standards legislation.
Department of Infrastructure and Regional Development
PwC i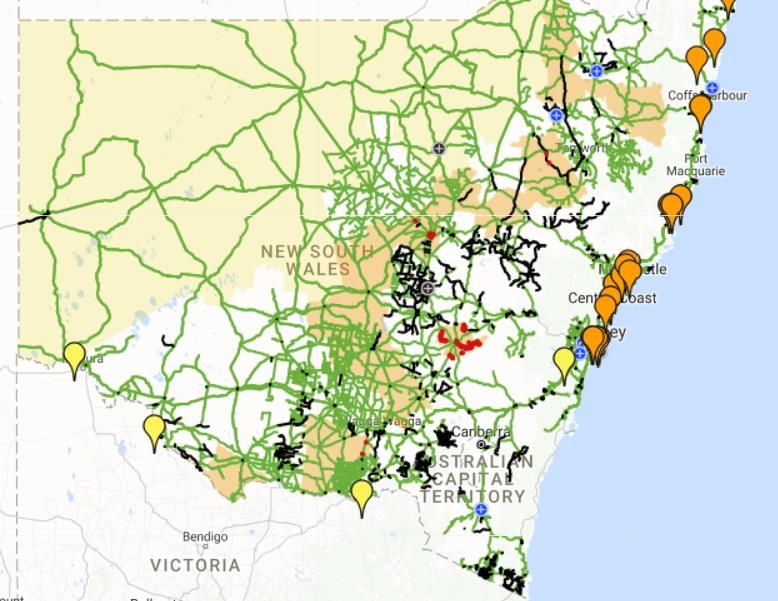
Executive summary PricewaterhouseCoopers Consulting (Australia) Pty Limited and Ranbury Pty Ltd (Ranbury) have analysed the agriculture sector supply chain on behalf of the Department of Infrastructure and Regional Development (the Department) as part of the Inquiry into National Freight and Supply Chain Priorities (the Inquiry). This report analyses three key commodities in the agriculture sector – grain, cotton and livestock. The study analyses at a high level: the infrastructure underpinning the typical supply chains for each industry; supply chain costs; user needs and bottlenecks impacting the supply chain; and technology, innovation and changing business practices impacting supply chains in the future, particularly in relation to infrastructure, service requirements and cost. The agriculture sector Grain Australia’s, grain and oil seed industry, with average production of 45 million metric tonnes (MMT) each year. Western Australia and NSW are responsible for the bulk of production; roughly 25 MMT. Grain is farmed by local, family run operations and is mostly exported overseas to countries such as China, Indonesia and Japan. Cotton Australia produced 626.2 kilotonnes of cotton lint and 885.5 kilotonnes of cottonseed, which can be processed into oils and meal, in 2016. There are around 1,250 cotton farms in Australia, with approximately 60 per cent of production occurring in the inland regions of New South Wales and 40 per cent in southern Queensland. Although Australia produces only 3 per cent of the world’s cotton, Australia is the fourth largest exporter of cotton, behind China, India and the United States. Livestock Australia produced 3.6 million cattle and sheep as livestock in 2015. Almost 68 per cent of the 115,000 farms in Australia are involved in livestock production, with beef cattle farms the most common followed by chicken, sheep and goat farms. Sheep production tends to occur in the southern states, beef production occurs in every state and territory, and the more intensive livestock industries such as pork, dairy and poultry are concentrated in regions that are either proximate to major metropolitan areas or the coastline. Supply Chains Agriculture is predominantly a bulk freight task. The supply chain includes intermediate links ie. storage sites or intermediate processing. The distributed nature of farms nationwide means that road transportation is heavily relied on. Rail is relied on where possible as it is more cost efficient than road, however, the use of rail is challenged by the fragmented nature of production. Most of the agriculture supply chains are export-oriented, ie farm to port to ship. Supply chain costs Supply chain costs are driven by mode, the standard of infrastructure used and the crop/commodity being transported. It is difficult to compare the supply chain costs for each commodity due to the differences in measurement. For example, the cost per kilometre for Department of Infrastructure and Regional Development PwC i
Executive summary
transporting livestock on rail is measured in dollar per kilometre per deck, whereas the
equivalent cost for grain is measured in dollars per tonne per kilometre. Publically available
information on supply chain costs is generally limited due to their commercially sensitive
nature.
Supply chain user needs and bottlenecks
Current supply chains have evolved in response to the specific issues driven by the user
needs of participants and stakeholders in each agriculture sector. User needs for the various
agricultural supply chains can be categorised into the following four categories:
cost - the additional complexity of Australia’s export supply chain results in transport
costs being a larger component of total cost of production in the agriculture sector than it
is for many international competitors. Therefore supply chain efficiency in the
agricultural supply chain – and particularly cost minimisation – is a critical element of
the overall global competiveness for Australia’s agricultural sector;
reliability - reliability is an important consideration for users and is driven by a need:
– to achieve the required paddock to customer timelines to take advantage of key
marketing windows;
– to ensure that additional storage costs and penalties are not incurred through missing
shipping or port windows;
– for supply chains to respond to the variability of production volumes – particularly
during peak demand periods and bumper yield seasons; and
– to provide adequate service frequencies and minimising unscheduled service
disruption and associated recovery time
capacity - All users seek network capacity that is fit for the freight task undertaken in the
individual supply chain; and
control - cost competiveness, responsiveness and flexibility can be achieved though
supply chain control.
There are three key types of bottlenecks that occur in agricultural sector supply chains. These
are:
capacity – this includes inadequate road network standards, road network congestion,
lack of rail network coverage, variable network quality, the need to share sections of the
rail network with other users and limited above rail competition.
regulatory - the efficiency of these supply chains is impacted by road network
management, performance based standards systems which permit the deployment of high
productivity vehicles and a the approach to regulation of rail assets.
approvals – a lack of regional oversight in the approvals process could result in excessive
infrastructure investment which results in low volumes to the point that some or all
investments become unviable.
The impact of technology on the supply chain
In response to supply chain efficiency bottlenecks, agriculture companies have continued to
focus on improving productivity and reducing costs through the use of new technologies.
New technologies, which have been implemented or are currently being considered within
the agriculture sector globally, include:
technology that can track and trace agricultural products along the supply chain;
Department of Infrastructure and Regional Development
PwC ii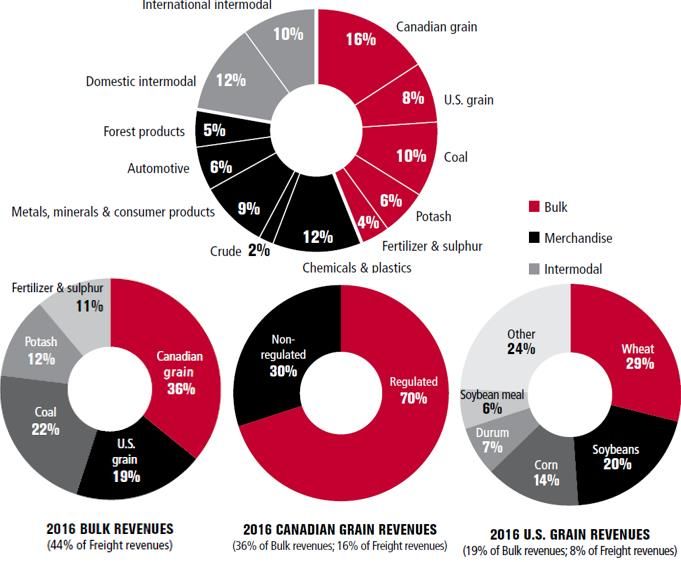
Executive summary robotics for the automation of the supply chain; and data driven software and devices designed to optimise the movement of agricultural cargo. Department of Infrastructure and Regional Development PwC iii
Contents

Disclaimer                                               i

Executive summary                                        i

Contents                                                 i

1     Introduction                                       2

2     Grain                                              5

3     Cotton                                            21

4     Livestock                                         29

5     Technology and innovation                         37

6     User needs                                        47

7     Bottlenecks                                       50

Appendix A Riverina Case Study                          57

Appendix B Western Canadian Grain Export Supply Chain   57

Department of Infrastructure and Regional Development
PwC                                                      i
Agriculture sector 1 Introduction PricewaterhouseCoopers Consulting (Australia) Pty Limited and Ranbury Pty Ltd (Ranbury) have analysed the agricultural sector supply chain on behalf of the Department of Infrastructure and Regional Development (the Department) as part of the Inquiry into National Freight and Supply Chain Priorities (the Inquiry). This work is intended to assist the Inquiry in informing the forthcoming National Freight and Supply Chain Strategy to ensure: the cost of freighting Australia’s agricultural and resource commodities and general freight to destination markets does not undermine the global competiveness of these industry sectors; and the cost of freighting imported goods domestically does not result in increased costs to Australians and ultimately undermine our standard of living. 1.1 Study objective This study is an input to the Inquiry process and is intended to identify, at a high level, critical issues in supply chains for the agriculture sector. The study analyses: the infrastructure underpinning typical supply chains for each industry; supply chain costs; user needs and bottlenecks impacting the supply chain; and technology, innovation and changing business practices impacting supply chains in the future, particularly in relation to infrastructure, service requirements and cost. Data in this study is drawn from the following sources: ABARES (2016), Annual commodity statistics: cotton ABARES (2016), Annual commodity statistics: meat - general ACCC (2016), Issues paper: Cattle and beef markets; Australian Export Grains Innovation Centre (2014), The cost of Australia’s bulk grain export supply chains: An information paper; Australian Livestock Exporters Council (2014), Submission by the Australian Livestock Exporters’ Council to the Green Paper on Developing Northern Australia; BITRE (2016), Why short haul intermodal rail services succeed; Commonwealth of Australia (2015), Agricultural competitiveness white paper; CSIRO (2013), Livestock Industry Logistics: Optimising Industry Capital Investment and Operations; DIRD (2009), Independent Review of the Grain Infrastructure Group’s Freight Network Review; Department of Infrastructure and Regional Development PwC 2
Introduction GrainCorp (2014), Victorian Port Terminals: Exemption from Port Terminal Access (Bulk Wheat) Regulation; GrainGrowers (2016), State of the Australian Grain Industry; International Trade Centre (2007), Cotton Exporter’s Guide; Meat and Livestock Australia (2016), Fast Facts: Australia’s beef industry; Meat and Livestock Australia (2016), Fast Facts: Australia’s sheep industry; Meat and Livestock Australia (2016), Fast Facts: Australia’s goat meat industry; Productivity Commission (2016), Inquiry Report: Regulation of Australian Agriculture; QTLC (2013), Supply Chain Perspectives: Cotton; Submissions to the National Freight Inquiry; various industry body websites; and stakeholder consultation with John Holland as the operator of the Country Regional Network in NSW – other organisations, including producers, were contacted but were not available for consultation. 1.2 Commodities analysed in this study This working paper analyses three key agriculture commodities including: grain; cotton; and livestock. 1.3 Report Structure Following this introduction, the report is structured as follows: Section 2: Grain This section provides a high level summary of the freight task and a description of key grain supply chains including a description of predominant transport mode, participants, infrastructure capacity, supply chain costs and relevant regulatory regimes. Section 3: Cotton This section provides a high level summary of the freight task and a description of the NSW and QLD cotton supply chains. Section 4: Livestock This section provides a high level summary of the freight task and a description of the livestock (national) supply chain. Section 5: Technology and innovation This section provides a summary of the key technological advances in the supply chain and the impact of these changes. Section 6: User needs This section provides an analysis of the user needs for each supply chain. Department of Infrastructure and Regional Development PwC 3
Agriculture sector

Section 7: Bottlenecks
This section provides an analysis of bottlenecks in the supply chains.

Department of Infrastructure and Regional Development
PwC                                                                      4
Grain

2 Grain
2.1           Freight Task
2.1.1         Production regions and volumes
Australia produced an average of 45 million tonnes of grain and oilseed per annum between
2010 and 2015.1 This includes wheat, barley, oats, triticale, lupins, field peas, canola, faba
beans and chickpeas. Grain production accounts for more than a quarter of the value of
Australian agricultural production. Western Australia and NSW account for the majority of
grain production as shown in Table 1 below.

Table 1: Grain production estimates by jurisdiction (2015)

    NSW                 Vic             QLD                 SA                 WA      Tas

    12 mt               6 mt            3 mt                7 mt               13 mt   0.1 mt
Source: ABARES (2016), includes wheat, coarse grains (ex rice), oilseeds and pulses

Grain production is seasonal and generally occurs along the eastern seaboards and through
southern Australia (central and western) as shown in Figure 1 and described in Table 2
below.

1    Grain Growers Limited (2016)

Department of Infrastructure and Regional Development
PwC                                                                                              5
Agriculture sector
Figure 1: Grain production regions
Source: GrainGrowers (2016), State of the Australian Grain Industry 2016
Table 2: Grain grown in agro ecological zones
Agro ecological Season Dominant crops grown
zone
Wheat, barley, oats, triticale, lupins, field peas, canola, faba beans,
A WA Northern Winter
chickpeas
Wheat, barley, oats, triticale, cereal rye, lupins, field peas, canola,
B WA central Winter
faba beans, chickpeas
Wheat, barley, oats, triticale, lupins, field peas, canola, faba beans,
C WA eastern Winter
chickpeas
WA Sandplain and Wheat, barley, oats, triticale, lupins, field peas, canola, faba beans,
D Winter
Mallee chickpeas
SA Mid-north – Wheat, barley, oats, triticale, lupins, field peas, canola, chickpeas,
E Winter
Lower Yorke, Eyre faba beans, vetch, safflower
Wheat, barley, oats, triticale, cereal rye, lupins, vetch, canola, field
F SA - Victoria Mallee Winter
peas, chickpeas, faba beans, safflower
SA - Victoria Border Wheat, barley, oats, triticale, lupins, field peas, canola, chickpeas,
G Winter
–Wimmera faba beans, vetch, lentils, safflower
Victoria High
H Winter Wheat, barley, oats, triticale, lupins, field peas, canola
Rainfall
Department of Infrastructure and Regional Development
PwC 6Grain
NSW - Victoria Wheat, barley, oats, triticale, lupins, field peas, canola
I Winter
Slopes
Wheat, barley, oats, chickpeas, triticale, faba beans, lupins, field
Winter
J NSW Central peas, canola, safflower
Summer Sorghum, sunflowers, maize, mung beans, soybeans, cotton
NSW North West – Winter Wheat, barley, oats, chickpeas, triticale, faba beans
K
Qld South West Summer Sorghum, sunflowers, maize, mung beans, soybeans, cotton
Wheat, barley, oats, chickpeas, triticale, faba beans, millet/panicum,
Winter
NSW North East – safflower, linseed
L
Qld South East Sorghum, sunflowers, maize, mung beans, soybeans, peanuts,
Summer
cotton
Winter Wheat, barley, oats, chickpeas
M Qld Central
Summer Sorghum, sunflowers, maize, mung beans, soybeans, cotton
N Tasmania Winter Wheat, barley, oats, triticale, lupins, field peas, canola
Source: Grain Growers Limited (2016)
2.1.2 Nature of freight task
Export based commodity
Grain is an export based commodity with approximately 65 per cent of production exported.
Grain accounted for approximately 35 per cent of Australian agricultural exports between
2010 and 2015.2
The grain freight task in WA and SA is export oriented with approximately 85-95 per cent of
production destined for international markets. The freight task for east coast grain is more
domestic oriented in comparison with approximately 50 per cent of production consumed
domestically.
Inconsistency of freight task
The grain freight task is inconsistent within a year and also across years as a result of:
seasonal production, as shown in Table 2 above;
variation in volumes driven by weather conditions such as drought; and
fluctuations in demand driven by global grain prices.
The supply chain has therefore built in significant storage capacity to cater for peak demand.
Trend towards containerisation
Grain products have traditionally been transported as bulk commodities, however,
containerisation is emerging as a preferred freight type for grain. It is estimated that between
12 and 15 per cent of Australia’s grain exports to Asia are now shipped in containers. The
shift towards containerisation has been driven by:
the degradation in legacy bulk transport infrastructure which results in reduced payloads,
lost efficiency and increased cost;
2 Grain Growers Limited (2016)
Department of Infrastructure and Regional Development
PwC 7Agriculture sector
the increased flexibility afforded by containerisation/intermodal transportation – the
inconsistent nature of the grain freight task means infrastructure designed for
containerised grain can be used for other goods in low seasons which reduces the average
cost;
demand for smaller quantities of grain from key Asian markets – containerised grain
allows end users to purchase and transport smaller quantities;
cost efficiencies arising from the ability to re-hire empty containers commensurate to
volume, as opposed to the potential trading of bulk infrastructure assets in low
production seasons; and
increased demand for higher grades of grain which require containerised transportation
2.1.3 Market Structure
This grain market is currently undergoing transition from the traditional model, which is
characterised by large bulk handlers, to an emerging model which relies on smaller on-farm
storage.
Traditional model – bulk handling
The traditional model is characterised by a small number of large grain handlers buying,
processing, transporting and selling grains produced by farmers. This model emerged as a
result of regulation of the grain market after the great depression and allowed for the
development of large scale supply chain infrastructure (handling facilities, rail) which was
not viable for individual producers to develop. The dominant bulk handlers currently
include:
Cooperative Bulk Handling (CBH) in WA;
Viterra (Glencore Agricultural) in SA; and
GrainCorp in eastern Australia.
These companies own integrated supply chains, including storage sites, rolling stock, ports,
and exporting and marketing businesses. While the bulk handling market participation is
consolidated, there is intense competition between handlers in export markets, with 50 – 70
per cent of grain exported by up to 23 marketers in any season.
The volumes handled by the bulk handlers and their market shares in the jurisdictions where
they operate are provided in Table 3 below.
Table 3: Volumes handled by the dominant bulk handlers
CBH (WA) Viterra (SA) GrainCorp
(QLD, NSW,
Vic)
Average annual harvest (MMT) 10.2 6.0 20.0
Approximate domestic consumption (MMT) 1 1.2 9.5
% of harvest exported 92 90 50
Market share – up-country ~90% WA’s 80% market Handles ~ 75%
grain share of SA up- of east coast
country grain grain
storage
Source: Australian Export Grains Innovation Centre (2014)
Department of Infrastructure and Regional Development
PwC 8Grain Emerging model – on-farm storage On-farm storage capacity has grown significantly in recent years and is now estimated to be in excess of 15 million tonnes.3 The increased reliance on-farm storage model has been driven by: government tax incentives – these incentives have made farm storage infrastructure more affordable; the producer’s desire for increased control of supply and ability to adjust to seasonal variability and market prices – on-farm storage allows individual producers to store supply from bumper harvests and sell them when prices increase; and the need for a model which is more suited to the domestic grain task by road – on-farm storage better supports direct delivery of grains to end users. 2.1.4 Key corridors Export Key export markets include Indonesia, China, Vietnam, Japan, Vietnam, South Korea and Malaysia. The key export corridors in the sector include: Eyre Peninsula grain exported via Thevenard, Port Lincoln, Wallaroo, Port Giles and Port Adelaide (including the Inner and Outer Harbour terminals); NSW grain exported via Port Kembla and the Port of Newcastle; QLD grain exported via Mackay, Gladstone and Brisbane; and WA grain exported via Geraldton, Kwinana, Bunbury, Albany and Esperance. Domestic The domestic grain task can be described as a distributed system (as opposed to point to point) where grain can be transported from any origin to any domestic end user. Under the emerging on farm storage model, the domestic grain corridor involves the transportation of grain from farms to feedlots and mills. While demand is nationwide, the domestic market is predominantly supplied by grain from the east coast (QLD, NSW and Vic). 2.2 Supply chains – General 2.2.1 Process Grain is transported from the farm to bins via road. From the bin, grain that is transported as bulk freight is loaded on bulk grain trailers and transported to port for export markets or alternatively distributed to domestic markets. Grain is also transported in bulk from bins at receival sites via rail grain hoppers to port for export markets. Small amounts of gain are transported as bulk rail freight to domestic markets in NSW (e.g. Allied Mills Manildra). Containerised grain is transported from bins to intermodal containerisation facilities. From the intermodal terminal, containerised grain is transported via rail wagons to container grain handling terminals. The grain is unloaded from the wagons and stored before being loaded onto container vessels for export. 3 Australian Export Grains Innovation Centre (2014) Department of Infrastructure and Regional Development PwC 9
Agriculture sector

A schematic representation of the grain supply chain is shown in Figure 2 below.

Figure 2: General grain supply chain

                                                                            Farm

                                                Load to bulk
                                                                           Bin
                                                grain trailer
                       Key
                                                                                              Containerisation
                       Road
                                                                                                  facility
                       Rail                                        Bin to rail grain
                                                                    hopper (bulk)

                                                                                                 Terminal

                                                                                              Load to rail wagon
                                                        NSW only
                                                     (small volumes)
                                                                                                 Terminal

                                Domestic                Domestic
        Port                  consumption              consumption                     Port        Port
                              (feedlot, mill)             (mill)

Source: PwC analysis

2.3            Supply Chains – Eyre Peninsula (SA)
2.3.1 Mode(s)
The Eyre Peninsula grain supply chain is predominantly an export based supply chain. It
consists of road and rail based supply chains. The transportation of grain from farms to bulk
handling sites relies almost entirely on road transportation. Grain volumes transported on
the leg between bin and port are split almost evenly between road and rail.4

Approximately 5.5 million tonnes of grain is exported annually as bulk dry cargoes compared
to 300,000 tonnes in containerised form.5

2.3.2 Participants & operation
The key positions and participants in the Eyre Peninsula grain supply chain are shown in
Figure 3 below.

4   Australian Export Grains Innovation Centre (2014)
5   Government of South Australia (2017).

Department of Infrastructure and Regional Development
PwC                                                                                                              10
Grain
Figure 3: Key participants in the Eyre Peninsula grain supply chain
Bulk grain Rail network Rail transport Ports Grain terminals
handlers provider
Sea transport
• Viterra • Port Adelaide • Viterra A
Operational positions and participants
• Viterra • Genesee & provider
(inner and
Wyoming outer) • Multiple
• Cargill
(GWA) • Port Giles providers
• Port Lincoln
• Port Wallaroo
• Port
Thevenard
Road network Road
transport
provider
• Dept of • Multiple
Planning, providers
Transport and
Infrastructure
• Local
government
Government Government authorities Government authorities Government
authorities authorities
Biosecurity, pest and • National Heavy Vehicle • Dep. Infrastructure and Regional
Governance
• Dep.
disease Regulator (Road transport) – Development (Cth) – Ports Infrastructure
management: vehicle standards, heavy vehicle operations and safety and Regional
access Development
• Dep. Primary • Dep. Planning, Transport and (Cth) –
Industries and Infrastructure (SA) Maritime
Regions (SA) security and
safety
Source: PwC Analysis
2.3.3 Infrastructure capacity
Bulk handling and storage
Viterra is the predominant bulk handler in this grain supply chain consisting of 92 receival
sites with a total storage capacity of 10 million tonnes. On farm grain storage was estimated
at 1 million tonnes.
Ports
The Eyre Peninsula grain supply chain consists of 6 terminals (Thevenard, Port Lincoln,
Wallaroo, Port Giles and Port Adelaide (including the Inner and Outer Harbour terminals)
with a total throughput capacity of approximately 7 million tonnes per annum.6 The terminal
facilities have load out rates of between 600 and 2,000 tonnes per hour and can handle
vessels of up to 60,000 dead weight tonnes (dwt).7
2.3.4 Costs
Grain supply chain costs are estimated at $72 per tonne, for Eyre Peninsula grain producers
traveling an average of 200km from farm to port.
2.4 Supply Chains – NSW
2.4.1 Mode(s)
The NSW grain supply chain is designed to transport grain to the port for export and also to
transport grain for domestic consumption. The transportation of grain from farms to bulk
6 ACCC (2016), Bulk wheat ports monitoring report
7 Australian Export Grains Innovation Centre (2014)
Department of Infrastructure and Regional Development
PwC 11Agriculture sector
handling sites relies almost entirely on road transportation. Freight to port relies more
heavily on rail which accounts for 85 per cent of total mode share.8
2.4.2 Participants & operation
The key positions and participants in the New South Wales grain supply chain are shown in
Figure 4 below.
Figure 4: Key participants in the NSW grain supply chain
Bulk grain Rail network Rail transport Ports Grain terminals
handlers provider
• Port Kembla • GrainCorp
Operational positions and participants
• GrainCorp • GrainCorp • Aurizon Sea transport
• Country Rail • Qube (NSW Ports) provider
• ARTC • Pacific
• Port • GrainCorp • Multiple
National
Newcastle • Newcastle providers
• John
Holland Agri. Terminal
• ARTC
Road network Road
transport
provider
• RMS • Multiple
• Local providers
governments
Government Government authorities Government authorities Government
authorities authorities
Governance
Biosecurity, pest and • National Heavy Vehicle • Dep. Infrastructure and Regional • Dep.
disease Regulator (Road transport) – Development (Cth) – Ports Infrastructure
management: vehicle standards, heavy vehicle operations and safety and Regional
access Development
• Dep. Primary • Roads and Maritime Services (Cth) –
Industries (NSW) (NSW) Maritime
security and
safety
Source: PwC Analysis
2.4.3 Infrastructure and capacity
Bulk handling and storage
Grain Corp operates 50 country silos in Central and Southern NSW with a total capacity of
5 million tonnes. On farm grain storage was estimated at 6.4 million tonnes. 9
Rail
The NSW grain supply chain uses both the Country Rail Network, which is operated by John
Holland, and the ARTC network. The section of the Country Rail Network which is used for
grain transportation is 996km in length and has an average TAL of 21 and a maximum speed
of 80km/h. Most of the ARTC network supports loads of 30 tonnes per axle (120 tonnes per
wagon), however the North Coast Line section is limited to 25 tonne axle load.
8 Australian Export Grains Innovation Centre (2014)
9 Australian Export Grains Innovation Centre (2014)
Department of Infrastructure and Regional Development
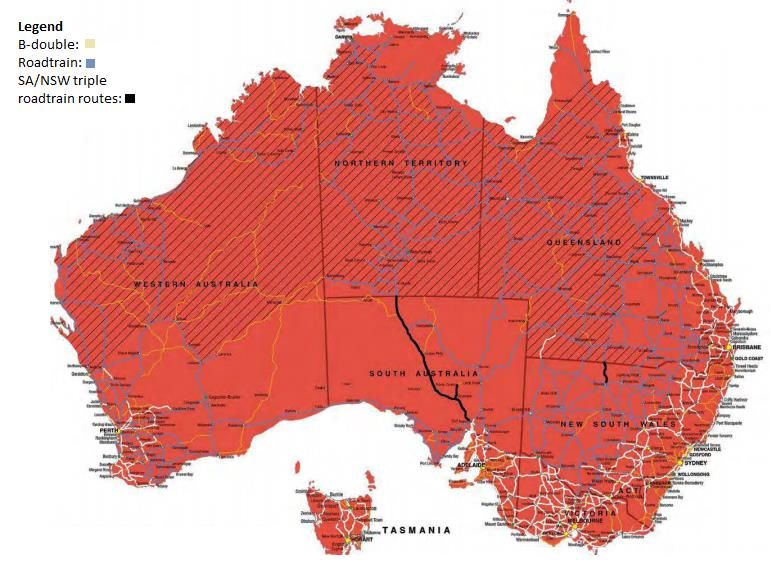
PwC 12Grain The NSW grain supply chain rail network uses 48 Class x 2 locomotives that carry payloads of 2,200 tonnes with a maximum length of 650m (up to 40 wagons). The grain is transported in GGVF SG wagons. Road The road network used by the NSW grains supply chain consists of both local and state governed roads. As shown in Figure 5 below, the road network is comprised of a series of routes which are approved for 25/26m B-double vehicles (green routes and yellow areas), some of which are approved with travel conditions (black routes and orange areas). GrainCorp operate a fleet of approximatley 100 diferent grain truck and trailer combinations with payloads ranging between 15 tonnes for a rigid truck to 102.5 tonnes for an AB triple with tri dolly.10 The HML capacity of the AB triple with tri dolly is 113 tonnes, however, the rate of deployment of HML capacities is unknown and the HML enabled network is relatively limted. Figure 5: NSW GML and CML networks (grain region shaded in grey) Source: Roads and Maratime Services (2016), valid as of 6/10/17 Ports The NSW grain supply chain consists of 2 terminals (Port Kembla and the Port of Newcastle) with a total throughput capacity of 10 million tonnes per annum.11 The terminal facilities 10 GrainCorp (date unknown) 11 ACCC (2016), Bulk wheat ports monitoring report Department of Infrastructure and Regional Development PwC 13
Agriculture sector

have load out rates of between 4,000 and 5,000 tonnes per hour and can handle vessels of up
to 120,000 dwt.12

The Port Kembla terminal is considered a fast-loading terminal by international standards.
These load out speeds compare favourably with Canadian ports which have maximum
loading capacities of 3,400 tonnes per hour. Fast load rates are critical to increasing
turnaround time and reducing vessel charter costs.

2.4.4 Costs
Grain supply chain costs are an estimated $69 per tonne, for NSW grain producers traveling
an average of 200km from farm to port.

2.5                                          Supply Chains – QLD
2.5.1 Mode(s)
The QLD grain supply chain is designed to transport grain for domestic consumption. The
transportation of grain from farms to bulk handling sites relies almost entirely on road
transportation. Road also accounts for 54 per cent of mode share for the freight to port
movement.13

2.5.2 Participants & operation
The key positions and participants in the QLD grain supply chain are shown in Figure 6
below.

Figure 6: Key participants in the QLD grain supply chain
                                           Bulk grain              Rail network      Rail transport     Ports             Grain terminals
                                           handlers                                  provider                                                Sea transport
                                                                                                        • Port Brisbane   • Wilmar Gavilon
                                                                                                                                             provider
                                           • GrainCorp
  Operational positions and participants

                                                                   • Queensland      • Aurizon                            • Fisherman        • Multiple
                                                                     Rail (Qld)                                             Island             providers
                                                                   • GrainCorp                          • Port Mackay     • GrainCorp

                                                                                                        • Port
                                                                                                          Gladstone

                                                                   Road network      Road
                                                                                     transport
                                                                                     provider
                                                                   • Dept of         • Multiple
                                                                     Transport         providers
                                                                     and Main
                                                                     Roads
                                                                   • Local
                                                                     governments

                                           Government              Government authorities               Government authorities               Government
                                           authorities                                                                                       authorities
                                                                   • National Heavy Vehicle
    Governance

                                           Biosecurity, pest and                                        • Dep. Infrastructure and Regional
                                                                     Regulator (Road transport) –                                            • Dep.
                                           disease                                                        Development (Cth) – Ports
                                                                     vehicle standards, heavy vehicle                                          Infrastructure
                                           management:                                                    operations and safety
                                                                     access                                                                    and Regional
                                                                   • Dep. Transport and Main Roads                                             Development
                                           • Dep. Agricultural
                                             and Fisheries
                                                                     (QLD)                                                                     (Cth) –
                                             (Qld)                                                                                             Maritime
                                                                                                                                               security and
                                                                                                                                               safety

Source: PwC Analysis

12 Australian Export Grains Innovation Centre (2014)

13 Australian Export Grains Innovation Centre (2014)

Department of Infrastructure and Regional Development
PwC                                                                                                                                                             14
Grain 2.5.3 Infrastructure and capacity Bulk handling and storage GrainCorp operate 23 receival sites with an unknown total storage capacity. On-farm grain storage was estimated at 2 million tonnes.14 Rail The QLD grain supply chain uses various systems within the Queensland Rail network including the following: Western Line; Glenmorgan Branch; South Western Line; Millmerran Branch; Clermont-Emerald; and Mt McLaren. This network is typically restricted to axle loads of between 15.75 and 18 tonnes. The QLD grain supply chain rail network uses 2,300 Class x 2 locomotives that carry payloads of 1,800 tonnes with a maximum length of 650m (up to 40 wagons). The grain is transported in VGH Narrow gauge grain hopper wagons. Road GrainCorp operate a fleet of approximatley 100 diferent grain truck and trailer combinations with payloads ranging between 15 tonnes for a rigid truck to 102.5 tonnes for an AB triple with tri dolly.15 The HML capacity of the AB triple with tri dolly is 113 tonnes, however, the deployment of HML capacities is not applicable in Queensland given road access. 16 Ports The QLD grain supply chain consists of 4 terminals with a total throughput capacity of approximately 4 million tonnes per annum (Mackay, Gladstone and Fisherman’s Island, Brisbane).17 The terminal facilities have load out rates of between 900 and 5,200 tonnes per hour and can handle vessels of up to 70,000 dwt. 18 2.5.4 Costs Grain supply chain costs are an estimated $73 per tonne, for QLD grain producers traveling an average of 200km from farm to port. 14 Australian Export Grains Innovation Centre (2014) 15 GrainCorp (date unknown) 16 AgForece Queensland (2017) 17 ACCC (2016), Bulk wheat ports monitoring report 18 Australian Export Grains Innovation Centre (2014) Department of Infrastructure and Regional Development PwC 15
Agriculture sector

2.6                                           Supply Chains – CBH (WA)
2.6.1 Mode(s)
The WA grain supply chain is predominantly designed to transport grain to the port for
export. The transportation of grain from farms to bulk handling sites relies almost entirely
on road transportation. Road also accounts for 40 per cent of mode share for the freight to
port movement with the remaining 60 per cent transported by rail. 19

2.6.2 Participants & operation
The key positions and participants in the WA grain supply chain are shown in Figure 7 below.

Figure 7: Key participants in the CBH grain supply chain
                                           Bulk grain              Rail network      Rail transport     Ports            Grain terminals     Sea transport
                                           handlers                                  provider                                                provider
  Operational positions and participants

                                           • CBH                   • CBH             • CBH              • Port Kwinana   CBH                 • Multiple
                                                                   • Brookfield                         • Port                                 providers
                                                                                     • Watco              Geraldton
                                                                                                        • Port Albany
                                                                                                        • Port
                                                                                                          Esperance

                                                                   Road network      Road
                                                                                     transport
                                                                                     provider
                                                                   • Mainroads       • Multiple
                                                                     WA                providers

                                           Government              Government authorities               Government authorities               Government
                                           authorities                                                                                       authorities
                                           Biosecurity, pest and   • National Heavy Vehicle             • Dep. Infrastructure and Regional   • Dep.
  Governance

                                           disease                   Regulator (Road transport) –         Development (Cth) – Ports            Infrastructure
                                           management:               vehicle standards, heavy vehicle     operations and safety                and Regional
                                           • Dep. Agriculture        access                                                                    Development
                                              and Food (WA)        • Dep. Transport (WA)                                                       (Cth) –
                                                                                                                                               Maritime
                                                                                                                                               security and
                                                                                                                                               safety

Source: PwC Analysis

2.6.3 Infrastructure capacity
Bulk handling and storage
The WA grain supply chain consists of 197 receival sites with a total storage capacity of
20 million tonnes. On farm grain storage was estimated at 2.6 million tonnes.20

Rail
The CBH grain supply chain uses the Brookfield operated rail network in the south-west of
Western Australia. This network is 5,500km in length and is typically restricted to axle loads
of between 16 and 24 tonnes. The network is organised into three tiers following a
government review conducted in 2009. Tier 1 and 2 lines were considered essential to the
grain freight network, while tier 3 lines were shut after they were deemed unsafe and
commercially unviable.

19 Australian Export Grains Innovation Centre (2014)

20 Australian Export Grains Innovation Centre (2014)

Department of Infrastructure and Regional Development
PwC                                                                                                                                                          16
Grain
Grain is hauled by CBH Class x 2 locomotives that carry payloads of 1,800 tonnes with a
maximum length of 650m (up to 40 wagons). The grain is transported in CBHN Narrow
gauge grain hopper wagons.
Road
A typical vehicle combination for grain freight bulk grain transportation in the WA grain
supply chain is a RAV3 network vehicle with a maximum length of 27.5m and a maximum
mass of 82 tonnes. This vehicle type is currently able to access a large network of roads in
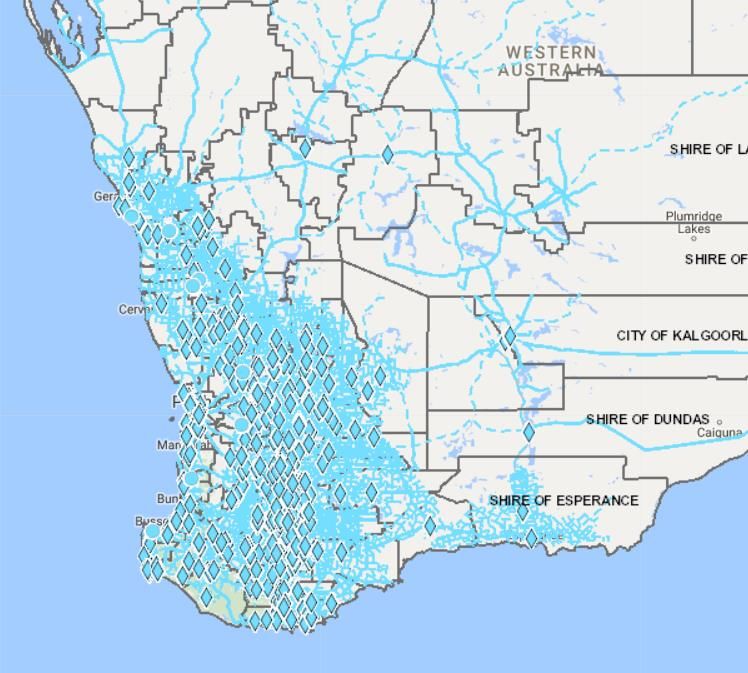
WA’s wheat belt as shown in Figure 8 below.
Figure 8: Tandem Drive Level 3* enabled road network (Restricted Access
Vehicle 3)
Source: Main Roads WA (2017)
*Tandem drive level 3 inlcudes (A) & (C) TRUCK TOWING A 5 OR 6 AXLE DOG TRAILER < 25.0M, (A) TRUCK
TOWING 2 X 5 OR 6 AXLE DOG TRAILERS
Ports
The WA grain supply chain consists of 5 terminals (Geraldton, Kwinana, Bunbury, Albany
and Esperance) with a total throughput capacity of 16.5 million tonnes.21 The terminal
21 ACCC (2016), Bulk wheat ports monitoring report
Department of Infrastructure and Regional Development
PwC 17Agriculture sector
facilities have load out rates of between 1,000 and 5,000 tonnes per hour and can handle
vessels of up to 120,000 dwt.22
The Kwinana terminal is considered a fast-loading terminal by international standards with
capacities of 5,000 tonnes per hour. These load out speeds compare favourably with other
Australian and international facilities.
2.6.4 Costs
Grain supply chain costs are an estimated $58 per tonne, for WA grain producers traveling
an average of 200km from farm to port.
2.7 Regulation
Ports in each of the grain supply chains are subject to the Port Terminal Access (Bulk Wheat)
Code of Conduct which requires port terminal service providers to ensure that exporters of
bulk wheat have fair and transparent access to port terminal services. The Code is enforced
by the ACCC.
Terminal operators can be exempt from parts 3 to 6 of the Code (access, loading protocols) if
it can be demonstrated to the ACCC that there is sufficient competition in the port zone. The
following terminals are currently exempt:
Adelaide terminal;
Port Kembla - all terminals;
Port of Newcastle - all terminals;
Port of Brisbane - all terminals; and
Bunbury.
2.8 International Case Study – Canada grain
supply chain
2.8.1 Description
Canada is the 8th largest producer and the 4th largest exporter of grain products. While
Canada produces 7 per cent or less of any one product, it is a significant exporter of wheat,
canola and pulses. Canada is a small producer of grain on a global scale, however the small
domestic demand relative to production makes the grain producer a significant exporter to
global markets.
2.8.2 Supply Chains
Mode(s)
Rail is the major mode of transport used for the large scale transport of 11,000 tonne grain
loads from regional inland depot facilities to export port terminals. The round trip cycle
times generally take 12 to 14 days per service reflecting one way haul distances of 1,300 to
1,800 km.
22 Australian Export Grains Innovation Centre (2014)
Department of Infrastructure and Regional Development
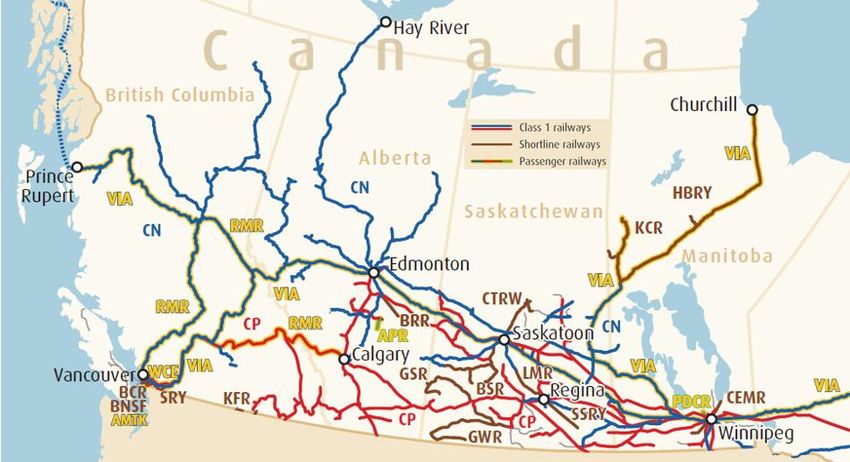
PwC 18Grain Participants & operation The rail task is dominated by major Canadian Class 1 rail operators Canadian Pacific (CP) Railway and Canadian National (CN) Railway, who provide integrated services through owning 85 % of the network and delivering 96% of the rail task. Infrastructure and capacity The main CP and CN networks have standards aligned to the USA networks to allow the switching and interchange of wagons between operators across country borders. The major rail companies when providing integrated rail transport services to customers, have a dual commercial challenge of matching both track and operating capacity to customer requirements. The networks developed by the rail companies also reflect the capacities required in individual regions for specific customer demand and products. While the majority of the network is single line track with passing loops, sections of the network have been expanded and augmented over time to meet capacity requirements. Regulation The Canadian grain industry has a regulatory framework that protects the interests of supply chain participants. Economic and safety regulation is applied to companies through the Canadian Transport Act by the Canadian Transport Agency and Transport Canada. 2.8.3 Lessons Learned Key lessons from the Canadian grain supply chain include: The haul distances from Western Canada to export ports are too long for road to be a viable mode option, resulting in the rail companies having significant market power. Shortline Operations that have taken over abandoned network components and handover wagons to CN/CP for line haul on main corridors, only own/operate only 15% of the network and transport 4% of rail haulage task. There has been a 38% reduction in the supply chain transport and handling time over the last 15 years due to efficiencies extracted from the supply chain as various operations have been rationalised subsequent to transfer from Government ownership and privatisation. Issues have arisen when rail capacity has been rationalised and grain harvest peaks result in demand outstripping capacity of grain export supply chains from Western Canada. This has resulted in a number of regulatory interventions that seek to rectify perceived or real market imbalances. These include: – interchange/interswitching obligations for shortline operators; – the MRE revenue cap for the major rail companies; – guaranteed rail service obligations when commercial negotiations fail; – the provision of guaranteed capacity levels by rail operators; and – the forced sale of abandoned rail network sections. The market power of the major companies in the supply chain and market imperfections and distortions has been the catalyst for government intervention and regulation of Canadian Export Grain supply chains. Department of Infrastructure and Regional Development PwC 19
Agriculture sector While Australian supply chains are also subject to regulation, the competition between the road and rail modes in Australia for grain export volumes appears to result in more market driven outcomes. The multi product rail networks in Canada ensure that critical trunk network infrastructure can be maintained at a high standard and is remunerated by the density of traffics using the networks. The lightly trafficked grain lines in Australia are typically relying on seasonal grain volumes to support and maintain the network infrastructure. In addition, Australia separates the financial accountability for network infrastructure and rail operations, unlike Canada. The vertically integrated model adopted in Canada may create surety of investment in network capacity but may require significant regulatory oversight as it is likely to reduce contestability. With the degradation of regional grain networks over time in Australia, Government funding support for rail branch lines that are limited to light grain traffic is typically required to ensure they remain open. Integrated above and below rail operations delivering customer rail solutions are more likely to ensure that rail industry stakeholder interests are aligned and industry is more responsive to customer requirements. Department of Infrastructure and Regional Development PwC 20
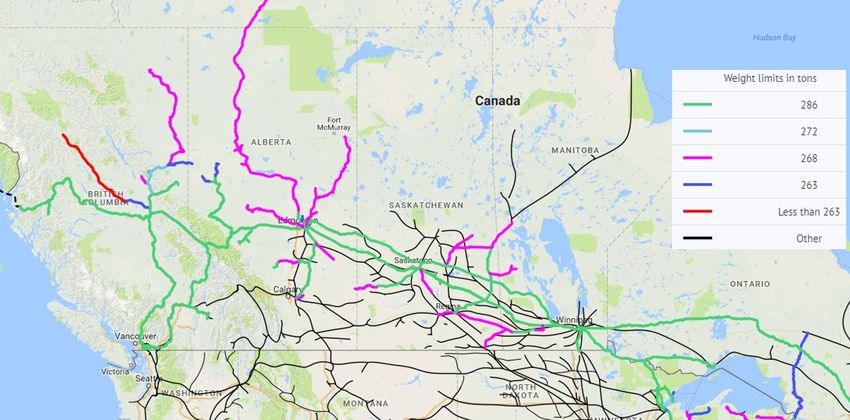
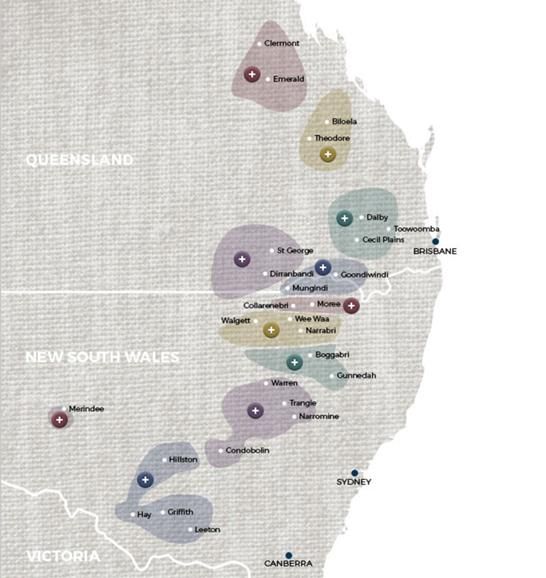
Cotton 3 Cotton 3.1 Freight Task 3.1.1 Production regions and volumes Australia produced 626.2 kilotonnes of cotton lint and 885.5 kilotonnes of cottonseed, which can be processed into oils and meal, in 2016. The key production regions include the: area surrounding the Barwon and Darling rivers in western NSW and the Lachlan and Murrumbidgee rivers in southern NSW which collectively account for approximately 60 per cent of volumes; and the Darling Downs, St George, Dirranbandi and Macintyre Valley regions in southern Queensland, which accounts for approximately 40 per cent of total volumes.23 Australia’s cotton production region is show in Figure 9 below. Figure 9: Cotton producing regions in Queensland and New South Wales Source: Cotton Australia (2017) 3.1.2 Nature of freight task Export based commodity Cotton lint is an export based commodity with approximately 99 percent of production exported. Key export markets include China, Indonesia and Thailand. Domestic 23 ABARES (2016) Department of Infrastructure and Regional Development PwC 21
Agriculture sector consumption of cotton lint has declined significantly in line with the contraction of Australia’s textiles industry. Inconsistency of freight task The freight task for cotton is seasonal reflecting the growing and harvesting patterns of the crop. Australia’s cotton growing season lasts approximately six months, starting in September/October (planting) and ending in March/April (picking). The freight task also varies depending on weather conditions (ie drought) which impact volumes. Impact of upcountry facilities on mode choice The choice of mode depends on whether there are up country containerisation facilities. If facilities are available the cotton is likely to be containerised at the terminal before being railed to warehouse in the metropolitan area and sent to the Port for export. If facilities are not available then cotton is likely to be transported by road to a warehouse in the metropolitan area before it is containerised and sent on to the Port for export. Backhaul The cotton lint freight task involves significant backhaul operations. Trucks are often loaded with diesel and fertiliser for transportation from the port to producers after the cotton product is unloaded for export. 3.1.3 Market Structure The overall cotton market is characterised by two distinct operating models including the: vertically integrated corporate model - this involves large vertically integrated operations who undertake ginning, warehousing, marketing and trade of cotton ie. Namoi, Cargill, Olam, Auscott; and individual growers model – this model involves cotton growers selling crop directly to a gin or to a marketing intermediary who on sells the crop to a gin. The Australian cotton industry operates under an unregulated market system which allows for this model. Cotton farming The cotton farm sector itself is highly fragmented with approximately 1,250 cotton farms in operation. The majority of agricultural operators in the sector are family-run farms and businesses. The four largest companies in the sector were estimated to account for less than 20 per cent of industry revenue in the 2016-17 period. CS Agriculture Pty Ltd is a major cotton operator, with a market share of 8.5 per cent.24 Farms are generally organised into cooperatives that arrange machinery purchases, provide seed, advise on pest control and undertake processing and marketing. Such cooperatives include Namoi Cotton Cooperative, which is also one of Australia’s largest ginners. Cotton ginning The cotton ginning is moderately concentrated with the industry’s four largest players accounting for an estimated 54 per cent market share. 25 The four largest players are Namoi Cotton, Olam Investments Australia (Queensland Cotton), LDC Enterprises Australia (Louis Dreyfus) and Auscott Limited. 24 IBISWorld (2017) 25 IBISWorld (2016) Department of Infrastructure and Regional Development PwC 22
Cotton
3.1.4 Key corridors
Export
The key export corridors for cotton export include:
cotton lint and cottonseed from Central Queensland, Darling Downs, St
George/Dirranbandi, Border Rivers and some volumes from Gwydir Valley transported to
the Port of Brisbane for export;
cotton lint and cottonseed from Namoi Valley, Macquarie Valley and some volumes from
Gwydir Valley transported to the Port of Botany for export; and
cotton lint and cottonseed from the Riverina, Bourke/Tandou and some volumes from
Namoi Valley and Macquarie Valley transport to the Port of Melbourne for export.
Cotton exports are predominantly bound for end markets in China and India.
Table 4 below shows the key ports from which cotton is exported from.
Table 4: Key ports for cotton exports
Port Botany Port of Brisbane Port of Melbourne
% of cotton lint exports 35% 43% 22%
% of cottonseed exports 37% 57% 7%
Source: Queensland Transport and Logistics Council (2014), rounding errors present
Domestic
Domestic consumption of cotton lint is negligible given the size of Australia’s textile
manufacturing industry. However, cottonseed, is transported to processing plants located
across NSW and QLD for transformation into meal and oils for the domestic market.
3.2 Supply chain – General
3.2.1 Mode(s)
Both the NSW and QLD cotton supply chains are predominantly road based. In QLD, only 5
per cent of containerised cotton bales and 3 per cent of cottonseed is transported via rail to
the Port of Brisbane (2013).26 Small volumes of cotton lint produced in northern NSW may
also rely rail for transportation to port for export.
Farm to gin
Picked cotton is pressed on farm into large, rectangular, truck-sized blocks called modules,
or large round bales. The cotton modules are transported either directly to ginning facilities
or via a warehouse by road where cotton lint is separated from cottonseed. The cotton lint is
pressed into bales and transported to the port for export.
Gin to port
Bales may be packed into containers on site and transported by road to a terminal for loading
onto a train and railed to the port for export. Bales may also be transported by road from the
gin to a containerisation facility for packing into containers. From there the containers are
transported to a terminal and then a port for export.
26 Queensland Transport and Logistics Council (2014)
Department of Infrastructure and Regional Development
PwC 23Agriculture sector
Rail transportation is used sparingly as very few gins have direct access to rail sidings. Many
gins also do not have sufficient onsite storage capacity (eg one or two week’s production
capacity) meaning an infrequent rail service would not be suitable.27
Gin to domestic markets
Cottonseed from the gin is transported to processing plants by road for transformation into
livestock feed and oils. These products are predominantly transported to domestic market
via road.
A schematic of the cotton supply chain is shown in Figure 10.
Regional variations
Figure 10: Cotton supply chain
Road Farm
(modules)
Road (modules)
Warehouse
Gin
Road (bales) Road
Key (containerised)
Road
Rail
Containerisation
Terminal
facility
Cottonseed
Terminal Terminal
processing
Domestic
consumption Port Port
(feedlot, mill)
Source: Queensland Transport and Logistics Council (2014)
3.3 Supply Chains - NSW
3.3.1 Participants & operation
The NSW cotton supply chain consists of a number of key supply chain positions, and
participants operating within each position. The key positions and participants in this
corridor are show in Figure 11 below.
27 Queensland Transport and Logistics Council (2014)
Department of Infrastructure and Regional Development
PwC 24Cotton
Figure 11: Key participants in the NSW cotton supply chain
Operational positions and participants Cotton production Rail network Rail transport Ports Sea transport
provider provider
• Cotton farms – • Hunter Valley Coal • Qube • Port Botany - Port • Multiple
family operated Network – ARTC • Pacific Authority of New providers
• Ginning facilities • Country Regional National South Wales
– Namoi, Network – John • Port Melbourne -
Auscott, Rivcott Holland Victorian Ports
• Sydney-Cragieburn Corporation
Corridor Line - ARTC (Melbourne)
Road network Road transport
provider
• RMS • Multiple
providers
Government Government authorities Government Government
authorities authorities authorities
• Department of • National Heavy Vehicle Regulator (Road • Dep. Infrastructure • Dep.
Primary transport) – vehicle standards, heavy
Governance
and Regional Infrastructure
Industries vehicle access Development (Cth) and Regional
(NSW) – • ACCC (Rail pricing and access) – Ports operations Development
biosecurity and • TfNSW (Freight transport policy) and safety (Cth) –
disease Maritime
• Dep. Agriculture Security and
and Fisheries – Safety
biosecurity and
disease
Source: PwC Analysis
3.3.2 Infrastructure and capacity
Road
Cotton is predominantly transported by long distance road hauliers, using articulated semi-
trailer, B-Double or A-Double road vehicles. The transportation of cotton modules from
farm-to-gin is almost entirely undertaken by road transportation. Cotton from the farm to
the gin is delivered by long distance road haulers using 14-18 tonne modules on flat top semi-
trailers, chain-bed loaded module trucks or B- Double road vehicles. B-Double, semi-trailer
and road trains transport bales from gins to warehouses for sorting, consolidation and
shipping.28
Rail
Cotton from the northern areas of Wee Waa and Narrabri is transported to Port Botany by
rail on the Hunter Valley Coal Network. This network is managed by ARTC and operates a
maximum TAL of 30 tonnes.
Cotton is also transported on the Country Regional Network from the North West of Sydney.
The Country Regional Network is owned by Transport for NSW and is operated by John
Holland under a 10-year lease ending in 2020. The relevant track starts in Warren, has a
maximum capacity of 22 TAL and a maximum speed of 80km/h.
Ports
NSW cotton, which has been pressed into bales and containerised, is exported through Port
Botany, the Port of Melbourne and the Port of Brisbane. Each of these ports have multiple
container berths with modern loading facilities. It is noted that the Port of Brisbane and
Melbourne receive cotton transported predominantly by road while the Port of Botany is
receives a relatively higher proportion of cotton by rail.
Table 5 below shows the key ports from which NSW cotton is exported from.
28 Queensland Transport and Logistics Council (2014)
Department of Infrastructure and Regional Development
PwC 25Agriculture sector
Table 5: Key ports for NSW cotton exports
Port Botany Port of Brisbane Port of Melbourne
% of cotton lint exports 50% 18% 32%
Source: Queensland Transport and Logistics Council (2014), rounding errors present
3.3.3 Costs
The cost of road transportation was not available based on publically available information.
The cost to transport cotton on the ARTC’s Hunter Valley Coal Chain Network is made up of
a fixed and a variable component. The cost for using the network between Maitland and
Muswellbrook are outlined in Table 6 below.
It is noted that the Maitland to Muswellbrook corridor only represents a portion of the track
from Wee Waa/Narribri to Port Botany. It is possible that the costs to travel from the more
remote cotton production regions is more expensive.
Table 6: Cost for cotton transport on the Hunter Valley Coal Network
Cost ($)
Variable price per ‘000 GTK 4.005
Flag fall price per train km 0.507
Source: ARTC (2017)
3.3.4 Regulation
Vehicles carrying cotton abide by most of the regulations of the National Heavy Vehicle
Regulator, but do have some state-based exemptions.
In recognition of the expansion of bales once they are loaded, cotton-carrying vehicles have
exemption to exceed the statutory width limit of 2.5 metres by 0.2 metres, so long as the
height is less than 4.6 metres and the load does not protrude more than 100mm from the
trailer.
Both vehicles with a height between 4.3 and 4.6 metres and vehicles with width between 2.6
and 2.7 metres are restricted in the roads they can travel.
3.4 Supply Chains - QLD
3.4.1 Participants & operation
The Queensland cotton supply chain consists of a number of key supply chain positions, and
participants operating within each position. The key positions and participants in this
corridor are show in Figure 12 below.
Department of Infrastructure and Regional Development
PwC 26Cotton
Figure 12: Key participants in the QLD cotton supply chain
Operational positions and participants Cotton production Rail network Rail transport Ports Sea transport
provider provider
• Cotton farms – • Queensland Rail • Freightliner • Port of Brisbane - • Multiple
family operated • Aurizon Port of Brisbane Pty providers
• Ginning facilities Ltd (PBPL)
– Namoi, Olam
Road network Road transport
provider
• Department of • Multiple
Transport and providers
Main Roads
(QLD)
Government Government authorities Government Government
authorities authorities authorities
• Dep. Agriculture • National Heavy Vehicle Regulator (Road • Dep. Infrastructure • Dep.
transport, vehicle standards, heavy
Governance
and Fisheries and Regional Infrastructure
(QLD) vehicle access) Development (Cth) and Regional
(Biosecurity and • ACCC (Rail pricing and access) – Ports operations Development
disease) • Department of Transport and Main and safety (Cth) –
Roads (QLD) (Heavy vehicle access, Maritime
freight policy) Security and
Safety
Source: PwC analysis
3.4.2 Infrastructure and capacity
Road
The QLD cotton supply chain adopts similar vehicles to NSW. Cotton is predominantly
transported by long distance road hauliers, using articulated semi-trailer, B-Double or A-
Double road vehicles. The transportation of cotton modules from farm-to-gin is almost
entirely undertaken by road transportation. Cotton from the farm to the gin is delivered by
long distance road haulers using 14-18 tonne modules on flat top semi-trailers, chain-bed
loaded module trucks or B- Double road vehicles. B-Double, semi-trailer and road trains
transport bales from gins to warehouses for sorting, consolidation and shipping. 29
Rail
Key rail lines used in the QLD cotton supply chain include:
South Western System – this system is operated by QR and is limited to 15.75 tonne axle
loads and diesel hauled trains of 655 metres. Container wagons are restricted in payload
(due to axle load limit) and can only fit sub-standard 2.75 metre high containers,
compared to contemporary industry standards of 2.9 up to 3.2 metres;
The diesel locomotives in use are 1970s vintage. Compared to current generation
locomotives, these old locomotives are poorly powered, have higher fuel consumption, are
more expensive to maintain and are less reliable; and
the West Moreton system – this system is operated by QR and is limited to 15.75 tonne
axle load, and diesel hauled trains of 655 metres, with a nominal payload of 1,940 tonnes.
The system includes steep grades, sharp curves and 11 tunnels with clearance limitations
which limits the overall capacity of the system which does not permit use of the preferred
29 Queensland Transport and Logistics Council (2014)
Department of Infrastructure and Regional Development
PwC 27You can also read