Regulation Impact Statement - Autonomous Emergency Braking Reducing Trauma from Light Vehicles: Department of Infrastructure and Transport
←
→
Page content transcription
If your browser does not render page correctly, please read the page content below
Regulation Impact
        Statement
Reducing Trauma from Light Vehicles:
 Autonomous Emergency Braking

                                July 2020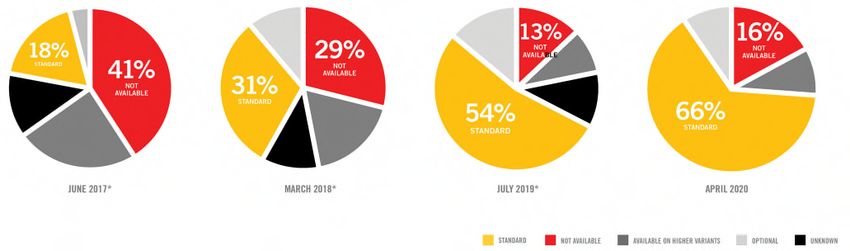
Reducing Urban Light Vehicle Trauma: Autonomous Emergency Braking
Regulation Impact Statement

Report Documentation Page
     Report No.                     Report Date               File No.                     OBPR Reference No.

     INFRA/VSS01/2020               July 2020                                              42547

     Title and Subtitle

     Reducing Trauma from Light Vehicles: Autonomous Emergency Braking
     Regulation Impact Statement

     Organisation Performing Analysis

     Standards Development and International
     Vehicle Safety Standards Branch
     Department of Infrastructure, Transport, Regional Development and Communications

     Regulatory Agency

     Department of Infrastructure, Transport, Regional Development and Communications
     GPO Box 594
     Canberra ACT 2601

     Key Words                                                Distribution Statement

     Autonomous Emergency Braking, Advanced                   This document is available online for the
     Emergency Braking, AEB, AEBS, Light                      duration of public consultation at:
     Vehicle, Urban, Braking, Australian Design               https://www.infrastructure.gov.au/vehicles/desi
     Rule, ADR                                                gn/adr_comment.aspx

     Security Classification                  No. Pages                            Price

     Unclassified                             96                                   No charge

ii     Department of Infrastructure, Transport, Cities and Regional Development and Communications
Contents
CONTENTS .................................................................................................................................................................. 3

EXECUTIVE SUMMARY ................................................................................................................................................ 5

CHAPTER 1:              WHAT IS THE PROBLEM? ................................................................................................................... 9
   OVERVIEW ......................................................................................................................................................................... 9
   1.1    THE COST OF ROAD TRAUMA IN AUSTRALIA ................................................................................................................ 9
   1.2    LIGHT VEHICLE TRAUMA RATES................................................................................................................................. 9
   1.3    CHARACTERISTICS OF LIGHT VEHICLE CRASHES ........................................................................................................... 12
   1.4    GOVERNMENT ACTIONS TO ADDRESS LIGHT VEHICLE TRAUMA ..................................................................................... 18

CHAPTER 2:              WHY IS GOVERNMENT ACTION NEEDED? .........................................................................................22
   OVERVIEW ....................................................................................................................................................................... 22
   2.1    THE NEED FOR GOVERNMENT ACTION ..................................................................................................................... 22
   2.2    AVAILABILITY AND UPTAKE OF AEB ......................................................................................................................... 22
   2.3    VEHICLE TECHNOLOGY INTERVENTIONS .................................................................................................................... 24
   2.4    AEB SYSTEMS ..................................................................................................................................................... 24
   2.5    AEB STANDARDS DEVELOPMENT ............................................................................................................................ 28
   2.6    SUMMARY OF UN REGULATION NO. 152 ................................................................................................................. 29
   2.7    OBJECTIVE OF GOVERNMENT ACTION ...................................................................................................................... 30

CHAPTER 3:              WHAT POLICY OPTIONS ARE BEING CONSIDERED? ...........................................................................32
   OVERVIEW ....................................................................................................................................................................... 32
   3.1    SUMMARY OF OPTIONS ......................................................................................................................................... 32
   3.2    DISCUSSION OF OPTIONS ....................................................................................................................................... 33

CHAPTER 4:              WHAT ARE THE LIKELY NET BENEFITS OF EACH OPTION? ..................................................................39

   4.1         BENEFIT-COST ANALYSIS........................................................................................................................................ 39
   4.2         ECONOMIC ASPECTS - IMPACT ANALYSIS................................................................................................................... 49

CHAPTER 5:              REGULATORY BURDEN AND COST OFFSETS ......................................................................................53

CHAPTER 6:              WHAT IS THE BEST OPTION? .............................................................................................................55

   6.1         NET BENEFITS...................................................................................................................................................... 55
   6.2         CASUALTY REDUCTIONS ......................................................................................................................................... 55
   6.3         RECOMMENDATION .............................................................................................................................................. 55
   6.4         IMPACTS OF RECOMMENDED OPTION ...................................................................................................................... 56
   6.5         SCOPE OF THE RECOMMENDED OPTION.................................................................................................................... 57
   6.6         TIMING OF THE RECOMMENDED OPTION .................................................................................................................. 57

CHAPTER 7:              CONSULTATION ................................................................................................................................59
   7.1         CONSULTATIVE COMMITTEES.................................................................................................................................. 59
   7.2         PUBLIC COMMENT ............................................................................................................................................... 59

                              Department of Infrastructure, Transport, Cities and Regional Development and Communicatiions                                                           3
Reducing Urban Light Vehicle Trauma: Autonomous Emergency Braking
Regulation Impact Statement

CHAPTER 8:              IMPLEMENTATION............................................................................................................................61

CHAPTER 9:              CONCLUSION AND RECOMMENDED OPTION ....................................................................................62
    9.1         CONCLUSION ....................................................................................................................................................... 62

REFERENCES ..............................................................................................................................................................64

APPENDIX 1 - VEHICLE CATEGORIES ...........................................................................................................................70
    PASSENGER VEHICLES (OTHER THAN OMNIBUSES) (M) ............................................................................................................ 70
    GOOD VEHICLES (N) .......................................................................................................................................................... 70

APPENDIX 2 - AWARENESS CAMPAIGNS ....................................................................................................................71
    BROAD HIGH COST CAMPAIGN ............................................................................................................................................ 71
    TARGETED LOW-COST CAMPAIGN......................................................................................................................................... 72

APPENDIX 3 - INFORMATION CAMPAIGNS ................................................................................................................74

APPENDIX 4 - UN REGULATION NO. 152 PERFORMANCE REQUIREMENTS .................................................................75

APPENDIX 5 - BENEFIT COST ANALYSIS ......................................................................................................................81

    SUMMARY OF BENEFIT COST ANALYSIS .................................................................................................................................. 93

APPENDIX 6 - ACRONYMS AND ABBREVIATIONS .......................................................................................................94

APPENDIX 7 - GLOSSARY OF TERMS ..........................................................................................................................95

4    Department of Infrastructure, Transport, Cities and Regional Development and Communications
Executive Summary
The impact of road trauma is significant, costing the Australian economy over $29 billion per
annum. Light vehicle crashes constitute almost $13 billion of this, including around $1.9 billion from
crashes involving a light vehicle striking a pedestrian or the rear of another vehicle. These types of
casualty crashes are concentrated in urban areas where increasing population and traffic density
raises crash frequency. Whilst they may not be as destructive as other crash types (such as heavy
vehicle crashes), the vulnerability of pedestrians and high rear-end crash frequencies amount to
significant trauma and associated costs.
Most rear-end crashes take place in urban traffic, at intersections and in tunnels due to a
combination of driver distraction and the relative cognitive complexity of these traffic conditions.
Rear-end crashes also have an increasingly apparent correlation between the types of locations
noted above and periods of high traffic density e.g. peak hour traffic. For these reasons, rear-end
crashes occur on urban roads at a rate around 20 per cent higher than on rural roads.
Pedestrians comprise 13 per cent of all road fatalities in Australia. Risk of a pedestrian being struck
by a vehicle increases in urban areas where high pedestrian activity and traffic densities converge.
Unlike vehicle-to-vehicle collisions where occupants can be substantially protected by vehicle
safety systems, pedestrians are unprotected and trauma can be severe. Children and the elderly
are particularly vulnerable to fatality and severe or permanent injury when struck.
The top five pre-crash risks in fatal road crashes in Australia (often referred to as “Fatal Five”
behaviours) are speeding, intoxication, fatigue, distraction and unrestrained occupants. The
majority of these behaviours result in slower driver reaction in emergency situations. Post-crash
statistics published by jurisdictions show that these behaviours result in trauma crashes most
commonly occurring in complex or dense driving situations including at intersections, multi-lane
merges and pedestrian crossings. Though campaigns targeting driver behaviour can help reduce
rates of driver error, vehicle technologies such as Autonomous Emergency Braking (AEB) can
directly mitigate collisions where driver reaction is insufficient.
AEB is designed to reduce the likelihood of a crash by warning the driver and then automatically
braking to reduce impact speed when a collision is imminent. Whilst AEB has been available for
some time, its performance varies across vehicles in the Australian fleet, particularly with regard to
protecting pedestrians and infrastructure. Consequently, early analyses may have overstated the
effectiveness of AEB systems or may have anticipated particularly sophisticated future systems.
Under the National Road Safety Strategy 2011-2020, the Department of Infrastructure, Transport,
Regional Development and Communications (the department) works to increase the uptake of
effective safety technologies through the development of national vehicle standards known as the
Australian Design Rules (ADRs). The department is active in the development of internationally
agreed standards for new vehicle technologies, commonly known as known as United Nations
(UN) regulations, that form the basis of the ADRs. Harmonising ADRs with these UN regulations
provides Australian consumers with access to vehicles meeting the latest global levels of safety
and innovation at the lowest possible cost.
Department of Infrastructure, Transport, Cities and Regional Development and Communicatiions 5Reducing Urban Light Vehicle Trauma: Autonomous Emergency Braking Regulation Impact Statement No country has implemented a standard for AEB for light vehicles. However, the department played a leading role in the rapid international development of a new standard for AEB for light vehicles through the UN World Forum for the Harmonization of Vehicle Regulations (known as WP.29), including shaping the international standard to suit Australian road safety. The standard was endorsed by WP.29 in early 2020 and will be available for adoption by contracting parties from late 2020 as a UN regulation. In preliminary evaluations, the department found that mandating AEB prior to AEB technology maturity (particularly with respect to pedestrian detection) and the availability of an effective standard would not have been cost-effective in Australia. Moreover, if adopted as an ADR prior to the availability of an internationally agreed standard, the benefits of harmonisation could not be obtained, creating additional costs and regulatory barriers for manufacturers. With the development of a new UN regulation for AEB for light vehicles underway, the department commissioned research into its impact on Australian road safety. This research found that AEB has the potential to positively impact the outcome in up to 64 per cent of light vehicle crashes occurring in low (up to 60 kph) speed zones. The research further highlighted that injury risk reductions associated with AEB were greater for serious and fatal injuries than for minor injuries. The research also found that AEB reduced injury risk in crashes involving pedestrians, having greatest influence in alleviating minor pedestrian injuries and mitigating elderly pedestrian fatalities. Prior to the availability of an international standard, non-regulatory programs such as the Australasian New Car Assessment Program (ANCAP) are fundamental in increasing the uptake of promising technologies such as AEB. The Commonwealth provides substantial funding to the ANCAP for this purpose. The ANCAP’s latest market analysis based on sales of Australian new light vehicles shows the standard fitment of AEB has increased rapidly – rising from 18 per cent to 66 cent of all new light passenger, SUV and light commercial vehicles sold in under three years. However, AEB is now not available for 16 per cent of vehicles sold, an increase from 13 per cent less than one year ago. Though some AEB systems available in Australia may not yet meet all requirements of the new UN regulation for light vehicle AEB, these uptake figures and independent testing by the ANCAP demonstrate that manufacturers are capable of achieving high deployment rates and meeting or exceeding minimum performance requirements. Harmonising AEB requirements also enables consistency in driver expectations of system capability (including day/night and inclement weather performance) and usage (including by standardising activation requirements and the provision of driver warnings/feedback). As with other technologies covered by UN regulations, harmonised minimum requirements will enhance the usability and effectiveness of AEB independent of manufacturer or a driver’s brand familiarity. This RIS considers six base options to increase the fitment of AEB systems to reduce rear-end and pedestrian fatalities in the Australian light vehicle fleet: Option 1: no intervention (business as usual); Option 2: user information campaigns; Option 3: fleet purchasing policies; Option 4: codes of practice; Option 5: mandatory standards under the Competition and Consumer Act 2010 (C’th) 6 Department of Infrastructure, Transport, Cities and Regional Development and Communications
(CCA); Option 6: mandatory standards under the Road Vehicle Standards Act 2018 (C’th)1
(RVSA).
Option 2 was separated into two sub-options: 2a (targeted awareness) and 2b (advertising). Of the
base options, Option 1, 2a, 2b, and 6 were considered viable and were examined in detail. The
results of the benefit-cost analysis over a 35 year period for each of these options (assuming an
intervention policy period of 15 years) are summarised in Table 1 to
Table 3.

Table 1:      Summary of gross and net benefits for each option

                                                         Gross benefits ($m)                   Net benefits ($m)
                                                                                        Best
                                                                                                       Likely case
                                                                                        case
 Option 1: no intervention                                        -                       -                 -
 Option 2a: targeted awareness                                   318                     77                12
 Option 2b: advertising                                          528                     14                -91
 Option 6: regulation                                           2,645                   1,349              960

Table 2:      Summary of costs and benefit-cost ratios for each option

                                                             Costs ($m)                       Benefit-cost ratios
                                                                                        Best
                                                                                                       Likely case
                                                                                        case
 Option 1: no intervention                                        -                       -                 -
 Option 2a: targeted awareness                                   306                     1.3               1.0
 Option 2b: advertising                                          619                     1.0               0.9
 Option 6: regulation                                           1,684                    2.0               1.6

1 Set to replace the Motor Vehicle Standards Act 1989.

                         Department of Infrastructure, Transport, Cities and Regional Development and Communicatiions   7
Reducing Urban Light Vehicle Trauma: Autonomous Emergency Braking
Regulation Impact Statement
Table 3: Summary of number of lives saved and serious injuries (hospital admissions) avoided
Lives saved Serious injuries Minor injuries
avoided avoided
Option 1: no intervention - -
Option 2a: targeted awareness 37 1,294 4,644
Option 2b: advertising 86 3,009 10,802
Option 6: regulation 586 20,600 73,937
Option 6 which enables regulation through the adoption of the new UN regulation for light vehicle
AEB generated the highest number of lives saved (586) and serious (20,600) and minor (73,937)
injuries avoided to yield the highest savings ($2,645 million) and highest benefit-cost ratio range of
1.6 (likely) to 2 (best).
In accordance with the Australian Government Guide to Regulation (2014) ten principles for
Australian Government policy makers, the policy option offering the greatest net benefit is the
recommended option. Option 6: regulation offers the greatest net benefit. Under this option, the UN
regulation for light vehicle AEB would be mandated for new light passenger and commercial
vehicles up to 3.5 tonnes Gross Vehicle Mass (GVM). These vehicles include ADR categories
passenger vehicles MA, MB, MC and light goods vehicles NA1 and NA2. The relevant ADR
categories are summarised in Appendix 1 - Vehicle Categories.
This early assessment RIS has been written in accordance with Australian Government RIS
requirements. In the subsequent eight chapters, the seven assessment questions set out in the
Australian Government Guide to Regulation (2014) have been addressed. In addition,
measurement of regulatory burden and cost offsets are considered. The seven base assessment
questions addressed are:
1. What is the problem you are trying to solve?
2. Why is government action needed?
3. What policy options are you considering?
4. What is the likely net benefit of each option?
5. Who will you consult about these options and how will you consult them?
6. What is the best option from those you have considered?
7. How will you implement and evaluate your chosen option?
In line with the principles for Australian Government policy makers, the regulatory costs imposed
on business, the community and individuals associated with each viable option were quantified and
measures that offset these costs have been identified.
This early assessment RIS will be circulated for a eight-week public comment period to draw out
the issues and stakeholder perspectives. A summary of the feedback and departmental responses
will be included in the final RIS that will inform decision making.
8 Department of Infrastructure, Transport, Cities and Regional Development and CommunicationsChapter 1: What is the Problem?
Overview
Trauma caused by light vehicles occurs more frequently than trauma associated with other vehicle
types such as heavy vehicles and motorcycles. Light vehicle trauma crashes concentrate in urban
areas where larger population, traffic complexity and density raises crash frequencies. Despite
significant government efforts to reduce them, rear-end and pedestrian crashes remain the most
prevalent trauma crash types in urban areas.
Experts agree that technologies such as autonomous emergency braking (AEB) can mitigate the
high prevalence of rear-end and pedestrian trauma crashes and associated costs. Although
voluntary fitment rates of AEB are increasing through manufacturer initiatives and informed
consumer choices, there has been a recent increase in the number of light vehicle models in the
market which cannot be purchased fitted with AEB. In addition, until recently, the lack of an
effective standard for light vehicle AEB has meant that AEB capability, usage and performance
varies substantially in the Australian light vehicle fleet. In particular, some current AEB systems
cannot detect pedestrians.
1.1 The Cost of Road Trauma in Australia
Individuals and families affected by road crashes must deal with pain and suffering, medical costs,
lost income, higher insurance premium rates and crash repair costs. There is also a personal cost
that is not possible to measure. For society as a whole, road crashes also result in substantial
costs in terms of lost productivity, property repair and healthcare expenses. The cost to the
Australian economy is broadly borne by the general public, businesses and government and has
been estimated to be over $29 billion per annum (ECON, 2017). This translates to an average cost
of $1,170 per annum levied upon every person in Australia.
1.2 Light Vehicle Trauma Rates
Light vehicles represent over 74 per cent of the 19.5 million registered motor vehicles in the
national fleet with an annual a growth rate of 1.2 per cent (1.6 per cent including light commercial
vehicles) (ABS, 2019a). In Australia, light vehicles also account for more road kilometres travelled
than any other vehicle type. In the 12 months ending June 2018, passenger vehicles travelled
179,761 million kilometres, accounting for 70.5 per cent of annual kilometres travelled on road, the
greatest exposure of any vehicle type. Each light vehicle travels an average 12.6 thousand
kilometres per year (ABS, 2019b).
Whilst heavy and commercial vehicles are predominantly operated by professionals subject to
government and industry oversight (for instance, in compliance with health and safety guidance),
light vehicles are mostly driven for personal use (54 per cent) followed by travel to and from work
(25 per cent), with fewer kilometres travelled for business purposes (21 per cent). In line with light
vehicle registrations and the proportion of kilometres they travel, 71 per cent of crashes causing
Department of Infrastructure, Transport, Cities and Regional Development and Communicatiions 9Reducing Urban Light Vehicle Trauma: Autonomous Emergency Braking
Regulation Impact Statement
road trauma involve light vehicles (BITRE, 2019a). Recent research commissioned towards this
study indicate these crashes cost the Australian economy almost $13 billion each year.
1.2.1 Fatal Crashes
The Australian Road Deaths Database, maintained by the Bureau of Infrastructure, Transport and
Regional Economics (BITRE), provides Australian road crash fatality data as reported by police.
The majority of road fatalities are occupants of light vehicles, constituting approximately 75 per
cent of all single vehicle crash fatalities and 68 per cent of all multiple vehicle crash fatalities
(BITRE, 2019a).
Light vehicle occupant fatalities historically outnumber combined fatalities from all other vehicle
types. Figure 1 shows the annual number of deaths in crashes involving light vehicles in Australia
compared to other vehicle types over the period 2009 to 2018. Fatalities in crashes involving light
vehicles decreased by nearly 25 per cent between 2009 and 2014 but has since increased by 13
percent in 2016.
Figure 1: Yearly fatalities in crashes by vehicle type (BITRE, 2019a)
1,400
1,200
1,000
800
600
400
200
0
2009 2010 2011 2012 2013 2014 2015 2016 2017 2018
Light Vehicles Prime Movers Rigid Trucks Buses
Light vehicle crashes causing pedestrian fatalities substantially outnumber combined pedestrian
fatalities from all other vehicle types, and account for approximately 76 per cent of all fatal
pedestrian accidents (BITRE, 2015). During the period 2017-2019, an average of 175 pedestrians
fatalities were recorded each year (BITRE, 2019b). Figure 2 compares pedestrian fatalities in light
vehicle crashes to pedestrian fatalities from other vehicle types. While crash outcomes for vehicle
occupants have improved over the ten years to 2018, similar improvements have not occurred for
pedestrians and other vulnerable road users including motorcyclists and pedal cyclists.
10 Department of Infrastructure, Transport, Cities and Regional Development and CommunicationsFigure 2: Pedestrian deaths – vehicle type involved (BITRE, 2019a)
180
160
140
120
100
80
60
40
20
0
2009 2010 2011 2012 2013 2014 2015 2016 2017
Light Vehicle Heavy Truck Bus Motorcycle Pedal Cycle
1.2.2 Serious and Minor Injury Crashes
The National Injury Surveillance Unit at Flinders University, using the Australian Institute of Health
and Welfare National Hospital Morbidity Database, provides data on hospitalisations due to land
transport incidents. Patients hospitalised following a road crash were most likely to have been
injured because they were an occupant of a light vehicle, with annual rates of 71 and 74
hospitalisations per 100,000 population for males and females respectively (AIHW, 2018).
Hospitalisation of pedestrians accounted for 12 cases per 100,000 population (AIHW, 2018).
Figure 3 shows that over the ten years to 2016, the trends for pedestrians and vehicle passengers
hospitalised with injuries did not decline and that driver hospitalisations increased.
Figure 3: Hospitalised injuries – by road user (BITRE, 2019a)
16000
14000
12000
10000
8000
6000
4000
2000
0
2009 2010 2011 2013 2014 2015 2016
Drivers Passengers Pedestrians Motorcyclists Pedal Cyclists
Department of Infrastructure, Transport, Cities and Regional Development and Communicatiions 11Reducing Urban Light Vehicle Trauma: Autonomous Emergency Braking Regulation Impact Statement 1.3 Characteristics of Light Vehicle Crashes Up to 90 per cent of road crashes in Australia result from human error (NTC, 2017). Numerous factors have been identified as increasing the risk of a driver being involved in a car accident. The top five pre-crash risk factors in fatal light vehicle crashes in Australia (often referred to as the “Fatal Five”) are speeding, intoxication, fatigue, distraction and unrestrained occupants (ATSB, 2004). In addition to identified pre-crash risk factors, Australian state and territory governments examine crash data reported by police so that common crash types can be identified and addressed, for instance through driver education campaigns addressing driver behaviour or encouraging the uptake of effective vehicle technology. Such information (Figure 4 to Figure 10) shows that complex and dense traffic situations (e.g., intersections, multi-lane merges, crossings and urban environments) are common factors in trauma crashes, with rear-end and pedestrian collisions the most frequent crash types reported in these situations. • This information has been used to shape driver education campaigns that encourage a change in driver behaviours and the uptake of effective technologies that can reduce rear-end and pedestrian crash risks. For example, in areas where rear-end and pedestrian trauma risk occurs, campaigns across a number of jurisdictions have targetted driver attention • safer speeds and reduced urban speed zoning, for instance near pedestrian areas and schools • the benefits of drivers choosing newer vehicles fitted with technologies capable of mitigating driver error. 12 Department of Infrastructure, Transport, Cities and Regional Development and Communications
Figure 4: Crashes by type in ACT (ACT, 2017)

                          Rear end collision                                                         44.58%

                        Right angle collision                           13.69%

        Other - Vehicle to vehicle (on road)                       11.86%

                 Same direction side swipe                      8.95%

                    Struck object (off road)               6.86%

          Right turn into oncoming vehicle              4.31%

              Collision with parked vehicle       2.41%

        Struck animal (not ridden/on road)        2.01%

       Collision while one vehicle reversing     1.29%

                      Overturned (on road)       0.90%

                Struck pedestrian (on road)     0.70%

            Other - Single vehicle (on road)    0.59%

                          Head on collision     0.49%

             Opposite direction side swipe      0.34%

                 No object struck (off road)    0.29%

                    Struck object (on road)     0.28%

                   Struck vehicle (off road)    0.18%

                      Overturned (off road)     0.16%

       Struck pedestrian (on footpath etc.)     0.09%

        Fall from moving vehicle (on road)      0.01%

            Other - Single vehicle (off road)   0.00%

        Struck animal (not ridden/off road)     0.00%

                   Department of Infrastructure, Transport, Cities and Regional Development and Communicatiions   13
Reducing Urban Light Vehicle Trauma: Autonomous Emergency Braking
Regulation Impact Statement
Figure 5: Crashes by type in NSW 2013 - 2017 (TfNSW, 2018)
Rear End 23.50%
Off path or Out of Control (On Straight) 14.53%
Off path or Out of Control (On Curve) 13.23%
Adjacent Direction at Intersections 12.98%
Other Opposing Direction 8.14%
Pedestrian 7.43%
Side Swipe or Lane Change 6.51%
Manoeuvring 6.03%
Head On (not overtaking) 4.04%
On Path 2.32%
Overtaking 0.74%
Miscellaneous 0.55%
Figure 6: Crashes by type in QLD (QLD, 2019b)
Angle 30.22%
Rear End 24.09%
Overturned 5.22%
Sideswipe 4.65%
Hit Pedestrian 3.92%
Head on collision 2.31%
Collision - miscellaneous 0.10%
14 Department of Infrastructure, Transport, Cities and Regional Development and CommunicationsFigure 7: Crashes by type in SA (SA, 2018)
Rear End 26.30%
Right Angle 18.60%
Hit Fixed Object 16.41%
Side Swipe 10.82%
Right Turn 7.82%
Hit Parked Vehicle 7.43%
Roll Over 4.38%
Hit Pedestrian 3.08%
Head On 1.91%
Hit Animal 1.37%
Left Road - Out of Control 0.95%
Other 0.65%
Hit Object on Road 0.29%
Figure 8: Crashes by type in Tasmania (AAMI, 2018)
Collision With Stationary Object 29.00%
Failed to give way 18.00%
Rear End 17.00%
Collision While Reversing 13.00%
Hit An Animal 11%
Collision With Parked Car 11%
Other 2%
Department of Infrastructure, Transport, Cities and Regional Development and Communicatiions 15Reducing Urban Light Vehicle Trauma: Autonomous Emergency Braking
Regulation Impact Statement
Figure 9: Crashes by type in Victoria 2013-2019 (VIC, 2019)
Others (Fixed objects, animals, parked
47.42
vehicles,reversing, railway crossings, etc)
Rear End (Vehicles In Same Lane) 18.02
Intersections Only 15.20
Pedestrians 6.70
Out Of Control On Carriageway (On Straight) 4.40
Head On (Not Overtaking) 3.29
Lane Change Left/Right (Not Overtaking) 2.30
Out Of Control On Carriageway (On Bend) 1.26
Lane Side Swipe (Vehicles In Parallel Lanes) 1.09
Head On (Overtaking) 0.19
Cutting In (Overtaking) 0.13
Figure 10: Crashes by type in WA 2014-2018 (MRWA, 2019)
Rear End 42.61%
Right Angle 20.39%
Side Swipe Same Direction 11.08%
Hit Object 8.36%
Right Turn Thru 6.35%
Other 5.56%
Non Collision 2.47%
Hit Pedestrian 1.22%
Head On 1.01%
Hit Animal 0.96%
16 Department of Infrastructure, Transport, Cities and Regional Development and Communications1.3.1 Rear-end Crashes
Collisions involving a light vehicle impacting the rear of another vehicle account for almost 15 per
cent of all Australian light vehicle trauma (MUARC, 2020). About one quarter of rear-end crashes
result in fatal or serious injuries (Austroads, 2015).
Distraction and cognitive complexity involved in some driving tasks are common factors in rear-end
crashes. As a result, they most commonly occur when changing lanes, at pedestrian crossings
(Antonucci et al., 2004), in tunnels (Austroads, 2018 and Cornelia, 2007) and at intersections.
Indeed, the most common type of two-vehicle crash at intersections is rear-end collisions
(Austroads, 2015). Further, from a sample of 13 tunnels in Australia and New Zealand where crash
data was available, 62 per cent of crashes were identified as rear-end type with light vehicles
involved in 78 per cent of all crashes in tunnels (Austroads, 2018).
In urban areas, rear-end crash frequencies are exacerbated by traffic density. As well as
increasing cognitive load on drivers, behaviours (including queue jumping and tailgating) are more
common during peak hour traffic and lead to a higher incidence of rear-end crashes (Rakotonirainy
et al, 2017). In line with exposure to peak traffic times, the occurrence of rear-end crashes during
the day is 50 per cent higher than at night (Yan et al., 2005).
Figure 11 highlights that rear-end trauma is most common in an urban environment. At higher
vehicle speeds common in rural and highway environments, reduced driver reaction times and
extended or high speed emergency braking application increases rear-end crash severity.
However, rear-end crash risk is comparatively lower in highway environments due to increased
traffic flow consistency and decreased environmental complexity (Austroads, 2015), (Yan et al.
2005).
Figure 11: Proportions of rural and urban rear-end fatal and serious injury crashes by year (Austroads, 2015).
18.00
16.00
14.00
12.00
10.00
8.00
6.00
4.00
2.00
0.00
2006 2007 2008 2009 2010
Serious Injury (Urban) Fatal (Urban) Serious Injury (Rural) Fatal (Rural)
Department of Infrastructure, Transport, Cities and Regional Development and Communicatiions 17Reducing Urban Light Vehicle Trauma: Autonomous Emergency Braking Regulation Impact Statement 1.3.2 Pedestrian Crashes Most Australians regularly walk on or near roads and related infrastructure. Pedestrians (along with motorcyclists and pedal cyclists) are considered particularly vulnerable because they have little or no protection if struck by a road vehicle. Pedestrians travel low kilometres relative to other road user groups yet comprise 13 per cent of all road fatalities in Australia (BITRE, 2015). Whilst vehicle occupant fatalities declined in the ten years to 2018, fatalities of pedestrians and vulnerable road users have not (BITRE, 2019a). The majority of pedestrian fatalities (75.8 per cent) involve a light vehicle striking the pedestrian (BITRE, 2015). Pedestrians face increased trauma risk in higher speed zone collisions due to reduced driver reaction times and because collisions become more destructive at higher speeds. Where a pedestrian is struck by a car, the risk of death has been estimated at 5 per cent at an impact speed of 30 km/h, 10 per cent at 37 km/h, 50 per cent at 59 km/h, 75 per cent at 69 km/h and 90 per cent at 80 km/h (Hussain et al. 2019). 1.4 Government Actions to Address Light Vehicle Trauma Government actions to address trauma in crashes involving light vehicles include initiatives at the state and federal government levels. They include both regulatory and non-regulatory means such as the use of market forces, manufacturer commitments, codes of practice, public education campaigns and fleet purchasing policies. Despite the programs outlined below, significant levels of urban light vehicle rear-end and pedestrian trauma remains. 1.4.1 National Funding for Road Safety Initiatives The Australian Government allocates dedicated funding for a number of road safety programs. For example, The Road Safety Awareness and Enablers Fund provides $4 million over four years from 2019–20 for grants to fund road safety awareness, education and collaboration initiatives such as to the Australasian College of Road Safety, the Australian Road Safety Foundation, Driver Reviver Australia, the Campervan and Motorhome Club of Australia, the Traffic Management Association of Australia and Safer Australian Roads and Highways (SARAH) Group and Fatality Free Friday (ORS, 2019). 1.4.2 Infrastructure Upgrades The Australian Government's infrastructure investment agenda focusses on funding land transport infrastructure that delivers safer and efficient connections for all road users. This involves investing $100 billion over 10 years from 2019-20 through its rolling infrastructure plan to help manage Australia’s growing population, meet the national freight challenge and get Australians home sooner and safer. It includes an additional $23 billion of new funding in the 2019–20 Budget for new projects and initiatives across every state and territory. 18 Department of Infrastructure, Transport, Cities and Regional Development and Communications
Whilst safe vehicle design is predominantly an offshore business activity, road planning, design
operation and improvements are generally managed by Australian government agencies. Despite
this separation, there are opportunities to ensure that infrastructure and vehicle designs are
complementary. For example, use of road furniture and intersection geometries that maximise
vehicle occupant outcomes in crashes. Funding is allocated to national infrastructure upgrades and
projects that improve productivity and road safety outcomes.
A large component of the ongoing work to implement and further develop elements of the National
Road Safety Strategy and Action Plan is being carried out through the Austroads Road Safety
Program. Austroads is the peak organisation of Australasian road transport and traffic agencies.
Austroads members are collectively responsible for the management of a majority of Australian
roads.
Key nationally focused infrastructure research and development projects being undertaken by
Austroads and other partners include (DITC&RD, 2020):
   •    Australian National Risk Assessment Model (ANRAM) provides a system to implement a
        nationally-consistent risk-based road assessment program, to identify road sections with
        the highest risk of severe crashes.
   •    Austroads project ‘Safe System Infrastructure on Mixed Use Arterials’, will investigate how
        the Safe System approach can be applied to urban arterials.
   •    Austroads project ‘Understanding and Improving Safe System Intersection Performance’,
        will provide guidance to road agencies on options for design and retrofit of intersections so
        they better align with Safe System principles.
   •    Austroads project ‘Translating Safe System Infrastructure Research and Knowledge into
        Practice’ (SS2016), will produce a guidance document and a series of workshops for road
        practitioners outlining knowledge and research about designing, managing and operating
        roads and roadsides within a Safe System environment.
   •    The Australian Road Assessment Program (AusRAP) is an analysis of the major highways
        and motorways in Australia, as defined in the National Land Transport Network
        Determination 2014. AusRAP is a program run by the Australian Automobile Association
        (AAA) and the state and territory motoring clubs.

1.4.3       State and Territory Government Action
State and territory governments undertake activities that improve identified light vehicle safety
concerns such as pedestrian and rear-end trauma crashes. These actions include investment in
research projects, education campaigns, and strategic partnerships. They also include increased
stringency in safety requirements and commercial arrangements, particularly for access to
government contracts. For instance, most vehicle fleet policies across the jurisdictions state that
the vehicle must have a five star ANCAP rating.
Through their road safety strategies most jurisdictions have committed to ‘Towards Zero’ which has
as its guiding vision that no person should be killed or seriously injured on Australia’s roads. This
vision aims to improve road safety through four cornerstones: safe road use; safe roads and road

                Department of Infrastructure, Transport, Cities and Regional Development and Communicatiions   19
Reducing Urban Light Vehicle Trauma: Autonomous Emergency Braking
Regulation Impact Statement
sides; safe speeds and safe vehicles. Recognising that road safety is a complex issue, the
strategies cover a range of actions, including campaigns that target:
• Driver distraction awareness
• Safe driving
• School and community road safety education
• Drivers to consider new and proven vehicle technology when purchasing a new vehicle
1.4.4 The National Road Safety Strategy 2011-2020 (NRSS)
The Australian Government also works closely with state and territory governments to implement
commitments under the NRSS. The current NRSS was endorsed by Transport Ministers in May
2011. The NRSS set an ambitious aim to reduce the number of deaths and serious injuries on the
nation’s roads by 30 per cent by 2020 (relative to the baseline period 2008-2010 levels). Though
the full target has not been achieved at this time, from the baseline of over 1,400 deaths per year,
fatalities on Australian roads reduced to 1,105 for the 12 months to 30 June 2020. Commonwealth,
states and territory governments have committed to a set of national road safety goals and
priorities through the decade 2011-2020 and beyond (Transport and Infrastructure Council, 2011).
The National Road Safety Action Plan 2018–2020 (NRSAP) is intended to support implementation
of the NRSS. It details national priorities to be undertaken by governments over the final three
years of the current NRSS from 2018 to 2020. The NRSAP contains nine Priority Actions that all
jurisdictions have agreed to complete in order to meet the targets for road trauma reduction
contained in the NRSS. The NRSAP also includes a list of Other Critical Actions – these represent
either extensions of existing national efforts or supporting actions that are important to continue in
addition to the key national priority list. The choice of Priority Actions and Other Critical Actions has
been informed by available data and evidence regarding effective approaches to reduce road
trauma.
Activities prioritised by the NRSS to target light vehicle road trauma include:
• Priority Action 3 of the NRSAP aims to reduce trauma from crashes at urban intersections.
• As part of the Future Steps under the Safe Vehicles pillar, the NRSS scheduled
consideration of mandating AEB for light vehicles. Priority Action 4 of the NRSAP
schedules consideration of methods to increase deployment of AEB in both light and heavy
vehicles through examining international standards for AEB for light vehicles for
implementation in the Australian new vehicle fleet.
• Priority Action 9 of the NRSAP is to increase the market uptake of safer new and used
vehicles and emerging vehicle technologies with high safety benefits. This Priority Action
required the Commonwealth and state and territory Governments to update their fleet
policies to require ANCAP 5-star rated light passenger and light commercial vehicles, as
well as driver assistance technologies.
• Other Critical Action C of the NRSAP is to better protect light vehicle occupants by updating
to the latest available international crash standards.
• Other Critical Action E of the NRSAP targets reduced road trauma associated with driver
distraction.
20 Department of Infrastructure, Transport, Cities and Regional Development and CommunicationsMany of the actions undertaken under the NRSS and NRSAP involve initial research and
investigation work that is needed to underpin effective road safety interventions. A large
component of this work is progressed through the Austroads Safety Program. Research and
development work linked to the implementation of the Strategy is also undertaken by a number of
other bodies, including the National Transport Commission (NTC), the former National Road Safety
Council, the Department of Infrastructure, Transport, Regional Development and Communications
and the state and territory road authorities.
1.4.5 National Vehicle Standards
The Australian Government administers the Motor Vehicle Standards Act 1989, set to be replaced
by the Road Vehicle Standards Act 2018 (C’th) (RVSA), which requires that all new road vehicles,
whether they are manufactured in Australia or are imported, comply with national vehicle standards
known as the Australian Design Rules (ADRs), before they can be offered to the market for use in
transport in Australia. The ADRs are generally performance based and cover vehicle safety, anti-
theft and environmental impacts.
ADRs covering vehicle structures and restraint systems have improved crash performance
significantly. Passive safety features such as airbags, seat belts, collapsible steering columns,
head restraints and padded surfaces help prevent or manage the forces of impact in crashes. More
recently, ADRs covering technologies that assist in mitigating crashes, such as advanced braking
systems (ABS) and ESC, offer further reductions in road trauma.
1.4.6 Australasian New Car Assessment Program (ANCAP)
ANCAP is an independent vehicle safety authority that publishes consumer education information
covering a range of new passenger, sports utility and light commercial vehicles entering the
Australian and New Zealand markets, using a rating system of 0 to 5 stars. These ratings are
continually reviewed and are displayed with a date stamp in order to keep pace with technology
developments and to ensure that star ratings reward the most effective technologies. Some
vehicles with an older date stamped rating will not have been tested to the latest, most stringent,
standards. ANCAP works in partnership with 23 member organisations including the Australian
Commonwealth, State and Territory governments.
Where international standards are yet to be developed, or there is not a strong case for
implementation in Australia, non-regulatory programs such as ANCAP can be an effective
alternative to improve safety. The Government provides substantial funding to ANCAP for this
purpose. Government support for ANCAP has been a long standing element in the Future Steps of
the Safe Vehicles pillar of the NRSS and ensures ANCAP continues to encourage the latest
vehicle safety innovations.
As set out above, there is a strong commitment by federal, state, territory and local governments to
improve road safety in Australia. Nevertheless, the number of deaths and serious injuries on
Australian roads remains unacceptably high, despite government goodwill and action.
Department of Infrastructure, Transport, Cities and Regional Development and Communicatiions 21Reducing Urban Light Vehicle Trauma: Autonomous Emergency Braking
Regulation Impact Statement
Chapter 2: Why Is Government Action Needed?
Overview
Though Australian businesses and governments work towards reducing light vehicle trauma, the
cost of urban rear end and pedestrian trauma remains significant. AEB can help to mitigate such
trauma. The technology is now at a more mature stage, partly through the work of ANCAP to
increase its uptake by better informing consumers. However, while AEB fitment remains
unregulated, design, performance capability and usability of AEB systems varies across vehicle
models in the Australian fleet. Where voluntarily fitted systems lack standard capability (such as
pedestrian performance), gaps remain in the opportunity for AEB to reduce light vehicle trauma.
Regulation is necessary to standardise minimum AEB performance requirements and driver
interfaces. Furthermore, by setting a standard minimum performance level, regulation can provide
cost-effective and maximised fitment in the new Australian light vehicle fleet.
2.1 The Need for Government Action
Government action may be needed where the market fails to provide the most efficient and
effective solution to a problem. Light vehicle rear impact and pedestrian crashes cost the
Australian community around $1.9 billion every year. Given the availability and promising
effectiveness of modern AEB systems, there remains substantial potential to reduce these costs.
Over recent years, market research has shown a marked increase in the performance, fitment
rates, and consumer uptake of collision avoidance technologies such as AEB. However, to derive
the highest benefits in the reduction of road trauma and associated costs, it is important to
maximise fitment and standardise minimum performance requirements.
Examples of government action in implementing effective vehicle standards include:
• Pole side impact measures for cars and light commercial vehicles (ADR 85, 2017)
adopting the requirements of UN Regulation No. 135. It is estimated that this measure will
save 128 lives over 15 years, while providing net benefits to the community of $417 million.
• Anti-lock braking systems for motorcycles (ADR 33, 2019) adopting requirements of UN
Regulation No. 78. It is estimated that this measure will save 587 lives over 15 years, while
providing net benefits to the community of $1.6 billion.
• Electronic stability control for heavy vehicles and trailers (ADR 38 and 35, from 2019). It
is estimated that these measures will save 126 lives over 15 years, while providing net
benefits to the community of $216 million.
2.2 Availability and Uptake of AEB
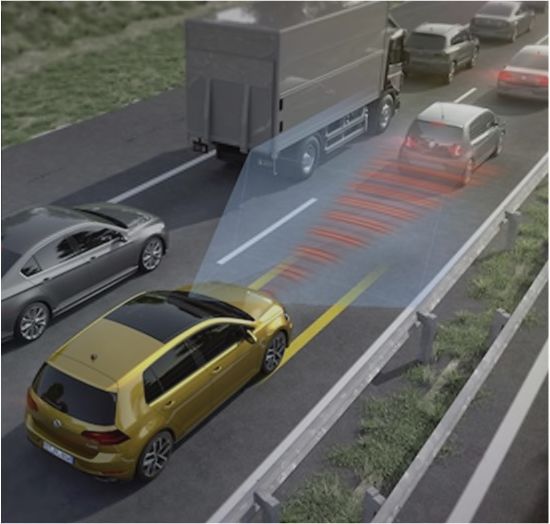
In June 2020, ANCAP released new figures on the market availability and consumer uptake of
AEB, reporting that the standard fitment of AEB has risen from 18 to 66 per cent of models over
three years to April 2020. ANCAP’s analysis of the top 100 selling light vehicle models
(representing 88 per cent of the light vehicle market and approximately 32,000 sales) found that 63
22 Department of Infrastructure, Transport, Cities and Regional Development and Communicationsof the top 100 selling models offered AEB as standard equipment, representing a 58 per cent
fitment rate across new sales. However, AEB is now not available for 16 per cent of vehicles sold,
an increase from 13 per cent less than one year ago. The results from market snapshots over the
period June 2017 to April 2020 are included in Figure 12.
Figure 12: AEB Availability - 2015 to 2019 (ANCAP, 2020)
Though ANCAP reports AEB fitment is increasing in the Australian fleet the performance capability
is variable. In addition, many consumers are choosing not to purchase vehicles fitted with AEB.
The adoption of international regulations as a basis for national or regional standards results in the
highest safety levels at the lowest possible cost. Harmonising Australian requirements with those in
other major markets would minimise costs associated with AEB system development and provides
manufacturers the flexibility to incorporate or adapt systems that have already been developed,
manufactured and tested in (or for) markets with equivalent AEB performance requirements. It
would also enable leveraging of testing and certification frameworks already conducted in those
markets where the vehicles are manufactured.
Harmonising AEB requirements also enables consistency in driver expectations of system
capability (including day/night and inclement weather performance) and usage (including by
standardising activation requirements and the provision driver warnings/feedback). As with other
technologies covered by internationally agreed regulations, harmonised minimum requirements will
enhance the usability and effectiveness of AEB independent of manufacturer or a driver’s brand
familiarity.
Common test and rating protocols were adopted by ANCAP and Euro NCAP in 2018 and the
protocols are shifting again for 2020. These will most likely result in an even sharper focus on
safety from manufacturers. Some of these changes include:
• the number of physical crash tests increasing from five to eight (of which two are far-side
impact tests)
• the speed of the frontal offset test has dropped from 64 kph to 50 kph. The severity of the
crash will increase with the introduction of a dynamic deformable barrier instead of a static
barrier
• the speed of side impact test will increase ;increase from 50 kph to 60 kph with trolley mass
increased to 1400 kg from 1300 kg.
• further AEB testing incorporating scenarios with pedestrians during reversing and other car
to car scenarios at intersections
Department of Infrastructure, Transport, Cities and Regional Development and Communicatiions 23Reducing Urban Light Vehicle Trauma: Autonomous Emergency Braking
Regulation Impact Statement
• protocols relating to post-crash response to help first responders
ANCAP conducts a range of AEB tests and assessments with vehicles required to meet minimum
score thresholds for each star rating level. The data gathered from the tests are assessed, along
with an inspection of the vehicle, test dummies, on-board hazards and performance of in-built
systems, and scores determined for each respective test. ANCAP published test results show AEB
systems evaluated have been variable in performance across manufacturers and models.
2.3 Vehicle Technology Interventions
Though campaigns targeting the Fatal Five and driver behaviour can help reduce rates of driver
error, vehicle technology can directly mitigate collisions where driver reaction is insufficient
The last two decades have seen the advent of various intelligent driver aids that are commonly
referred to as Advanced Driver Assistance Systems (ADAS). Some examples of ADAS are Lane
Departure Warning (LDW), Adaptive Cruise Control (ACC) and AEB.
In the development of the NRSS, experts agreed the most promising vehicle technology towards
reducing light vehicle trauma is AEB. This view is supported internationally in the UN prioritisation
of the development of a UN Regulation for light vehicle AEB, and in domestic research (MUARC
2019). AEB technology is also considered an important technology in supporting NRSS and
NRSAP targets, as well as road safety concerns identified by states and territories.
2.4 AEB Systems
AEB is designed to reduce the likelihood of a crash by warning the driver and then automatically
braking the vehicle to reduce impact speed if a collision is imminent. While AEB has been available
for some time, capability across vehicles in the Australian fleet has been variable and sometimes
misunderstood, particularly around pedestrian and infrastructure performance. Early analyses may
have overstated the effectiveness of AEB systems or anticipated particularly sophisticated systems
would become common (see section 2.4.1). Nevertheless, AEB has the potential to mitigate both
rear-end and pedestrian crashes, which constitute a significant proportion of crashes reducing
trauma risks and has proven to be particularly effective in urban environments and at intersections
(Austroads, 2015).
Like other ADAS, an AEB system reads inputs from a variety of devices to monitor the
environment. In the event that a collision with a vehicle or pedestrian is predicted, the driver is
warned via optical, haptic and acoustic alarms. If the driver does not respond, a warning brake
phase may be initiated. If the driver still does not react to the event, the system will prime the
brakes and soon after execute an emergency braking phase in order to mitigate the collision. The
AEB system is typically linked with and complements ABS in most light vehicles, ensuring that an
automatically generated emergency stop intervention does not lead to, for example, directional
instability and wheel lock when overbraked (Bosch, 2007). The purpose of ABS is to help maintain
directional stability and control during braking, and possibly reduce stopping distances on some
road surfaces, especially on wet roads.
24 Department of Infrastructure, Transport, Cities and Regional Development and CommunicationsYou can also read