Danish Greenhouse Gas Reduction Scenarios for 2020 and 2050 - February 2008 Prepared by Ea Energy Analyses Risø DTU
←
→
Page content transcription
If your browser does not render page correctly, please read the page content below
Danish Greenhouse Gas
Reduction Scenarios for 2020
and 2050

February 2008

Prepared by

Ea Energy Analyses

Risø DTU
ISBN: 978-87-7844-723-4

                          2
Content
PREFACE 6
SUMMARY AND CONCLUSIONS 7
SEVEN SCENARIOS FOR THE FUTURE 8
SCENARIO ECONOMICS 15
MEASURES 20
PLANNING, RESEARCH, DEVELOPMENT AND DEMONSTRATION 24
SAMMENFATNING OG KONKLUSIONER 25
SYV FREMTIDSBILLEDER 26
SCENARIERNES ØKONOMI 32
VIRKEMIDLER 39
PLANLÆGNING, FORSKNING, UDVIKLING OG DEMONSTRATION 43
1 INTRODUCTION 44
1.1 STRUCTURE 45
2 METHODOLOGY AND MAIN ASSUMPTIONS 46
2.1 SCENARIO METHODOLOGY 46
2.2 MODELLING TOOL 47
2.3 ECONOMIC ANALYSES 49
2.4 ECONOMIC GROWTH 51
2.5 GROWTH IN ENERGY SERVICES 52
2.6 FUEL PRICES 53
2.7 CO2-PRICE 54
2.8 TECHNOLOGY DATA 54
2.9 ENERGY RESOURCES 55
3 DANISH GREENHOUSE GAS EMISSION 58
3.1 GREENHOUSE GAS SOURCES 58
4 SCENARIOS FOR 2020 60
4.1 MAIN RESULTS 60
4.2 ENERGY SAVINGS MEASURES 65
4.3 MEASURES IN THE TRANSPORT SECTOR 68
4.4 SUPPLY SIDE MEASURES 73
4.5 INFRASTRUCTURE 76
4.6 MEASURES IN THE AGRICULTURAL SECTOR 77
4.7 MEASURES IN OTHER SECTORS 78
4.8 RESEARCH, DEVELOPMENT & DEMONSTRATION 79
5 SCENARIOS FOR 2050 81
5.1 MAIN RESULTS 81
5.2 ENERGY SAVINGS MEASURES 86
5.3 MEASURES IN THE TRANSPORT SECTOR 89
5.4 SUPPLY SIDE MEASURES 91
5.5 INTEGRATION OF WIND POWER 91
5.6 MEASURES IN THE AGRICULTURAL SECTOR 93
5.7 RESEARCH, DEVELOPMENT & DEMONSTRATION 93
36 REFERENCES 95
6.1 TRANSPORT TECHNOLOGIES 96
7 APPENDIX 97
TECHNOLOGY DATA – ENERGY PRODUCTION TECHNOLOGIES 97
45
Preface

In the autumn of 2006 and the spring of 2007, Ea Energy Analyses and Risø DTU
developed a number of greenhouse gas emissions reduction scenarios for Denmark for
2020 and 2050 for the Danish Environmental Protection Agency (DEPA).

During the autumn of 2007 and January-February 2008 the scenarios have been
revised, primarily in order to coordinate the assumptions of the reference projections
for 2020 with the Danish Energy Authority. These adjustments have been made in a
close collaboration with DEPA and the Danish Energy Authority.

The work was carried out by the following team:

    -   Kenneth Karlsson, Risø DTU
    -   Kaj Jørgensen, Risø DTU
    -   Jesper Werling, Ea Energy Analyses
    -   Helge Ørsted Pedersen, Ea Energy Analyses
    -   Anders Kofoed-Wiuff, Ea Energy Analyses

The work has been followed by a project steering group with representatives from
Danish Environmental Protection Agency, Danish Energy Authority and Danish
Ministry of Finance.

The consultancy report is made by Ea Energy Analyses and RISØ DTU, which are the
only responsible for possible errors and omissions and for the method, analysis,
assessments and conclusions in the report.

                                                                                         6
Summary and conclusions
The aim of the present project is to develop scenarios for reducing Danish greenhouse
gas emissions in 2020 and 2050. The scenarios are to provide a basis for estimating
which technologies should be combined in order to obtain future reductions in
greenhouse gas emissions in a cost-effective way.
The scenarios in this project include all emissions of greenhouse gases from
agriculture, industry and oil extraction activities in the North Sea as well as the
transport and energy sectors. Foreign air and sea carriage is not included because
emissions related to such activities are not yet subject to international climate change
agreements.
The scenarios focus particularly on the technological possibilities and the necessary
system changes in the Danish energy system and transport sector. Parallel to this,
COWI has carried out analyses for the Danish Environmental Protection Agency
focussing primarily on the reduction potentials in the transport sector and other
emissions (Miljøstyrelsen/COWI, 2007). COWI’s results regarding agriculture and
other emissions have been included in this analysis.
Two timeframes are applied in the scenarios: the medium term, 2020, and the long
term, 2050. For each timeframe, we have set up indicative targets that the scenarios
must reach:
• 2020: 30 and 40 per cent reduction in greenhouse gas emissions compared to
1990
• 2050: 60 and 80 per cent reduction in greenhouse gas emissions compared to
1990
The scenarios for 2020 focus primarily on technologies that are already commercially
available, whereas the scenarios for 2050 also examine technological options at the
experimental or developmental stage. This includes hydrogen technologies and fuel
cells as well as CO2 capture and sequestration (CCS) technologies.
The scenarios should be seen in connection with the EU objectives of a 20-30 per cent
reduction in greenhouse gas emissions in 2020 and 60-80 per cent in 2050 compared
to 1990. The EU’s 30 per cent objective is contingent upon global efforts to reduce the
world’s greenhouse gas emissions, implying that other countries such as the US,
China, India and others will undertake the obligation to reduce emissions in a global
climate change agreement for the period after 2012.
The analyses in the present project have profited from the scenarios, tools and data
used in connection with the project “The Future Danish Energy System” by the
Danish Board of Technology. In 2004, the Danish Board of Technology invited a
broad range of representatives from the major players in the energy sector, as well as
researchers, NGOs and the Danish Parliament to participate in an investigation of
possible ways forward for the Danish energy system. The cornerstone of this project
was a so-called “Future Panel” comprising of members from the all-party
parliamentary committee on energy policy.
7In the above-mentioned project for the Danish Board of Technology, the scenarios
focussed on two concrete targets for 2025: to halve CO2 emissions compared to 1990
and to reduce oil consumption by 50 per cent compared to the present level.
The project showed that by combining different technology specific measures in a so-
called “combination scenario” both targets can be reached. In the combination
scenario, the most important measures were more energy savings, increased use of
wind power and domestic biomass resources in the energy sector, electric/hybrid
vehicles and biofuels as well as better fuel efficiency in the transport sector. 1
In the present project the baseline projection for 2020 has been adjusted in order to
correlate as closely possible to the latest baseline made by the Danish Energy
Authority in January 2008.
The Danish background
The developments in the Danish gross energy consumption over the last 35 years is
shown in Figure 1. In spite of significant economic growth it has been possible to
maintain the gross energy consumption at a reasonably constant level (see Figure 1).
At the same time, the actual CO2 emission from the energy sector (excluding
transport) decreased by 19 per cent from 1990 to 2005. If foreign trade in electricity
and seasonal variations in temperature are taken into account the decrease is 30 per
cent. The most important tools in achieving this have been the insulation of buildings
and improved fuel efficiency, particularly through co-generation of electricity and
heat. The share of renewable energy has also grown and now covers 16 per cent of
gross energy needs. At the same time, Denmark has succeeded in developing its
energy system so that wind power covers almost 20 per cent of the present electricity
consumption. 2
PJ
1 000
900
800
natural gas
700
600
RE
500 coal
400
300
200
100
oil
-
2
6
8
0
2
4
6
8
0
2
4
6
8
0
2
4
97
97
97
98
98
98
98
98
99
99
99
99
99
00
00
00
1
1
1
1
1
1
1
1
1
1
1
1
1
2
2
2
Figure 1: Trends in Danish gross energy consumption (1972-2004). Foreign air and sea
carriage is not included.
Seven scenarios for the future
In the present project, seven different scenarios for the future have been analysed. This
includes two reference forecasts for 2020 and 2050 respectively (see Table 1). All
1
The Danish Board of Technology 2006.
2
Danish Energy Authority: Energy Statistics 2006.
8scenarios assume the same economic growth rate (approx. 1.9 per cent p.a.) and the
same increase in the demand for energy services 3.
Increased use of renewable energy, improved efficiency and energy savings are the
central measures in the reference scenarios and the reduction scenarios.
The references are used as a basis of comparison for the reduction scenarios. In the
references, continued active efforts as regards energy savings, improved energy
efficiency and renewable energy are presumed. It is thus assumed that the energy
savings initiatives set out in the Danish government’s action plan from 2005 4 are
continued. This implies that the end consumption of energy, excluding transport,
declines slightly from 450 PJ in 2006 to approx. 435 PJ in 2020 5. The end
consumption of energy reflects the energy consumption by the end consumers of the
private and public sectors as well as of households.
To reach an end-use of 435 PJ in 2020, savings of approx. 1.6 per cent per year in the
end consumption of energy (excl. the transport sector) must be implemented. Without
efficiency improvements and energy saving measures, end consumption would
increase to approx. 567 PJ in 2020.
After 2020, the end consumption of energy in the reference scenario rises and in 2050
it is 608 PJ. However, this development implies continued savings, because the end
consumption of energy on the demand side would have risen to nearly 900 PJ in 2050
if no savings measures had been implemented.
In the reduction scenarios, further savings measures are implemented on the basis of
the technical savings potentials stated in the background material for the Danish
Energy Authority’s energy savings plan from 2005. In all reduction scenarios, the
savings efforts are greater than in the reference scenarios.
In the transport sector, it is assumed that more fuel-efficient means of transport are
used in 2020 in all the scenarios. In the reference, it is assumed that the fuel efficiency
of the fleet of cars is improved by 10 per cent compared to the present level due to
more rigorous international requirements. In the most ambitious reduction scenario, an
improvement of 20-25 per cent is assumed thanks to a combination of national and
international measures. This corresponds to CO2 emission of 125-130 g/km for an
average car in 2020 compared to approx. 170 g-CO2/km today. By way of comparison,
the EU Commission has suggested a binding agreement with the European motor
industry on a maximum average emission from new cars of 130g CO2/km in 2012.
Furthermore, biofuels and electric/hybrid cars are introduced in the scenarios at
various levels of ambition.
In 2050, hydrogen and electric car technologies are expected to be fully
commercialised, playing an important role in all the reduction scenarios. In the 80 per
cent reduction scenario focussing particularly on the use of renewable energy, all
conventional oil-based fuels have been phased out of the transport sector. Moreover,
the fuel efficiency in conventional cars equipped with combustion engines is assumed
3
Cf. the Danish Energy Authority 2005: Fremskrivninger inkl. en styrket
energibesparelsesindsats som følge af aftalen af 10. juni 2005 (Projections including enhanced
energy savings efforts as a consequence of the agreement of 10 June 2005)
4
For the period 2006-2013, the energy savings agreement lays down a target according to
which the annual effect of the energy savings activities must correspond to 1.7 per cent of the
energy consumption in 2003.
5
End consumption reflects the energy supplied to the end consumers, which means private and
public trades and households.
9to have improved noticeably in the reduction scenarios (50-60 per cent compared to
the present level, corresponding to 75g CO2/km).
Although electricity consumption is expected to increase from well over 36 TWh
today to just under 40 TWh in 2020, fuel consumption for electricity and district
heating production decreases from 369 PJ 6 in 2006 to 339 PJ in the reference for 2020.
The reason is that the small-scale gas-fired power plants are assumed to be replaced by
new, more efficient plants (Best Available Technology).
Moreover, three large coal-fired power plant units (Asnæs Unit 5, Studstrup Unit 4
and Ensted Unit 3) are assumed to be refurbished. In this connection is assumed that
their electric efficiency increases and that the plants are prepared for up to 50 per cent
co-firing with biomass..
Generally, it is assumed that investors in the electricity sector make their investments
expecting that fuel prices will not get any lower than today and that CO2 has a market
value. If investors act on the basis of a short timeframe, there is a risk that the above-
mentioned fuel savings potential will not be realised. The assumption that the “Best
Available Technology” is used means that the average electricity efficiency will
increase from just below 35 per cent today to almost 40 per cent in the reference for
2020.
It should be stressed, that the scenarios focus on domestic electricity supply only and
therefore it is assumed in the calculations that there is no exchange of electricity with
neighbouring countries apart from export of surplus wind power in some of the
scenarios. 7 In the real world Danish power producers compete against producers in
neighbouring countries and therefore their generation will depend on their
competitiveness. Yearly variations in production from the Nordic hydro power plants
does among other things determine the need for production at Danish power plants. In
dry years Danish power plants will generate more to compensate for the lacking hydro
power and vice versa. Sector specific models such as Balmorel are capable of
modelling this relationship with a high level of detail. On average Denmark
experienced a net export of 3 TWh per annum during the last 10 years (1997-2006).
The actual exchange of electricity with neighbouring countries will affect the CO2-
emissions from the sector in the scenarios, but not the chance of complying with
international reduction targets since the power sector is covered by the present EU
emissions trading scheme. This implies that the generators each year are obliged to
deliver quotas to the Danish state corresponding to their emissions.
In the reduction scenarios, wind power and biomass become central measures on the
supply side. In 2020, 40 per cent of electricity consumption is covered by wind power
in the most ambitious scenario, and in 2050 wind power accounts for as much as 70
per cent of total electricity production in the 80 percent reduction scenario focusing on
renewable energy. In this respect the transport sector will have a central role as storage
for wind power – either in the batteries of the cars or in caverns as a part of the overall
hydrogen infrastructure in 2050.
In one of the scenarios for 2050 CCS (carbon capture and storage) technologies are
incorporated as a possibility, including depositing CO2 in geological layers after it has
been captured at central power plants. However, a number of important barriers
related to CO2 storage need to be clarified before this technology can be used full-
6 Including wind power and corrected for variations in climate and electricity exchange (Danish
Energy Authority 2007, Energistatistik 2006)
7
In 2004, Denmark had a net electricity export of approx. 10 PJ. In 2005, there was an import
of 5 PJ.
10scale in the future. For example CCS technologies have high investment costs and
large energy consumption for capturing CO2, which is expected to result in a loss of 8-
10 percentage points of electric efficiency. In addition, even if the risk of seepage
from carefully selected storage sites is considered to be negligible, the risk of leakage
in connection with extraction, transport and storage processes is considerable.
Furthermore, it is generally difficult to carry out long-term monitoring of leakage from
storage sites under the seabed, since current satellite technologies cannot 'see through
water'. In the CCS scenario, CO2 capture technologies are installed at both coal-fired
and biomass-fired power plants. The latter will thus contribute to a net reduction of
CO2 emissions.
2020 2050
Reference Combi-30% Combi-40% Reference Red.- 60% Red.- 80%- Red.- 80%-
RE CCS
Energy 1.6% p.a. 2.7% p.a. 2.7% p.a. 0.8% p.a. 1.5% p.a. 1.7% p.a. 1.5% p.a.
savings**
435 PJ 363 PJ 363 PJ 609 PJ 448 PJ 409 PJ 448 PJ
Transport +10% +10% +20-25% Approx. +15% +50-60% +50-60% +50-60%
efficiency*** 150 g CO2/km 150 g CO2/km 125-130 g 140 g CO2/km Approx. 75 g Approx. 75 g Approx. 75g
CO2/km CO2/km CO2/km CO2/km
Transport 8 % bio. 10% bio 15% bio 10% bio 45% el 55% el 45% el
fuels/techs.**** 5% el 10% el 5% el 20% h2 35% h2 35% h2
10% bio 10% bio 10% bio
Renewable 21% 30% 39% 20% 75% 100% 58%
energy share of
gross energy
Electricity Continuation of More RE Considerably Continuation of Considerably Pure RE RE+CCS*****
supply present system 35% wind more RE present system more RE 70% wind 50% wind
18% wind 22% bio/waste 40% wind 20% wind 60% wind, 27% bio/waste 16% bio/waste
15% bio/waste 31% bio/waste 11% bio/waste 22% bio/waste 2% solar 1% solar
2% solar 1% wave 1 % wave
2% wave 37% CCS
Need for 0 PJ 0 PJ 42 PJ 0 PJ 137 PJ 211 PJ 99 PJ
biomass import
Agriculture NERI forecast to NERI forecast to NERI forecast to NERI forecast to NERI forecast NERI forecast NERI forecast
2020 2020 2020 2030* to 2030* to 2030* to 2030*
Table 1: Overview of the analysed scenarios
* NERI (National Environmental Research Institute) projections are only available up till 2030.
Emissions from agriculture are assumed to remain unchanged in the remaining period 2030-
2050. ** End consumption of energy excluding transport. *** average efficiency of the car fleet.
**** Share of transport work by cars. Bioethanol is assumed to be produced by means of
second generation technology. ***** CCS technologies are used on coal fired plants as well as
on biomass fired plants. The latter therefore lead to a net reduction of CO2.
Figure 2 gives an overview of total gross energy consumption in the scenarios.
Compared to the present energy system, gross energy consumption remains more or
less constant in the reference for 2020, while it increases considerably towards 2050.
However, in all reduction scenarios gross energy consumption decreases
significantly. 8
Today, renewable energy covers approx. 16 per cent of gross energy consumption. In
the reference for 2020, this share rises to 21 per cent, in the 30 per cent reduction
scenario to 30 per cent and in the 40 per cent reduction scenario to 39 per cent. In the
scenarios for 2050, the share of renewable energy increases even further, so that
renewable energy covers approx. 75 per cent of total energy consumption in the 60 per
cent reduction scenario and 58 per cent in the 80 per cent reduction scenario applying
CCS technologies. In the 80 per cent RE scenario, fossil fuels are phased out and fully
replaced by renewables.
8
Due to the model’s simplification of the energy system, historical figures and the results of
the model are, however, not completely comparable. Minor deviations might occur as the
model makes a slightly simplified optimisation of the energy system.
11In the 100 per cent RE scenario for 2050, it is necessary to import considerable
amounts of biomass if it is assumed that the Danish biomass resources for energy
purposes are of the same size as today. In this scenario, about 300 PJ of biomass is
used (excl. waste and biogas) whereas the present total resource of wood wastes and
straw for energy purposes is just under 90 PJ (including biomass from waste land). It
will probably be necessary to import a large part of the missing biomass resources
from countries outside Europe. Alternatively, Denmark must import a large part of its
electricity consumption from neighbouring countries.
If Denmark were to cover its energy consumption with domestic resources only, it
would be necessary to increase the use of wind power further or include large amounts
of solar energy, wave power and geothermal energy. Photovoltaics and wave power
only play a small role in the reduction scenarios because there is a significant degree
of uncertainty as to whether these technologies will be competitive with wind power
and biomass in 2050.
The larger total energy consumption in the CCS scenario, compared to the other
reduction scenarios, is due to the additional energy consumption used to separate CO2
from flue gas at power plants.
PJ/year
Gross energy consumption Other RE
Waste
1100 Biogas
Biomass
1000 Wind
Natural gas
900 Coal
Oil
800
700
600
500
400
300
200
100
0
200
5
202
0
_20
20
_20
20 205
0
_20
50 050 _20
50
nce 0% 0% n ce % S_2 E
fere mb
i3
mb
i4 fere d60 -C C %-R
Re Co Co Re Re 80% d80
Red Re
Figure 2: Gross energy consumption in 2005, and in the scenarios for 2020 and 2050. Other RE
includes production based on solar energy, photo-voltaics, geothermal energy and wave power.
The energy consumption in the scenarios has been converted into CO2 emissions on
the basis of the greenhouse gas emission factors of the fuels. Emissions from
agriculture (primarily methane and N2O) and from industrial processes etc have been
added to this.
The emissions from agriculture are based on a projection of emissions up to 2030,
made by the Danish National Environmental Research Institute (NERI, 2007). Over
the period 2030-2050, emissions from agriculture are reduced by just below 2 Mt from
10.4 Mt to 8.7 Mt. In the period 2030-2050, emissions are assumed to be unchanged.
The agricultural sector has not been subject to analyses of reduction potentials in this
project. However, in parallel to this project, COWI has analysed the reduction
potentials and costs in the agricultural sector. According to COWI, it is possible to
reduce emissions from agriculture by a further 4.8 Mt, and emissions from industrial
12processes and waste/sewage can be reduced by 50 per cent (a reduction of approx. 1.4
Mt) (Danish Environmental Protection Agency/COWI, 2007).
Figure 3 shows the historical emissions of greenhouse gasses in 1990 and 2005
compared to the emissions in the seven scenarios of the future. It should be noted that
the figures for 1990 are based on actual emissions. Today, emissions from the energy
and transport sectors account for more than 70 per cent of the total emissions – and in
the scenarios, reduction measures are implemented particularly in these two sectors.
The total greenhouse gas emission in the reference for 2020 is approx. 60 Mt, which is
5 Mt more than the Danish Kyoto objective for 2008-2012. This corresponds to a
reduction of just under 14 per cent compared to 1990.
In the reduction scenarios for 2020, the emission of greenhouse gasses is reduced to
47 Mt (Combi30%) and 39 Mt (Combi40%) respectively.
In 2050, it is only in the 100 per cent RE scenario that an 80 per cent reduction of the
emissions - corresponding to a total emission of just under 14 Mt CO2 equivalents - is
obtained. However, the CCS scenario is close to attaining the target, and by use of
further reduction measures within agriculture, for example, the 80 per cent objective
can be achieved.
mill. tonnes CO2 Greenhouse gas emissions (CO2-eqv.)
80
wastewater
70
landfill
60
F-gasses
industrial gasses
50
agriculture
oil/gas extraction
40 transport
energy purposes
30
20
10
0
1990 2005 20 020 020 50 0 0 2050
e 20 %_2 %_2 e 20 _205 _205 -RE_
renc bi30 bi40 renc Red
60% -CCS 80%
Refe Com Com Refe 80% Red
-10 Red
Figure 3: Greenhouse gas emissions in 1990 and 2005 (actual emissions) and in the scenarios
for 2020 and 2050. The Danish Kyoto objective for the period 2008-12 is indicated by a broken
line.
13Greenhouse gas sources
Energy purposes include emissions from electricity and heat production as
well as other emissions from private households and industry, including the
internal transport within industry, forestry, agriculture and fisheries.
The transport sector includes both passenger transport and conveyance of
goods. Foreign air and sea carriage is not included in the analyses.
The agricultural sector’s emissions are primarily related to methane from
animal digestion and from handling of manure as well as to N2O from
nitrogenous fertilisers in the fields.
Industrial gasses cover non energy-related CO2 from processes in industry
(chemical, cement and metal industry) and from solvents
F-gasses are HFC, PFC and SF6. The F-gasses are mainly used as a refrigerant
in refrigerating plants and as insulating foam for various purposes. F-gasses
have a far larger greenhouse gas effect than CO2 – for example, 1 kg HFC
corresponds to 1,300 kg CO2.
Emissions from oil/gas extraction cover the energy consumption for extraction
and flaring of natural gas.
Emissions from rubbish dumps and cleaning of sewage.
CO2 emissions from oil and gas recovery activities in the North Sea are expected to
increase from approx. 2 Mt today to approx. 3.1 Mt in 2020 according to the Danish
Energy Authority. This increase is due to a continued high level of production and
increased energy consumption for extraction as the fields get older. This includes
increased use of gas for water injection and gas compression. The increase is to some
extent moderated by an expected improvement of efficiency over time in connection
with integration of new technology with higher efficiency (Best Available
Technology) In 2050 it is assumed that oil and gas are no longer extracted from the
fields in the North Sea (cf. Figure 4.)
Figure 4: The Danish government’s production forecasts for Dansk Undergrunds Consortium
(DUC) 9.
In the scenarios for 2050, emissions are reduced to a level between 12 Mt (80 per cent
reduction scenario with RE) and 26 Mt (60 per cent reduction scenario). In the 100 per
cent RE scenario, the emission of greenhouse gasses from the energy sector is limited
to approx. 1 Mt. The remaining emission is mainly due to the fact that household
waste contains a fossil fraction (plastic etc.) that is burnt during waste handling.
9
Cf., Økonomi- og erhvervsministeren 2003: Redegørelse til Folketinget vedrørende
Nordsøen (Statement on the North Sea to the Parliament by the Minister for Economic and
Business Affairs, from 2003).
14Scenario economics
The economics of the scenarios are calculated as the annualised value of the entire
energy system in the scenario years 2020 and 2050 respectively. It should be stressed
that it is the annual costs in the two specific years, 2020 and 2050, which are
determined. The annual costs cannot be expected to be constant within the periods
2008-2020 and 2020-2050. The average annual capital costs as well as costs for fuels,
operation and maintenance are shown. The outcome is a simplified welfare-economic
calculation, which does not take into consideration possible tax distortion elements,
other environmental externalities than greenhouse gases (e.g. NOx, SO2 and particles),
the value of security of supply and the so-called net tax factor. This financial
calculation makes a relative comparison of scenarios and references possible. The
calculations are made in fixed 2006 prices, and the discount rate is set at 6 per cent on
the basis of the recommendations of the Danish Ministry of Finance regarding socio-
economic calculations.
Figure 5 shows the additional annual costs of the scenarios compared to the
references. Annual costs are distributed on fuel costs, CO2-costs, operation and
maintenance costs and capital costs related to investments. Moreover, the total
additional costs are illustrated, which is the sum of the previously mentioned cost
elements.
Fuel costs are generally reduced in the reduction scenarios whereas investment costs
increase. Also operation costs increase in all reduction scenarios, partly due to the fact
that it is more demanding to handle biomass, biogas and waste than fossil fuels.
The comparison in Figure 5 assumes an oil price of $57/barrel in 2020 and $75/barrel
in 2050, and a CO2 quota price of DKK 175/tonne. An oil price of $57/barrel in 2020
corresponds to the latest projection made by the International Energy Agency in
World Energy Outlook 2007. The IEA has not made fuel price projections for 2050 in
World Energy Outlook 2007. As oil is expected to become a more and more scarce
resource a higher oil price of 75 $/barrel is assumed in 2050.
The financial calculations indicate that at the assumed CO2 and fuel prices, CO2
storage is a more cost effective measure than aiming for 100 per cent renewable
energy. However, as previously mentioned, the economics of CO2 storage
technologies are connected with a significant level of uncertainty as large-scale plants
are still in the demonstration phase. Moreover, a number of security, environmental
and liability issues have not yet been clarified.
On the whole, large uncertainties are connected with estimating long-term costs of
operating an energy system. Not only the investment costs of the technologies may
change significantly over more than 40 years – also fuel costs may depart considerably
from the assumptions made in this report. This is illustrated in Figure 6 and Figure 7
showing the relative costs of the scenarios at an oil price of $35/barrel and $100/barrel
respectively. At an oil price level of $100/barrel, all scenarios are less expensive than
the corresponding references.
The sensitivity analyses show the consequences of investing in specific energy
producing technologies and transport technologies under different fuel price
assumptions. It should be stressed, that the sensitivity analyses are static, in the sense,
that the total fuel consumption and its composition is assumed to be unchanged
regardless of the fuel prices examined. For example, the dispatching of power plants is
15not changing according to fuel prices and consumers do not reduce their demand for
transportation at higher fuel prices.
As previously mentioned security of supply (e.g. in the form of failing fuel supplies)
and other environmental and health costs (e.g. air pollution) are not valued in this
study. Compared to the reference, the consumption of fossil fuels is brought down in
all reduction scenarios, and a gain in the form of lower environmental and health costs
as well as a more reliable supply may therefore be expected in this connection. On the
other hand the report has not assessed how the additional investments in the scenarios
should be financed and how economic incentives should be structured. There may be
significant transactions costs related to make players in the energy markets (including
energy consumers) pick the solutions envisaged in the scenarios. Moreover, publicly
financed economic incentives may lead to distortion losses, which have not been
quantified. Finally the costs of investments may prove to be higher or lower than
estimated.
The scenarios cover a range of measures on the demand side as well as the supply side
and in the transport sector that must been seen as a whole. Measures that may seem
relatively expensive when considered individually (e.g. heat pumps at CHP plants or
electricity-based cars) may be advantageous in interaction with other measures (e.g.
wind power). It has not been possible to estimate the marginal costs of individual
initiatives within this project.
Additional annual costs of reduction scenarios
2020: 57 $/bbl
mill. DKK. pr. 2050: 75 $/bbl
annum
50,000
40,000 Combi30%_2020
Combi40%_2020
30,000 Red60%_2050
Red80%-RE_2050
20,000 Red80%-CCS_2050
10,000
0
Fuel CO2 O&M Capital Total
-10,000
-20,000
-30,000
-40,000
-50,000
Figure 5: Annualised additional costs of the scenarios compared to the reference at the same
time. An oil price of $57/barrel in 2020 and $75/barrel in 2050 has been assumed. The
calculations also include a CO2 quota price of DKK 175/tonne. A discount rate of 6 per cent is
used. Please note that the costs have not been discounted to today’s value.
16Additional annual costs of reduction scenarios
Low fuel prices - 35 $/barrel
mill. DKK. pr.
annum
50,000
Combi30%_2020
40,000 Combi40%_2020
Red60%_2050
30,000 Red80%-RE_2050
Red80%-CCS_2050
20,000
10,000
0
Fuel CO2 O&M Capital Total
-10,000
-20,000
-30,000
-40,000
-50,000
Figure 6: Sensitivity analysis. Annualised additional costs of the scenarios compared to the
reference at the same time. An oil price of $35/barrel in 2020 and 2050 has been assumed. The
prices of gas, coal and biomass are assumed to match the oil price to some extent. The
calculations also include a CO2 quota price of DKK 175/tonne. A discount rate of 6 per cent is
used. Please note that the costs have not been discounted to today’s value.
Additional annual costs of reduction scenarios
High fuel prices - 100 $/barrel
mill. DKK. pr.
annum
50,000
Combi30%_2020
40,000 Combi40%_2020
Red60%_2050
30,000 Red80%-RE_2050
Red80%-CCS_2050
20,000
10,000
0
Fuel CO2 O&M Capital Total
-10,000
-20,000
-30,000
-40,000
-50,000
Figure 7: Sensitivity analysis. Annualised additional costs of the scenarios compared to the
reference at the same time. An oil price of $100/barrel in 2020 and 2050 has been assumed.
The prices of gas, coal and biomass are assumed to match the oil price to some extent. The
calculations also include a CO2 quota price of DKK 175/tonne. A discount rate of 6 per cent is
used. Please note that the costs have not been discounted to today’s value.
17Sensitivity analysis with 3 per cent discount rate
If a discount rate of 3 per cent is used as opposed to 6 per cent in the base case, the
economy of the scenarios is improved relatively to the reference projections (Figure
8). This is due to the fact that the reduction scenarios comprise greater investments in
production technologies, vehicles and energy savings.
Additional annual costs of reduction scenarios
2020: 57$/bbl, 2050: 75$/bbl
mill. DKK. pr. Discount rate 3 %
annum
50,000
40,000
Combi30%_2020
Combi40%_2020
30,000 Red60%_2050
Red80%-RE_2050
20,000 Red80%-CCS_2050
10,000
0
Fuel CO2 O&M Capital Total
-10,000
-20,000
-30,000
-40,000
-50,000
Figure 8: Sensitivity analysis – 3 % discount rate. Annualised additional costs of the scenarios
compared to the reference at the same time. An oil price of $57/barrel in 2020 and $75/barrel
2050 is assumed. The prices of gas, coal and biomass are assumed to match the oil price to
some extent. The calculations also include a CO2 quota price of DKK 175/tonne. Please note
that the costs have not been discounted to today’s value.
Sensitivity analysis – higher costs of energy savings
Estimating the costs of undertaking energy savings in industry, households and
trade/service sectors is associated with a high degree of uncertainty. Depending on the
specific energy services in question the investment costs are estimated to range
between 10 and 150 DKK per GJ per year (75 DKK/GJ on average in 2020). To this 5
DKK/GJ per year has been added to all types of energy savings in order to represent
transaction costs associated with the implementation of the needed policy measures,
for example costs of informing consumers and companies about the benefits of
implementing energy savings.
In the Combi-30% and Combi40% scenarios for 2020 the total additional annual costs
related energy savings have been estimated to 5.760 M DKK, of which 360 M DKK
are attributed to the implementation of policy measures.
Due to the uncertainty about the costs of promoting and undertaking energy savings a
sensitivity analysis is carried out assuming that the total costs of energy savings are
twice as high as in the base case.
It appears from Figure 8 that the costs of energy savings measures have a significant
impact on the economic results. Assuming saving costs are doubled all reduction
scenarios have higher costs than the reference projections.
18Additional annual costs of reduction scenarios
2020: 57$/bbl, 2050: 75$/bbl
mill. DKK. pr.
annum Double cost of energy savings
60,000
50,000
40,000
Combi30%_2020
30,000 Combi40%_2020
Red60%_2050
20,000 Red80%-RE_2050
Red80%-CCS_2050
10,000
0
Fuel CO2 O&M Capital Total
-10,000
-20,000
-30,000
-40,000
-50,000
Figure 9: Sensitivity analysis – double cost of energy savings. Annualised additional costs of the
scenarios compared to the reference at the same time. An oil price of $57/barrel in 2020 and 75
$/barrel 2050 is assumed. The prices of gas, coal and biomass are assumed to match the oil
price to some extent. The calculations also include a CO2 quota price of DKK 175/tonne. The
discount rate is 6 per cent. Please note that the costs have not been discounted to today’s
value.
CO2-abatement costs
The economics of the scenarios can also be expressed by their average CO2 abatement
costs. The average CO2 abatements costs are computed by dividing the additional
costs of the scenarios (without including a price of CO2) by their total CO2 reduction
compared to the reference. The average abatement costs are examined with the
reference fuel prices as well as the low (35 $/bbl) and high fuel price level (100 $/bbl),
see Table 2 below.
2020 2050
Fuel prices Combi30 Combi40 Red60% Red80% Red80%
% % RE CCS
Ref - 57/75 $/bbl 290 190 50 220 140
Low – 35 $/bbl 410 320 420 550 460
High - 100 $/bbl 70 -80 -190 10 -60
Table 2: Average CO2 reduction costs (DKK/tonne) in the reduction scenarios compared to the
references
With the exception of biogas plants, potentials and costs of reducing greenhouse gas
emissions from agriculture and from industrial processes and waste/sewage have not
been examined in this report. According to COWI (The Danish Environmental
Protection Agency/COWI, 2007) it is possible to reduce emissions by a total of 4 MT
through measures costing less than DKK 500/tonne in these sectors (biogas not
included). If more expensive measures are applied, emissions can be reduced by well
over 6 Mt.
19The reason why the average CO2 reduction costs are lower in the Combi40% scenario
than in the Combi30% scenario is in part that the fleet of cars is expected to become
more efficient in the Combi40% scenario – and that a number of motorists are
transferred to public transport and bicycling decreasing the car share of passenger
transport from 76 per cent to 69 per cent. The costs of these initiatives have not been
assessed, and they might require considerable political efforts in relation to car
producers, both nationally and internationally. If the Combi40% scenario is
implemented without these initiatives, the average CO2 reduction costs will rise to
approx. DKK 370/tonne under reference fuel prices.
Summary
Altogether, the additional costs in the reduction scenarios can be calculated to between
0.1 and 0.5 per cent of total GDP in the scenario years 2020 and 2050 respectively
when applying reference fuel prices (Table 3). These figures do not include a price on
CO2.
Taking into account the sensitivity analyses shown above the gap ranges from
-0.1 % to +0.5 % of GDP in 2020 corresponding to an interval of -300 to +1750
DKK/inhabitant per year. For the 2050 scenarios the gap stretches from -0.4 % to +1.4
% of GDP corresponding to somewhere between -1650 and +6200 DKK/inhabitant.
The development in fuel prices constitutes the greatest element of uncertainty.
2020 2050
Combi30% Combi40% Red60% Red80% Red80%
RE CCS
3.9 3.9 2.2 13.4 8.2
bn bn bn bn bn
0.2 % 0.2 % 0.1 % 0.5 % 0.3 %
of GDP of GDP of GDP of GDP of GDP
700 710 400 2400 1500
DKK/capita DKK/capita DKK/capita DKK/capita DKK/capita
Table 3: Total additional costs (DKK) per annum in the reduction scenarios compared to the
reference projections (without a CO2 price). Additional costs are also shown as share of GDP
and per capita. Reference fuel prices (57/75 $/bbl). Assuming 5.5 mill. inhabitants in Denmark in
2020 as well as in 2050.
Measures
The references presuppose that the existing energy policy is continued. This
means that the current energy savings efforts are continued, and that some
existing power plants are gradually replaced with new ones with higher fuel
efficiency or refurbished.
In order to realise the reduction scenarios – or elements of these – additional efforts
are needed in Denmark, in the EU and at global level. This will require long-term
targets for the energy and transport sectors as well as framework conditions and
measures that may contribute to pushing development in the desired direction. In that
connection, it is important to underline that the scenarios focus on the technical and
financial perspectives of the various technologies, and it has not been analysed in
detail which measures could or should be applied. Consequently, the effects of trade in
CO2 quotas, certificate systems, taxes and similar measures have not been examined
separately in the work with the scenarios.
Energy savings and improvement of energy efficiency are central elements in all
scenarios and require efforts in relation to buildings, industry and appliances. There is
a need for a continued effort both at EU level and at the national level in order to
20promote more energy efficient products. One example is dynamic minimum standards
for the energy efficiency of a number of products (white goods, engines, pumps,
boilers, computers, television sets, chargers, standby consumption etc.) within the
framework of the Eco-design Directive. Also the energy labelling requirements could
be extended to include more products in order to promote the best products in the
market.
To illustrate which potentials could be achieved by promoting best available
technology, the trend in the energy consumption of refrigerators and freezers is shown
in the figure below.
800
700
600
500
kWh/år
Køleskab
kWh/year
Refrigerator
400 Freezer
Fryser
300
200
100
0
nyt 1975
New 1975 nyt 1988
New 1988 nyt 2001
New 2001 Bedst
Best 06
2006
Figure 10: There is a great potential in consumers using the most efficient technologies.
Example: Energy consumption of new and old refrigerators and freezers.
In the building sector, there is a need to tighten up requirements for new construction
projects. In the 2020 scenario, in which the total emission of greenhouse gasses is
reduced by 40 per cent, the energy consumption for heating falls by approx. 30 per
cent. This is in part based on the assumption that all new houses are built as zero-
energy houses from 2015. In Figure 9, the energy consumption in an average Danish
building is compared to the requirements in the building regulations from 1982, 1995
and 2006. Furthermore, possible tightening of the building regulations for 2010 and
2015 as well as the low-energy concepts Bolig+ and Passivhaus are shown.
21Liters of oil per m2
Average
energy
consumptio
n in Danish
buildings
Figure 11: Energy consumption in Danish buildings. The average Danish building compared to
the requirements in the building regulations from 1982, 1995 and 2006. Furthermore, possible
tightening of the building regulations for 2010 and 2015 (low-energy class 2 and 1) as well as
10
the low-energy concepts Bolig+ and Passivhaus are shown.
However, the greater part of the savings is to be made in the existing housing stock.
This means that the requirements regarding renovation of existing buildings will be
further tightened through energy efficiency requirements in connection with
replacement of various parts of the building such as the roof, windows and boilers. A
central measure may also be the promotion of so-called ESCOs – Energy Service
Companies, for example on the basis of a common market in Europe for energy
savings certificates.
The transport sector is a special challenge because Denmark is to a large extent
dependent on common measures at international level – and particularly in the EU. In
the ambitious 40 per cent reduction scenario for 2020, it is assumed that the existing
fleet of cars exploits the fuels 20-25 per cent more efficiently than today. This
corresponds to an average emission of 125-130 g CO2/km from all cars in Denmark in
2020. By way of comparison the EU Commission has proposed a binding agreement
with the European motor industry according to which the emission from new cars is
not allowed to exceed an average of 130g CO2/km in 2012. In addition to this, the
Commission intends to find further reductions of 10g CO2/km by means of “other
technical improvements” and by increased use of biofuels. As the renewal of the car
fleet takes place gradually it may be necessary to introduce stricter minimum
requirements after 2012 in order to reach the efficiency target of the 40 per cent
reduction scenario.
10
Bolig+ houses will be energy neutral on a yearly basis due to their self-production of energy
from e.g. solar energy or photovoltaics. In the figure, the self-production is indicated as a
negative consumption.
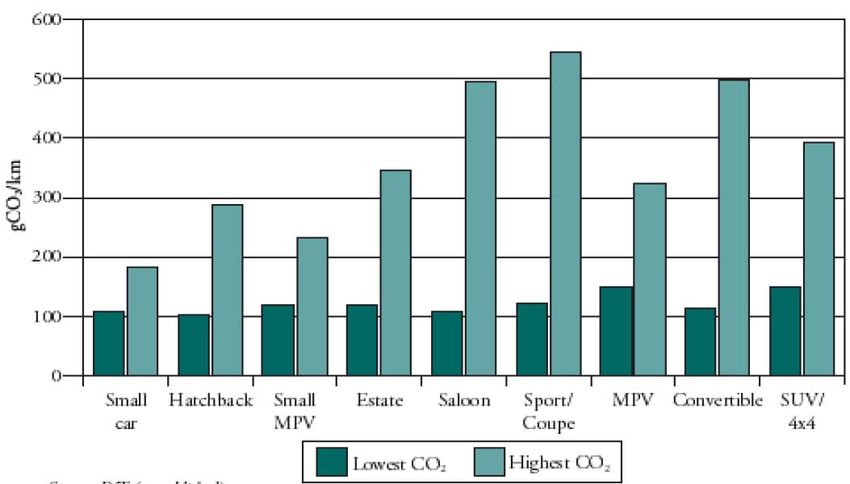
22Figure 12 shows the emissions from new cars in 2006 divided on different classes.
There appears to be a very large difference between the CO2-emissions within the
different classes. For all classes it is possible to find vehicles emitting less than 150 g
CO2/km. Simply by choosing the most efficient cars, that are already on the market
today, it should be possible to come very close to the efficiency target of the 40
percent reduction scenario in 2020.
Figure 12: Emissions from different classes of new Cars in 2006 (MPV: Multi Purpose Vehicle,
SUV: sport utility vehicle (Source: Mullin 2007, King Review: Potential for CO2 reductions in the
road transport sector. Study presented at STOA-workshop in the European Parliament 20
November 2007)
In the scenarios, it has not been decided if fuel efficiency should be improved through
ambitious EU agreements with the motor industry, through direct regulation with fixed
minimum requirements for the energy efficiency of new passenger cars and delivery
vans (more km per litre) or by means of other measures.
Large CO2 and fuel reductions can also be gained by improving the passenger
utilization rate of cars. Today there is on average of 1.5 passengers in a car, but in
2020 this figure is expected to decrease to 1.3 passengers per car in 2020. If measures
are implemented to prevent this development, approx. 17 PJ of fuel and 1.2 Mt of CO2
can be saved (approx. 8 % of emissions from the transport sector).
As previously mentioned, foreign air and sea carriage is not included in the scenarios.
In the 2050 reduction scenarios, a further improvement of the vehicles’ energy
consumption corresponding to a CO2 emission of approx. 75 g/km (well over 30 km/l)
is assumed. This implies that the cars become roughly twice as efficient as new cars
today. In 2050, however, the main part of the fleet of cars in the reduction scenarios
has been replaced by electricity or hydrogen-powered cars.
The massive expansion of wind power assumed in the scenarios will increase the need
for a long-term plan of action for installation of offshore wind farms and
corresponding infrastructure. It would be appropriate to coordinate the plans with
Denmark’s neighbouring countries in order to ensure a coherent expansion of the
electricity infrastructure. On the supply side, it will also be necessary to create suitable
23framework conditions for the construction of new efficient biomass and biogas plants.
Moreover, incentives are required to ensure a higher use of biomass at existing central
power plants. A key challenge will be to ensure the cost effectiveness of the measures
while at the same time offering investors sufficient security for their investments. One
way to do this is to ensure stable framework conditions.
As regards the future infrastructure, it should be analysed which roles the district
heating and natural gas systems should have. When the energy consumption for
heating is reduced and the share of wind power is increased, the basis for district
heating will decrease in many places. On the other hand the district heating system
provides a valuable storage medium for integrating wind power through the use of
electric boilers and heat pumps. It is important to clarify in which areas district heating
should be given priority, how energy losses from district heating can be reduced and
how energy efficiency can be further improved by dynamic use of heat pumps,
geothermal energy and district cooling. Also the cost and benefits of having larger
heat storage facilities in relation to district heating should be analysed. Similarly it will
become important to clarify the future role of the natural gas infrastructure, which was
established in Denmark in the 1980’es.
Planning, research, development and demonstration
There is a need for continued targeted research efforts as well as commitment to
technological development that are adjusted on an ongoing basis according to long-
term political goals. Moreover, the research and development activities should be
focussed on the areas in which Denmark has a particular potential for promoting new
energy technology solutions for energy savings, improvement of energy efficiency and
RE. Efforts should also be made to make EU research activities reflect long-term
Danish priorities.
Denmark could play a special role as the EU’s ”test lab” for the flexible energy system
of the future, based on the principles of the market. This implies a system in which
consumers play a far more active role than today in creating coherence in the system,
and where the possibilities that lie in information technologies for communication
between market players and appliances are fully exploited. Important elements
comprise flexible district heating systems with electricity-powered heat pumps,
components for electricity/hydrogen cars (intelligent recharging in relation to needs of
both the electricity system and the motorist) and, not least, activation of other demand
response from consumers and industry.
For Denmark, energy technologies represent a great industrial potential. As a
consequence of the Danish energy policy commitments since the 1980s, the energy
sector contributes considerably to economic growth and employment in Denmark. The
export of Danish energy technology calculated in current prices has developed from
approx. DKK 17 bn in 1996 to DKK 46 bn in 2006.
The global market for pollution control technologies is estimated at DKK 4,100 bn
with an annual growth of approx. 5 per cent according to the Danish government’s
strategy to promote eco-efficient technology. 11 A strengthened and coordinated effort
within the energy sector would contribute to maintaining and expanding Denmark’s
position in the market.
11
The Danish Government 2006: Promoting Eco-efficient Technology.
24Sammenfatning og konklusioner
Formålet med dette projekt er at opstille scenarier for, hvordan Danmarks udledning af
drivhusgasser kan reduceres i 2020 og 2050. Scenarierne skal tilvejebringe et grundlag
for at vurdere, hvilke kombinationer af teknologier der er nødvendige for at opnå
fremtidige drivhusgasreduktioner på en omkostningseffektiv måde.
Scenarierne i dette projekt omfatter alle emissioner af drivhusgasser fra landbrug,
industri og indvindingsaktiviteter i Nordsøen, samt fra transport- og energisektoren,
dog ikke udenrigs luft- og søtransport, da emissioner herfra ikke på nuværende
tidspunkt er omfattet af internationale klimaaftaler.
Scenarierne har særlig fokus på de teknologiske muligheder og systemændringer, der
er nødvendige i det danske energisystem og på transportområdet i Danmark. COWI
har parallelt hermed gennemført analyser for Miljøstyrelsen, der primært fokuserer på
reduktionspotentialer inden for transportsektoren og andre emissioner
(Miljøstyrelsen/COWI, 2007). COWIs potentiale- og omkostningsopgørelser vedr.
landbrug og øvrige emissioner er inddraget i denne analyse.
I scenarierne arbejdes med to tidshorisonter, hhv. det mellemlange sigt, 2020, og det
lange sigt 2050. For hver tidshorisont er der angivet indikative målsætninger, som
scenarierne skal opfylde:
2020: 30 og 40 % reduktion i emissionen af drivhusgasser sammenlignet med
1990
2050: 60 og 80 % reduktion i emissionen af drivhusgasser sammenlignet med
1990
Scenarierne for 2020 har primært fokus på allerede kommercielle teknologier, mens
der i 2050-scenarierne også ses på teknologiske muligheder, som i dag er i forsøgs-
eller udviklingsstadiet. Det drejer sig bl.a. om brint og brændselsceller samt CO2-
lagringsteknologier.
Scenarierne skal ses i sammenhæng med EU’s målsætninger om reduktion af
udledningen af drivhusgasser med 20-30 % i 2020 samt 60-80 % i 2050 sammenlignet
med 1990. EU’s 30 % målsætning er betinget af en global indsats for at reducere
verdens drivhusgasemissioner, dvs. at andre lande som USA, Kina, Indien m.fl. vil
påtage sig reduktionsforpligtelser i en global klimaaftale for perioden efter 2012.
Analyserne i dette projekt drager nytte af de scenarier, scenarieværktøjer og data, der
blev anvendt i forbindelse med teknologirådsprojektet ”Det fremtidige danske
energisystem”. I 2004 inviterede Teknologirådet et bredt udsnit af repræsentanter for
de største aktører i energisektoren, forskere, NGO’ere og Folketinget til at belyse
mulige veje for udviklingen af det danske energisystem. Hjørnestenen i projektet var
det såkaldte Fremtidspanel, bestående af medlemmer fra Folketingets Energipolitiske
Udvalg.
Scenarierne i teknologirådsprojektet har fokuseret på to konkrete målsætninger for
2025: halvering af CO2-udledningen i forhold til 1990-niveau og reducering af
olieforbruget med 50 % sammenlignet med i dag. Projektet viser, at målene kan opnås
ved at kombinere forskellige teknologispecifikke virkemidler i et såkaldt
“kombinationsscenarie”. I kombinationsscenariet er de vigtigste tiltag flere
25energibesparelser, øget anvendelse af vindkraft og hjemlige biomasseresurser i
energisektoren, samt elbiler, hybridbiler, biobrændstoffer og bedre brændselsøkonomi
i transportsektoren. 12
Forudsætningerne bag nærværende scenarieberegninger er justeret, så
referencefremskrivningen nu så vidt muligt matcher Energistyrelsens seneste
basisfremskrivning fra januar 2008.
Udviklingen i det danske bruttoenergiforbrug er vist i Figur 1. Til trods for en
betydelig økonomisk vækst – BNP er steget med mere end 50 % siden 1980 – er det
lykkedes at fastholde bruttoenergiforbruget på nogenlunde konstant niveau (se Figur
1). Den faktiske CO2-emission fra energisektoren (ekskl. transport) er samtidig
mindsket med 19 % i perioden 1990-2005 – og med 30 %, hvis der korrigeres for
udenrigshandel med el og årlige temperaturforskelle. De væsentligste bidrag til at
opnå dette har været varmeisolering af bygninger og øget brændselseffektivitet
specielt gennem samproduktion af el og varme, samt en forøgelse af andelen af
vedvarende energi til ca. 16 % af bruttoenergiforbruget i dag. Det er samtidig lykkedes
at udvikle energisystemet således, at vindkraft i dag dækker 20 % af elforbruget. 13
PJ
1 000
900
800
gas
700
600
VE
500 kul
400
300
200
100
olie
-
2
6
8
0
2
4
6
8
0
2
4
6
8
0
2
4
97
98
99
97
97
98
98
98
98
99
99
99
99
00
00
00
1
1
1
1
1
1
1
1
1
1
1
1
2
2
1
2
Figur 1: Udviklingen i dansk bruttoenergiforbrug (1972-2004). Udenrigs luft- og søfart indgår
ikke i figuren.
Syv fremtidsbilleder
I nærværende projekt er der analyseret syv forskellige fremtidsbilleder, herunder to
referencefremskrivninger for hhv. 2020 og 2050 (se Tabel 1). Der forudsættes samme
økonomiske vækst (ca. 1,9 % p.a.) i alle scenarierne og samme udvikling i
efterspørgslen på energitjenester 14.
Øget anvendelse af vedvarende energi, flere effektiviseringer og energibesparelser er
de centrale virkemidler i referencescenarierne samt i reduktionsscenarierne.
12
Teknologirådet, 2007.
13
Energistyrelsen 2006: Energistatistik 2006.
14
Jf. Energistyrelsen 2005: Fremskrivninger inkl. en styrket energibesparelsesindsats som
følge af aftalen af 10. juni 2005.
26Referencerne bruges som sammenligningsgrundlag for reduktionsscenarierne. I
referencerne forudsættes en fortsat aktiv indsats i forhold til energibesparelser,
energieffektiviseringer og vedvarende energi. Der antages således en forlængelse af
den energispareindsats, der er udstukket i regeringens handlingsplan fra 2005 15. Det
indebærer, at det endelige energiforbrug ekskl. transport falder svagt fra 450 PJ i 2006
til ca. 435 PJ i 2020 16. Det endelige energiforbrug udtrykker energiforbruget leveret til
slutbrugerne, dvs. private og offentlige erhverv samt husholdninger
For at nå 435 PJ i 2020 skal der gennemføres faktiske besparelser i det endelige
energiforbrug (ekskl. transport) på ca. 1,6 % per år. Uden effektiviseringer og
besparelser vurderes det endelige energiforbrug eksklusiv transport at stige til 567 PJ i
2020.
Efter 2020 stiger det endelige energiforbrug i referencescenariet, således at det ender
på 608 PJ i 2050. Udviklingen dækker dog over fortsatte besparelser, idet det endelige
energiforbrug uden besparelsestiltag på forbrugssiden ville være steget til næsten 900
PJ i 2050.
I reduktionsscenarierne udmøntes yderligere tiltag på besparelsesområdet på baggrund
af de tekniske besparelsespotentialer, der er opgjort i baggrundsmaterialet til
Energistyrelsens energisparehandlingsplan fra 2005. I alle reduktionsscenarierne sker
en større besparelsesindsats end i referencerne.
I transportsektoren er der forudsat en anvendelse af mere brændselsøkonomiske
transportmidler i 2020 i alle scenarierne. I referencen forudsættes det, at bilparkens
gennemsnitlige brændselseffektivitet forbedres med 10 % i forhold til i dag via
skærpede internationale krav og i det mest ambitiøse af reduktionsscenarierne med 20-
25 % ved en kombination af nationale og internationale virkemidler. Dette svarer til en
CO2-emission på lidt over 125 g/km. Til sammenligning har EU Kommissionen
foreslået en bindende aftale med den europæiske bilindustri, om at udledningen fra
nye biler i gennemsnit ikke må overstige 130 g CO2/km i 2012. Endvidere
introduceres biobrændstoffer og el-/hybridbiler med forskellige ambitionsniveauer i
scenarierne.
I 2050 forventes det, at brint- og elbilteknologierne er fuldt kommercialiserede og
spiller en betydelig rolle i alle reduktionsscenarierne. I det 80 %-reduktionsscenarie,
der har særligt fokus på anvendelsen af vedvarende energi, er alle konventionelle
oliebaserede brændsler udfaset af transportsektoren. Endvidere forudsættes
brændstoføkonomien i konventionelle biler med brændselsmotorer at være forbedret
mærkbart i reduktionsscenarierne (50-60 % sammenlignet med i dag svarende til 75 g
CO2/km).
På trods af at elforbruget antages at stige fra godt 36 TWh i dag til knap 40 TWh i
2020 falder brændselsforbruget til el- og fjernvarmeproduktion fra 369 PJ i 2006 17til
339 PJ i referencen 2020. Dette skyldes, at de decentrale gasfyrede kraftvarmeværker
forudsættes erstattet med nye anlæg med højere virkningsgrad (Best Available
15
Jf. Energistyrelsen 2005: Fremskrivninger inkl. en styrket energibesparelsesindsats som
følge af aftalen af 10. juni 2005. For perioden 2006 – 2013 fastsætter energispareaftalen en
målsætning om, at den årlige effekt af energispareindsatsen skal svare til 1,7 % af
energiforbruget i 2003.
16
Endeligt energiforbrug udtrykker energiforbruget leveret til slut-brugerne, dvs. private og
offentlige erhverv samt husholdninger.
17
Det klima- og eksportkorrigerede energiforbrug i 2006. Brændselsforbruget inkluderer
vindkraft.
27You can also read