How to decarbonise New Zealand's transport sector - Paul Callister and Heidi O'Callahan - Victoria ...
←
→
Page content transcription
If your browser does not render page correctly, please read the page content below
How to decarbonise New Zealand's
transport sector

Paul Callister and Heidi O’Callahan

                                 Working Paper 21/09

                                               2021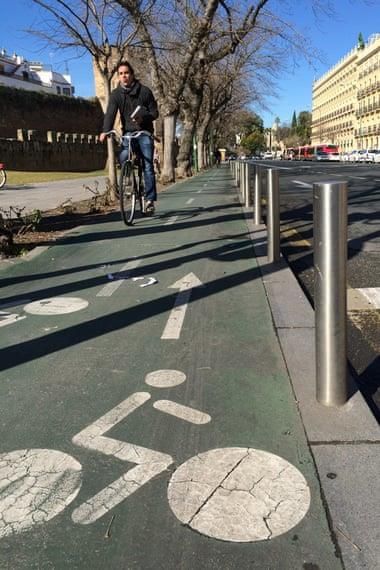
INSTITUTE FOR GOVERNANCE AND
                POLICY STUDIES
               WORKING PAPER
                         21/09

                 MONTH/YEAR      March 2021

                     AUTHORS     Paul Callister and Heidi O’Callahan

INSTITUTE FOR GOVERNANCE AND
                                 School of Government
                POLICY STUDIES
                                 Victoria University of Wellington
                                 PO Box 600
                                 Wellington 6140
                                 New Zealand

                                 For any queries relating to this working paper, please
                                 contact igps@vuw.ac.nz

                   DISCLAIMER    The views, opinions, findings, and conclusions or
                                 recommendations expressed in this paper are strictly
                                 those of the author. They do not necessarily reflect the
                                 views of the Institute for Governance and Policy Studies,
                                 the School of Government or Victoria University of
                                 Wellington.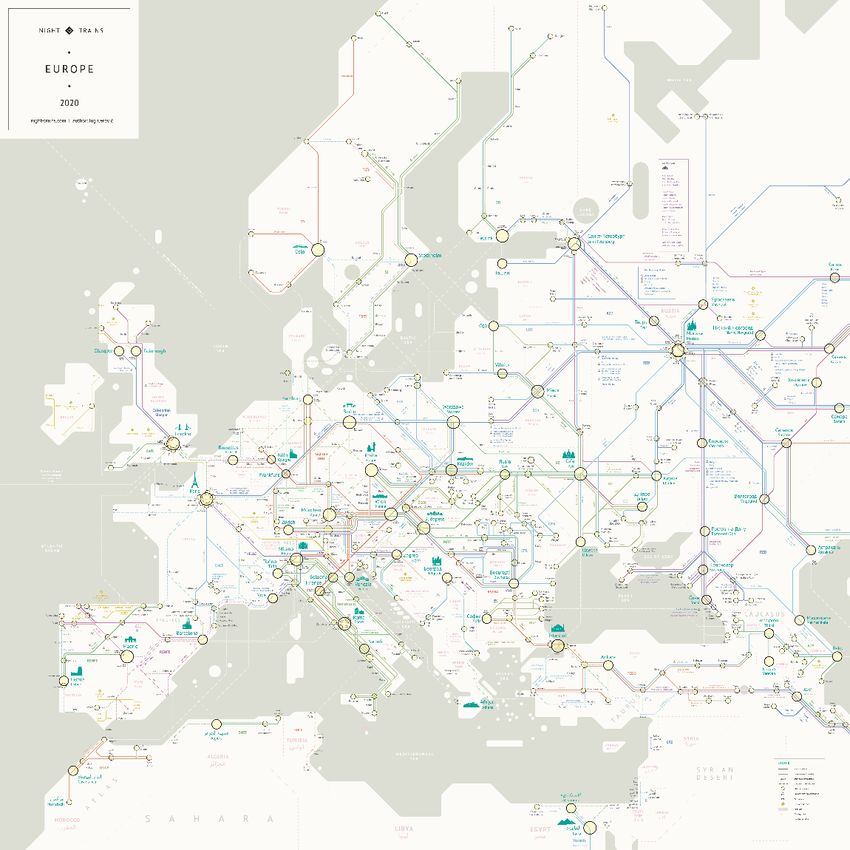
How to decarbonise New Zealand's transport
sector

Contents

Introduction ............................................................................................................................................ 2
The problem ............................................................................................................................................ 2
Our historical emissions from transport ................................................................................................. 3
Pathways to 1.5 degrees warming .......................................................................................................... 4
Electrification of the car fleet on its own is not an economical approach to decarbonisation .............. 5
Decarbonising our decisions ................................................................................................................... 7
Decarbonising Auckland/Tāmaki Makaurau, our largest city ................................................................. 9
   Auckland’s sprawl ............................................................................................................................... 9
   Improving safety and amenity for active travel ................................................................................ 10
   A city-wide low traffic neighbourhood plan ..................................................................................... 14
   Reducing vehicle travel ..................................................................................................................... 15
   Improving public transport ............................................................................................................... 17
Decarbonising our smaller cities and towns ......................................................................................... 18
A low carbon regional transport network............................................................................................. 21
Tourism, international family links and foreign students ..................................................................... 25
Equity .................................................................................................................................................... 29
Conclusion ............................................................................................................................................. 31

                                                                                                                                                            1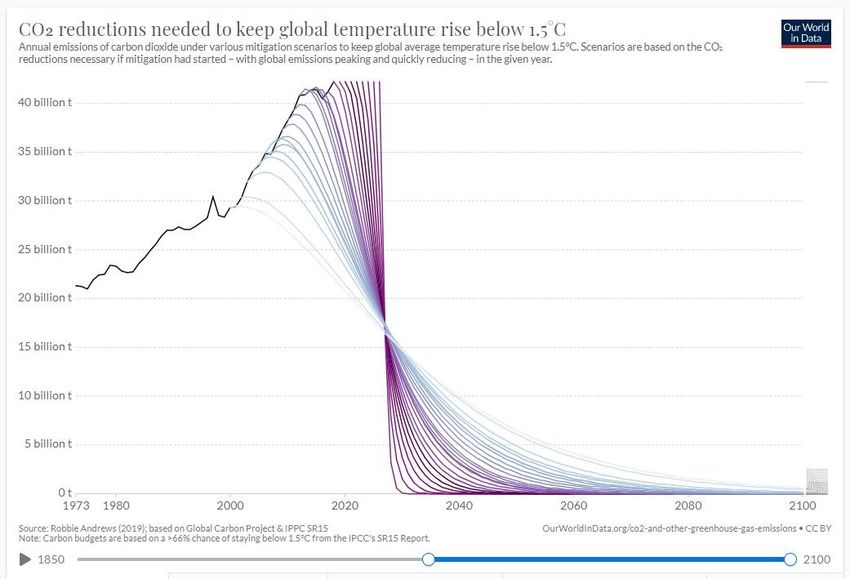
Decarbonising New Zealand’s transport sector:
How to do it and what is stopping us
New Zealand can deliver on a 1.5ºC future

To achieve this, transportation in New Zealand must be largely decarbonised by 2030.

Our current transport system no longer meets our needs.

By 2030 our transport system will be safe, healthy, accessible to all, resilient and decarbonised.

Paul Winton, 1point5 Project

Introduction
Emissions from transport are a major part of New Zealand’s climate challenge, as highlighted by the
Climate Change Commission in February 2021. While transport emissions have been rising in most of
the world, New Zealand’s increase in road transportation emissions by 101.6% from 1990 to 2018
has been remarkable.1 New Zealand is also unusual among advanced industrialised economies with
farming creating around half of our total greenhouse gas emissions. This has implications for the
transport sector.

Both transport and farming have enormous emission reduction possibilities. The co-benefits of
decarbonising transport will improve lives throughout society, which can be communicated
relatively quickly. The co-benefits of decarbonising farming are extensive, but because farming is an
important export industry this may cause a delay to action. Regardless, we must meet our
international commitments and decide as a country how we split the emissions reductions between
sectors.

We have produced this working paper in response to the publication of the Climate Change
Commission’s first report and the Parliamentary Commissioner for the Environment’s second report
on sustainable tourism.2 3

The problem
The Climate Change Commission’s draft report sets a budget of reducing domestic transport
emissions by 47% by 2035. The 1Point5 Project’s conclusion is stronger. Their research suggests
mitigating the risk of a delay in the decarbonisation of farming requires transport to aim for almost
full decarbonisation by 2030. 4

We take this as our starting point. How do we achieve this, and what are the barriers to change?

1 https://www.mfe.govt.nz/sites/default/files/media/Climate%20Change/new-zealands-greenhouse-gas-inventory-1990-2018-vol-1.pdf
2 https://www.climatecommission.govt.nz/get-involved/our-advice-and-evidence/
3 https://www.pce.parliament.nz/publications/not-100-but-four-steps-closer-to-sustainable-tourism
4
  https://1point5.org.nz/

                                                                                                                                 2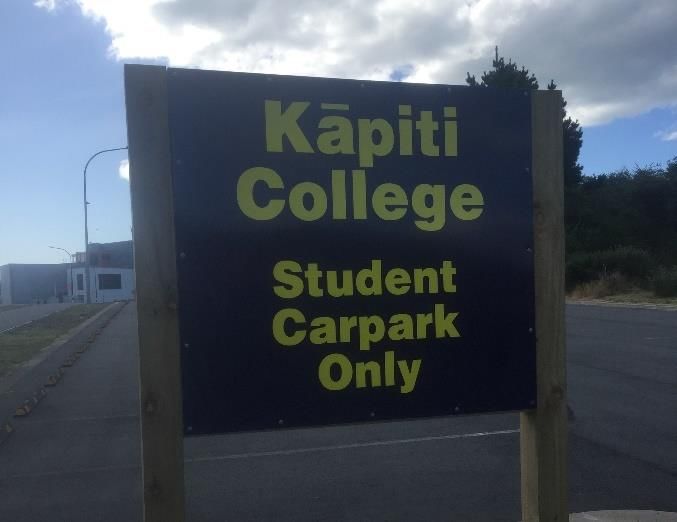
While it has been known for quite some time that we need to reduce transport emissions, New
Zealand has been heading in the opposite direction. The problem we face, essentially, is that these
increases have happened for systemic reasons; and those systems are still in place.

Our historical emissions from transport
 In 1990 domestic transport emissions were estimated to be 8,765 kilotonnes carbon dioxide
equivalent (kt CO2-e). This represented 14% of gross emissions in that year. By 2018, these had
increased by 90%, to reach 16,625 kt CO2-e, representing 21% of total emissions. Road
transportation increased over the same period by 101.6%.

Figure 1 shows the trajectory of the main domestic transport emissions. Due to its significance and
growth path, international aviation is also included. Based on a growing research literature, both
international and domestic aviation emissions lines used here include a radiative forcing factor.5 In
its February 2021 draft report the Climate Change Commission did not factor in radiative forcing.
Nor did the Parliamentary Commissioner for the Environment report on tourism.

Figure 1

Source: https://www.mfe.govt.nz/publications/climate-change/new-zealands-greenhouse-gas-inventory-1990-2018

Cars, and increasingly those SUVs defined as ‘light trucks’, had until recently been by far the largest
contributor to transport emissions.6 In briefings to the incoming government in 2020 officials made
it clear that not enough was being done to curb these emissions.7 The Climate Change Commission
also concentrates heavily on private car emissions and the need to reduce these.

However, due to the very rapid growth of tourism, international aviation emissions overtook cars in
2016 and, until Covid-19 restrictions closed our borders, had been increasing rapidly. Domestic
aviation had not seen any significant growth since 1990, but has had small growth and decline
phases. The declines have been attributed primarily to efficiency gains, but strong passenger growth

5 Research indicates that radiative forcing amplifies aviation emissions. A 2021 study provides a median estimate of a 2.8 times
amplification with 90% confidence intervals of 1.5 to 5.7 (log normal distributed). Lee, D.S. et al (2021) ‘The contribution of global aviation
to anthropogenic climate forcing for 2000 to 2018’, Atmospheric Environment, 244, https://doi.org/10.1016/j.atmosenv.2020.117834
6 Canadian research indicates cars have been getting bigger, heavier and more powerful reducing any efficiency gains.

https://twitter.com/brent_bellamy/status/1371991786889961474?s=19
7
  https://www.stuff.co.nz/national/politics/300184111/government-policy-not-enough-to-curb-rising-transport-emissions-officials-say

                                                                                                                                              3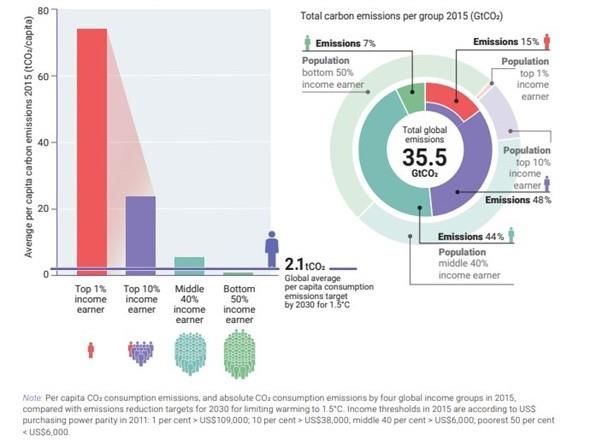
has prevented the desired reduction in emissions. Emissions were on an upward trend between
2012 and 2020, despite the efficiency gains.

Rail emissions (primarily freight) have been very low throughout the whole period. As an indicator of
the efficiency of rail, 7% of all passengers and 11% of all goods movements in the European Union
are by rail but rail is responsible for less than 0.5% of the European Union’s transport-related
greenhouse gas emissions.8

We focus on passenger transport rather than freight.

Pathways to 1.5 degrees warming
The decline in overall emissions has to be dramatic if we are to stay under 1.5 degrees warming. As
Figure 2 indicates, unless our actions lead to very rapid decarbonisation of transport, the challenge
only gets harder and harder each year.9 There is on-going debate as to whether the overall targets
set out in the draft Climate Change Commission advice are strong enough.10 11

Figure 2

8 Germanwatch (2020) Hop on the train: A Rail Renaissance for Europe How the 2021 European Year of Rail can support the European
Green Deal and a sustainable recovery, December,
https://germanwatch.org/sites/germanwatch.org/files/Hop%20on%20the%20Train.%20A%20Rail%20Renaissance%20for%20Europe_0.pd
f
9 https://ourworldindata.org/grapher/co2-mitigation-15c?time=1973..2100
10 https://www.stuff.co.nz/environment/climate-news/124520105/why-the-climate-change-commissions-targets-are-so-weak
11
   https://www.lawyersforclimateaction.nz/news-events/zoom-on-ccc-draft-advice

                                                                                                                              4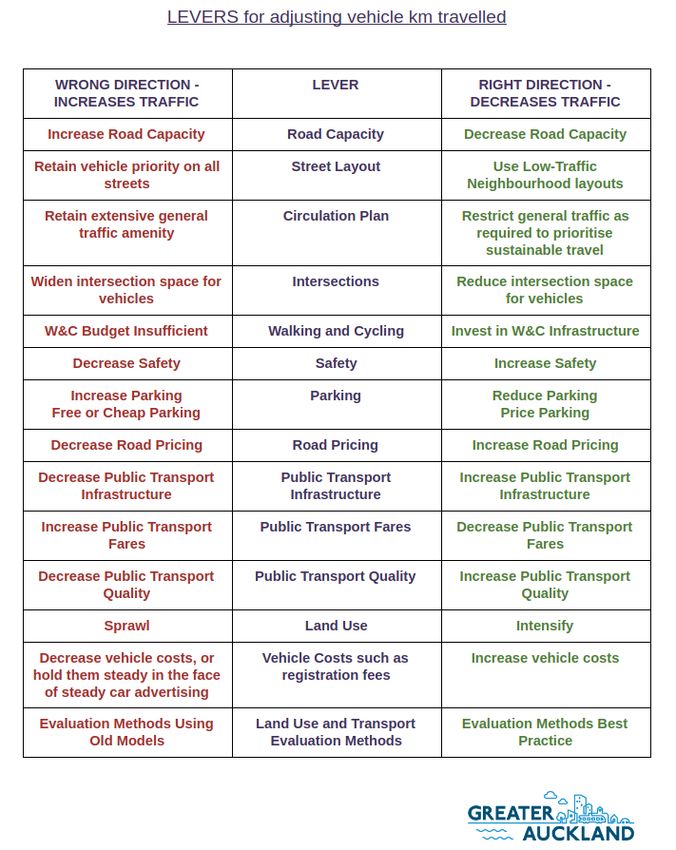
Electrification of the car fleet on its own is not an
economical approach to decarbonisation
Until recently, the approach of both our major political parties to reducing the emissions from
transport has been to rely on the development and uptake of low emissions vehicles. The Climate
Change Commission also focuses on expanding the EV fleet.

Yet while electrification of the car fleet is important, it can only be one strand of policy, for a number
of reasons.12

New Zealand’s car ownership rate is 86%13 - amongst the highest in the world 14. The required
number of electric vehicles to provide full decarbonisation would be nearly 4.7 million vehicles15 by
2030. If all cars were new the cost to the public would be well over $230 billion. Even if costs could
be substantially reduced by half by drawing on second-hand cars, the figure is still extraordinarily
high. Accommodating these vehicles, with road-building and parking provision, is also very costly.16

The Climate Change Commission believes the minimum cost will drop but it is speculation as to
whether the average price paid would be much below this. An Otago University survey suggests
most people do not spend much at all on their vehicles, even those on higher incomes. The majority
of the survey participants reported they were unlikely to spend more than $20,000 on a new
vehicle.17

There is also a danger that plug in hybrid electric vehicles (PHEVs) will be seen as of similar value to
full electric vehicles.18 PHEVs generally have a small battery which will degrade over time so
potentially become predominantly fossil fuelled. PHEVs may become very popular in New Zealand
because:

     ●    They generally come in the large SUV format, which are currently popular with New Zealand
          drivers.

     ●    PHEVs do not have the range anxiety, journey logistical planning, or battery ageing issues of
          100% EVs because the associated petrol drive system just seamlessly takes over as needed.

     ●    Categorisation of PHEVs as electric cars gives the owner the feel-good factor of doing their
          bit to help combat climate change, even if that is primarily an illusion.

     ●    The PHEV user may be able to take advantage of incentives given to encourage the uptake of
          electric vehicles.

12 We consider electric bikes later in the paper.
13 Vehicle fleet was 4,346,294 in 2019. (https://www.transport.govt.nz/statistics-and-insights/fleet-statistics/vehicle-fleet/)
Population in December 2019 was 5,042,000 (https://www.stats.govt.nz/topics/population)
14 (https://en.wikipedia.org/wiki/List_of_countries_by_vehicles_per_capita)
15
   assuming the car ownership rate remains at 86% and population rises to 5.5 million (Vehicle fleet was 4,346,294 in 2019.
(https://www.transport.govt.nz/statistics-and-insights/fleet-statistics/vehicle-fleet/)
Population in December 2019 was 5,042,000 (https://www.stats.govt.nz/topics/population))
16
   There are also those who argue that the mining and other resource use cannot support the worldwide growth of EVs. In addition, those
promoting this view often argue that due to poor energy returns on investment as well as the resources required we cannot provide
enough renewable energy to power these vehicles.
17 https://www.newsroom.co.nz/ideasroom/what-kiwis-really-think-about-evs
18 Personal comment from Steve Goldthorpe.

                                                                                                                                      5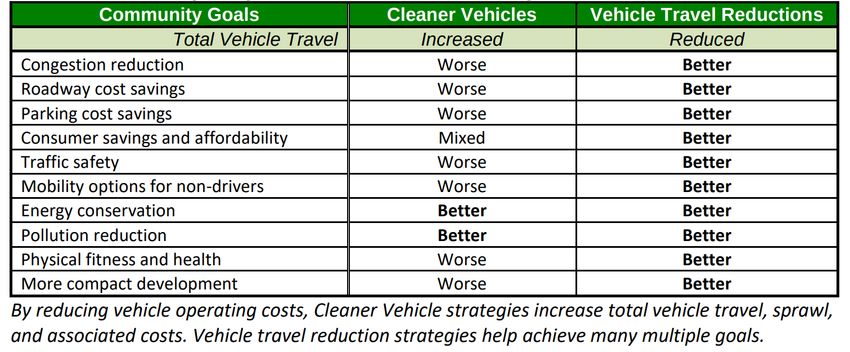
●    Given the bulk of everyday vehicles feeding the New Zealand fleet are second-hand imports
             (primarily from Japan), good quality used PHEVs (with ageing batteries) may flood the New
             Zealand market at attractive prices.

Developed countries with lower car ownership rates (eg Norway at 51%) can consider relying heavily
on electrification of the fleet because they have fewer vehicles to replace and the cost per capita will
be lower to do so. They have also already started reaping the benefits of investment in safety
improvements that enable an uptake in sustainable, active travel - an investment New Zealand still
faces.

For New Zealand, if policy can succeed at substantially reducing driving and car ownership, our fleet
can shrink. This can in turn reduce the mammoth task of electrification to an affordable level. As an
effective alternative to electric cars, vastly expanding the fleet of e-bikes has significant co-benefits,
and is far cheaper.

Decarbonisation via fleet electrification, without serious systems change, also leaves future
generations with a transport network similar to the one we have at present - car dependent,
expensive to maintain, and accompanied by poor safety, health, access and local environment
outcomes. Also, electrification actually increases vehicle travel19:

             Because cleaner vehicles generally have lower operating costs than conventional vehicles,
             they tend to increase total vehicle travel and associated costs. For example, electric vehicles
             typically cost about half as much to operate as fossil fuel vehicles, which typically increases
             annual vehicle-miles by 10-30%.

Policy needs to harness as many benefits from our investment in decarbonisation, and electrification
delivers very few20:

             There are two general approaches to reducing transportation emissions: cleaner vehicles
             strategies that reduce per mile emission rates, and vehicle travel reduction strategies that
             reduce total vehicle mileage.

Table 1: Comparing Emissions Reductions Strategies

19   https://www.vtpi.org/wwclimate.pdf
20
     ibid

                                                                                                               6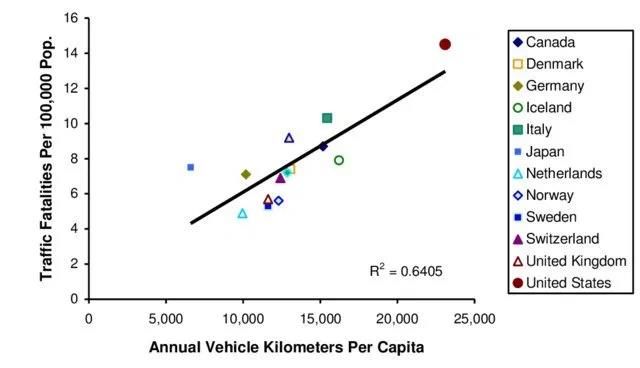
Decarbonising our decisions
As outlined by the Climate Change Commission, transport and land use are intricately connected.
Our multiple crises in safety, climate, public health, transport poverty, lack of access to opportunities
and to some extent, the housing crisis - have been created by flaws in our methods for:

     ●   planning,

     ●   transport modelling and

     ●   investment evaluation methods.

Our development plans have assumed that a level of sprawl and region-wide road building is
necessary. Yet this core assumption is flawed because our cities and towns have plenty of room for
quality intensification. Sprawl and road building reduce our longer-term resilience, push our
emissions up, and cost billions of dollars in public money. The alternative to sprawl - intensification -
is a key decarbonisation element21, reducing emissions initially by at least 9%22, and significantly
more over the long term.

Unfortunately, our transport modelling methodology then takes these poor planning assumptions,
and introduces further, substantial, inaccuracies.23 The modelling incorrectly flags the road networks
as being impossibly congested in scenarios without new roads, and magically uncongested in
scenarios with the new roads.

Neither is true. Without the road - and with the proximity offered by intensification instead of the
sprawl assumed in the planning - traffic levels would not rise as the base models assume.
Conversely, in the scenario with the new road, the initial lower levels of congestion after opening
would actually induce traffic until the improvements in travel time are swallowed up. The inaccuracy
is fundamental; it comes from an assumption that both scenarios - although having different levels
of road capacity, and vastly different patterns of development - would see the same land use
patterns and number of “person trips”.24

Our investment evaluation methods then amplify the problems further. Travel time savings for
drivers, and lower congestion levels, are considered “benefits” in the business cases for new roads;
in reality these benefits quickly disappear as induced traffic - those “person-trips” that are ignored in
the modelling - eventuates. Safety seems like an obvious benefit but in fact is spurious because the
induced traffic increases traffic conflicts throughout the city or region - not just on the road itself.
“Lower emissions” are often attributed to new roading - but this is a benefit which relies on the
(fanciful) belief that congestion will be lower. The evidence instead is that new roads increase
emissions. And “agglomeration” benefits are assumed to accrue to drivers due to the travel time
benefits; in fact agglomeration is about density and walkability, something these new road projects
worsen.

In summary, how we plan, model and evaluate transport projects continues to bias investment
towards road building and widening. This happens at council and Waka Kotahi level, and is why
Cabinet received poor advice from officials for deciding on the NZUP and the Covid Recovery

21
   https://smartgrowthamerica.org/resources/driving-down-emissions/
22 https://link.springer.com/article/10.1007/s13280-019-01290-y
23 https://research-repository.griffith.edu.au/handle/10072/17993
24 https://www.semanticscholar.org/paper/The-%E2%80%99fundamental-law-of-highway-congestion%E2%80%99-and-air-Garcia-

L%C3%B3pez/5d106760830ccaef92ac1008dc091404b7f0d309

                                                                                                                       7
packages. These packages brought forward projects that should never have been in the longer term
plans.
The sector is also bogged down by over-use of the “business case” process, which is intended as a
useful aid to decision-making. For smaller projects, such as many of the placemaking and active
travel projects, the business case costs are onerous. This skews investment towards larger projects
which can swallow the cost of the business case more easily. Also, the quality of the business case
results vary entirely with the assumptions within them, but the significance of the numerical results
has been elevated above their accuracy. This has seen them replace leadership and strategic
decision-making. Furthermore, there is a temptation to use biased assumptions within the business
cases to manipulate investment decisions.
Professionals in the sector need to refresh themselves on their codes of ethics25, paying particular
attention to the need to update their skills with international best practice, and to avoid
environmental harm.
The investment decisions made on the basis of these poor processes are a core reason for the
country’s rising emissions and level of car dependence. The implications for climate change are
enormous. Unfortunately, there are many vested interests in the political economy of car
dependence26 which will resist the reform to these methodologies. Strong, informed leadership has
never been more critical.
To break through these multiple problems, some new tools will be needed. The Cycling and Walking
Plan for England27 provides a useful governance measure:
To receive Government funding for local highways investment where the main element is not
cycling or walking improvements, there will be a presumption that all new schemes will
deliver or improve cycling infrastructure to the new standards laid down...
In a similar way, Government and councils should consider making the funding for any roading
projects, including maintenance and renewals, contingent on a requirement to roll out cycling and
walking improvements across the network, and to reduce “vehicle km travelled” (vkt) annually by,
say, 7% per annum.
The agencies would very quickly discover the many big and small decisions they can change to
achieve this, if they want to continue to receive funding.
Another important adjustment to how the funding is allocated, is to adjust the assistance rate for
public and active transport projects and road projects to ensure the right incentives are in place for
Councils to advocate for public and active transport, and not for roading.
25 https://www.engineeringnz.org/engineer-tools/ethics-rules-standards/code-ethical-conduct/
26 https://www.sciencedirect.com/science/article/pii/S2214629620300633
27 https://assets.publishing.service.gov.uk/government/uploads/system/uploads/attachment_data/file/904146/gear-change-a-bold-
vision-for-cycling-and-walking.pdf
8Decarbonising Auckland/Tāmaki Makaurau, our
largest city
Most of New Zealand’s population live in the large cities of Auckland, Hamilton, Wellington,
Christchurch and Dunedin. However, it is beyond the scope of this paper to consider them in the
detail that is necessary to set a path for decarbonisation. Auckland is considered here primarily as an
illustrative example.
Car dependence - including high car ownership, biased regulations, unhealthy streets prioritised for
vehicles, and sprawling development patterns - is at the root of Auckland’s high transport emissions:
Car-dependent transport systems are an important component of ‘carbon lock-in’, i.e. “the
interlocking technological, institutional and social forces that can create policy inertia
towards the mitigation of global climate change”...
suburban sprawl can be seen as the effect of state capture by the car-dependent transport
system, rather than an outcome of citizen preferences…28
The strength of this state capture is evident in the recent update to the Auckland Transport
Alignment Project29. With a budget of $31.4 billion, ATAP 2021 is the largest investment in business-
as-usual car dependent planning the city has seen. The 10-year programme puts the city on track to
increase transport emissions by 6% over the decade.
The programme ignores the Council’s commitment to C40 “innovative city” membership, which
requires innovation and leadership to inspire other cities. The Auckland Climate Plan’s target of
reducing transport emissions by 64% over the decade, and various specific targets, such as
increasing cycling modeshare to 7%, were ignored.
Here are some illustrative examples on how to reduce emissions: halting sprawl, improving safety
and amenity for active travel, a city-wide low traffic neighbourhood plan, reducing vehicle travel,
and improving public transport.
Auckland’s sprawl
Sprawl - with its effect on population density and longer travel distances - is often cited as the
reason better public transport is too expensive to provide here, and why longer distances mean
cycling modeshare will always be insignificant. In fact, Auckland is like any car-dependent city;
improvements to public transport and cycling infrastructure can result in significant modeshift.
Yet the transport challenges presented by sprawl are indeed obvious, and Auckland’s first task for
decarbonisation is to reverse its plans for continuing to exacerbate this problem. The city must stop
developing into greenfields areas.
Moreover, the growing population means Auckland’s urban form can be changed quite swiftly.
Intensification brings amenities to areas that are currently lacking them, vastly improving access and
proximity for existing residents living nearby. This steadily reduces average trip distances, enabling
28 https://www.sciencedirect.com/science/article/pii/S2214629620300633
29
https://ourauckland.aucklandcouncil.govt.nz/media/39069/atap-project-breakdown-and-qa.pdf
9modeshift to walking, cycling and public transport. Intensification also supports better levels of
public transport ridership and provides a higher revenue (from rates) to maintain infrastructure.
So although Auckland has chosen to continue to sprawl in recent years, the opportunity to harness
projected population growth to reshape Auckland’s urban form remains.
Currently, the Auckland Development Strategy allows for Auckland’s size to increase by 25% in three
decades, and with private plan changes being approved, this number may be even higher. This will
hinder our climate response and set future transport planners up for ongoing failure. The Auckland
Climate Plan calls for a review of the development strategy. We believe the new strategy should
include zero greenfields development.
To overhaul the development strategy as we suggest will require challenging economists on the
relevance of “the law of supply and demand.” This theory is used to claim that drip-feeding a supply
of land to the construction sector will keep housing prices down. In fact, there are too many other
factors involved for this theory to dominate the equation, and the opposite is true. As the OECD
study30 into decarbonising Auckland’s land and transport system found:
In addition to reducing emissions, policies that increase population density may entail further
social benefits by curbing growth in the cost of housing. Auckland house prices are expected
to triple over the period 2018-2050 on current trends and by implementing a set of land-use
policies that enable widespread densification this could be reduced to a 57% increase.
Sprawl is unpopular because it is visibly destructive, converting land from productive farmland,
trees, or from marginal land that could otherwise be planted in carbon-sequestering native forest.
The cost of providing the infrastructure for this sprawl is very high and is robbing the city of funding
to provide the regeneration and repair of our existing transport network to provide a more liveable
city and more sustainable travel outcomes. And housing will be much cheaper through
intensification.
There are few, if any, benefits from sprawl for Aucklanders, and many disadvantages. Good
leadership should not find it too politically difficult to rewrite the development strategy in an
environmentally responsible way, with no greenfields expansion.
Improving safety and amenity for active travel
Walking, cycling and micromobility are very low - or no - emissions transport modes. The latent
demand for being able to walk and cycle safely is huge - as shown by the response to the Level 4
lockdown and to any new infrastructure with a modicum of connectivity.
But Auckland has a safety crisis. When people do not feel safe cycling, or walking to the bus or train,
driving becomes the preferred mode, with obvious effects on Auckland’s transport emissions.
The United Nations recommends investing 20% of all transport funding31 in walking and cycling, at
both the national and regional levels. New Zealand has a lot of catch up work to do. Since 2018,
funding has been increased but is still less than a quarter of the UN recommendation. ATAP 2021
provides 4.7% of the budget for active modes and local board activities, and a lot of that is for just
one project.
30 http://www.oecd.org/publications/decarbonising-urban-mobility-with-land-use-and-transport-policies-the-case-of-auckland-new-
zealand-095848a3-en.htm
31
https://www.unep.org/resources/report/share-road-global-outlook-walking-and-cycling-october-2016
10Creating a safe and attractive system for walking and cycling will allow our transport emissions to
drop in four ways:
● People choosing to walk or bike a trip they previously would have driven.
● People choosing to replace long vehicle journeys to distant activities or retailers with short
active journeys to local activities and retailers,
● People choosing to replace long vehicle journeys with public transport journeys because the
first and last legs by walking or cycling are now possible.
● People not having to travel at all because the people they needed to chauffeur can now
travel actively themselves.
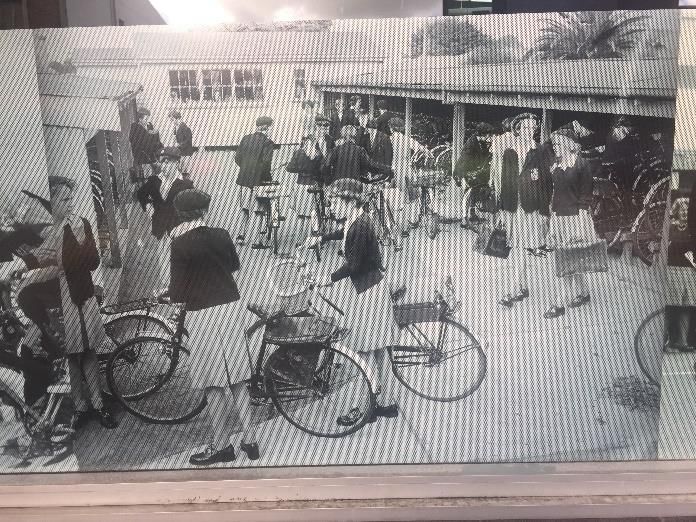
Figure 3: Throughout New Zealand the bike shed has been replaced by free car parks for students
Source: Historic photo Palmerston North library bike display
The transport emissions modelling undertaken by the Auckland Forecasting Centre and Auckland
Transport only acknowledged the first of these pathways to lower emissions, which is why their
decarbonisation plans have not focused on emissions reductions through active travel:
The problem with considering walking for emissions reductions is that their contribution to
mode share of distance travelled is so small that even doubling the amount that’s walked has
negligible effect on emissions.32
Correcting this misconception would allow a different investment programme to be explored in
Auckland. As Phil Goodwin33 has noted34
A frequent criticism is that the aim of reducing car use by increasing walking and cycling will
bear most on shorter trips, with therefore inadequate reductions in mileage. This is where
the deeper commitment to ‘taking the targets seriously’ becomes important. Superficial
analyses typically assume (though they rarely make this explicit) that the number and
distribution of journey lengths stays constant. But entirely orthodox modelling indicates that
if all travel is becoming more expensive, there will be more short trips and fewer long ones.
What this should mean is that the policy interventions necessary to increase the walking
share of trips will also, at the same time, increase the number of journeys to nearby
32 Auckland Transport (2020, December 10). Personal communication.
33 https://scholar.google.co.uk/citations?user=3hF5I4oAAAAJ&hl=en
34 https://www.transportxtra.com/publications/local-transport-today/news/68068/taking-grant-shapps-walking-and-cycling-targets-
seriously/
11destinations and reduce those to distant destinations, which can have the desired effect of
reducing overall mileage more than any reduction in the number of trips – addressing the
criticism above.
Auckland can see significant modeshift through fixing its many safety deficiencies simply because the
deficiencies are so widespread and egregious that fixing them will transform the system.
Can we do this quickly enough to impact our transport emissions by 2030? Yes. Cities can change
their infrastructure quickly, as the world discovered during 202035.
Auckland can learn from a smaller city, Seville36:
In just two years, we transformed a city with almost no cyclists and seven miles of bike lanes,
to a city where bikes have a central role in the urban mobility system… The result of this
infrastructure building process was a parallel growth in cycling mobility. The number of
cycling trips on a working day increased from approximately 13,000 to a peak of 72,000 — a
452% increase — in just three years. This came with a huge safety boon: Cycling in the city is
twice as safe as it was when cycling infrastructure was nonexistent.
Figure 4: Cycling in Seville
Source: The Guardian, https://www.theguardian.com/cities/2015/jan/28/seville-cycling-capital-southern-europe-bike-lanes
35 https://www.theguardian.com/lifeandstyle/2021/mar/12/europe-cycling-post-covid-recovery-plans
36
https://usa.streetsblog.org/2020/10/13/best-practices-how-seville-became-a-city-of-cyclists/
12Or a large city, London37, which reallocated only 0.7% of its streetspace in less than a year, doubling
or trebling its cycling numbers:
In less than 12 months @MayorofLondon @tfl & @londoncouncils have built 100km of new
cycle lanes & hundreds of km of quieter streets. The result? Last weekend we saw a 200%+
increase in cycling (300%+ in some places).
The key is to use ideas from everywhere, to get Auckland’s cycling modeshare first to 5%, then 10%,
then 15% and keep going. Similarly, with walking. Here are some ideas.
Auckland needs default speed limit changes, to bring our speed limits in line with Vision Zero,
Austroads and the International Transport Forum. All urban areas - except where it can be
demonstrated that higher speeds are safe - should be 30 km/hr. Making this change a default
change is far cheaper than requiring signage for multiple different speeds and rolling it out in a
piecemeal fashion. It is also easier for the public to adjust to when it is one comprehensive change.
Auckland needs to comprehensively reduce vehicle travel, because in general, a system with
reduced vehicle travel reduces the number of conflicts between vehicles and other road users38. A
later section of this paper details how this can be achieved.
Figure 5
The amenity and safety of people walking and cycling needs to be prioritised in every decision.
Although this is already the stated policy, decisions in actual projects claim improvements cannot be
undertaken due to “the impacts on the network.” Indeed, another reason for stopping sprawl is that
a spreading, low density city influences transport planners to prioritise traffic flow for longer vehicle
journeys, inconveniencing and endangering people walking and cycling.
Auckland needs to focus on connecting as much of a network of safe and attractive walking and
cycling routes as possible within the decade. All arterials should be included because they are
37 https://twitter.com/martin_mckee/status/1365330192126853121?s=09
38
https://www.planetizen.com/blogs/108401-vision-zero-meet-vmt-reductions
13generally the most direct route and have the most amenities along them. People travelling by bike
need access to all properties, which means safe all-ages, protected cycling lanes. This will generally
mean reallocating parking lanes or repurposing the flush median. The intersections need particular
attention to make them suitable for all-ages cycling, with a reduction in the number of traffic lanes.
Walking requires safe, level footpaths, frequent pedestrian crossings, shorter wait times at traffic
signals and legislative changes to provide priority at intersections. Footpaths also need to be
sufficiently wide, and for multiple ecological reasons, we need large street trees throughout the city.
Unfortunately, many footpaths and verges have been narrowed uncomfortably in the last few
decades, often involving the removal or compromise of the street trees.
Parking management must be overhauled to make both walking and cycling much safer. Parked
vehicles detract from both safety and amenity by dominating the public realm, in parking lanes, off
street parks or illegally parked on footpaths and squares. Both effective enforcement and
reallocation of parking lanes is needed. Also, in many areas walking and cycling are dangerous due to
wide vehicle crossings, sometimes taking up the entire property frontage, requiring people walking
and cycling to be in a heightened state of alert. These need reducing to single vehicle width
crossings, and ideally, parking should be consolidated for several properties into one location and
one vehicle crossing.
A city-wide low traffic neighbourhood plan
A city-wide, low traffic neighbourhood plan is one way to rapidly improve walking and cycling. 39 In
the United Kingdom these plans have delivered multiple benefits40, including reduced injuries and
deaths41, a far more pleasant environment, improved equity42, reduced car ownership43, significant
modeshift from driving44, reduced vehicle travel both in and around each low traffic
neighbourhood45, improved public health46, reduced crime47, and reduced emissions and pollution48.
Through good coordination with “first responders”49 they improve response times50. They also
require and benefit from good engagement with local people with mobility issues51.
All precincts can benefit from these improvements, be they industrial areas, big box retail or
recreational. The public policy think tank The Helen Clark Foundation and WSP have recommended
them for Aotearoa 52:
39 https://www.greaterauckland.org.nz/2020/03/16/aucklands-low-traffic-neighbourhood-plan
40 https://www.sustrans.org.uk/for-professionals/infrastructure/an-introductory-guide-to-low-traffic-neighbourhood-design/an-
introductory-guide-to-low-traffic-neighbourhood-design-contents/design-guide/all/5-a-guide-to-the-evidence-around-low-traffic-
neighbourhoods/
41
https://findingspress.org/article/18330-the-impact-of-introducing-low-traffic-neighbourhoods-on-road-traffic-injuries
42 https://osf.io/preprints/socarxiv/q87fu/
43 https://findingspress.org/article/18200-the-impact-of-low-traffic-neighbourhoods-and-other-active-travel-interventions-on-vehicle-
ownership-findings-from-the-outer-london-mini-holland-programme
44 http://rachelaldred.org/research/low-traffic-neighbourhoods-evidence/
45 https://beta.lambeth.gov.uk/streets-roads-transport/railton-low-traffic-neighbourhood-stage-one-monitoring-report/methodology
46 https://www.bmj.com/content/372/bmj.n443
47 https://osf.io/preprints/socarxiv/ftm8d/
48
https://www.udg.org.uk/publications/news/2020/low-traffic-neighbourhoods-major-research-report
49 https://www.collegeofparamedics.co.uk/COP/Blog_Content/the_paramedic_case_for_safer_streets.aspx
50 https://twitter.com/susancashmere/status/1298252074732236803?s=09
51 https://www.transportforall.org.uk/wp-content/uploads/2021/01/Pave-The-Way-full-report.pdf
52
https://www.wsp.com/en-NZ/news/2020/people-not-cars-at-heart-of-communities
14Councils should therefore develop high-level plans to create multiple, interlinked, low-traffic
areas in parallel, while keeping the specific form and process highly responsive to local
needs...
We recommend that central government:
● Make reducing VKT a road safety priority. When the Road to Zero action plan is next
updated, make reducing the number of kilometres travelled in vehicles (VKT) one of
the focus areas, with specific targets and actions including the reduction of traffic in
urban areas.
● Increase Innovating Streets funding with specific provision for permanent low-traffic
neighbourhood projects.
● Develop a specific legislative tool to enable the creation of low-traffic
neighbourhoods modelled on the UK’s Experimental Traffic Orders, but adapted for
the Aotearoa context.
● Review existing legislation, especially s342 and schedule 10 of the Local Government
Act, and the definition of ‘traffic’, with a view to how they could more easily enable
low-traffic interventions.
Reducing vehicle travel
Reducing vehicle travel also needs to be central to Auckland’s plans to decarbonise transport. This is
not a new concept in sustainable transport planning. Traffic reduction has been overt in some
European cities’ Sustainable Urban Mobility Plans (SUMP’s) for years.
Yet Auckland’s transport planning currently does the opposite. By “optimising the network”,
“minimising the impacts on the network” and “easing congestion” at each congestion hotspot in
turn, current planning methods mean each project incrementally increases vehicle travel throughout
the network. Ironically, this increase in travel worsens congestion throughout the network.
When the focus is put on reducing vehicle travel instead, improvements to sustainable travel
infrastructure can be prioritised. Recognising that “network impacts” such as local congestion
actually lead to network-wide reductions in congestion and vehicle travel opens up a swath of
decarbonisation opportunities. Major projects, streetscape and safety projects, renewals, traffic
management, bus network planning, the operations centre, enforcement, travel demand
management, arterial road redesigns, and optimisation programmes would all start to contribute to
Council’s decarbonisation goals - and in a far more economical way.
Reallocating traffic lanes to active and public transport, for example, offers two major benefits: an
increase in sustainable travel, and a decrease in driving. Together, these can create significant
modeshift, with very little investment.
There are multiple levers that can be used to reduce vehicle travel:
15Table 2
If the transport plans include activities from both the left and right columns, they will waste money
and undermine each other. Reducing traffic consistently will orient urban transport policy to the
objectives of health, such as safety, air quality, physical activity, well-being, accessibility, and
fairness, as well as to reducing carbon emissions:
16reducing car use contributes to all these objectives, therefore potentially reducing the
difficulty of controversial trade-offs between competing objectives.53
Any decarbonisation that is not achieved through reducing vehicle travel must be achieved through
electrification, at great cost. The target for travel reduction needs to be significant. A reduction of
7% in vehicle km per annum would still require electrification of half the fleet, by 2030, so this would
be a bare minimum. Yet it would require a rapid shift in culture, approach and programme activities
at both Waka Kotahi and Auckland Transport.
Improving public transport
The OECD’s study, Decarbonising Urban Mobility with Land Use and Transport Policy - The Case of
Auckland54, includes a public transport improvements scenario that suggests a 40% drop in
emissions by 2050 is possible. This latter modelling was undertaken before the climate emergency
was declared and before Covid, so the conventional economic approach used did not estimate the
impact of some of the more recent tactical interventions seen overseas. The modelling also did not
delve deeply into transport-specific details like improved customer experience and advanced
network design. Due to the conservative nature of the modelling, we believe much of this 40% drop
in emissions could be brought forward to 2030.
Improvements to public transport to achieve this reduction in emissions would include:
● Widescale bus priority in the form of bus lanes, bus priority in the give way laws, and bus-
triggered traffic signals. Where bus lanes cannot fit, actively manage the general traffic
volumes to ensure the bus is not held up due to congestion.
● Rapidly expanding the frequent bus network to cover the existing urban area and any new
growth areas under construction;
● Low Traffic Neighbourhoods, which will reduce traffic congestion on the bus routes and
improve the first and last legs of passenger journeys;
● A full focus on passenger safety, including near bus stops and train stations, and on
passenger experience, including quality information and wayfinding that does not rely on
having a functioning smartphone.
● Parking management to encourage modeshift from driving to public transport (eg significant
removal of parking, parking levies, the removal of residential parking zones, higher prices for
parking, parking management to reduce the supply of illegal parking spaces)
● Completing Auckland’s Congestion Free Network55;
● Replacing the farebox recovery policy to allow for greater funding from central government
for operational expenses of public transport;
● Introducing new fare schemes such as free travel for community service card holders and
daily/weekly fare caps56;
53
https://www.itf-oecd.org/trends-car-use-travel-demand-and-policy-thinking
54 http://www.oecd.org/publications/decarbonising-urban-mobility-with-land-use-and-transport-policies-the-case-of-auckland-new-
zealand-095848a3-en.htm
55 https://www.greaterauckland.org.nz/congestion-free-network-2/
56
https://freezethefares-generationzero.nationbuilder.com/
17● Making public transport attractive for people to use off peak, late night, cross town and
counter-peak services.
This last point needs some illustration. Public transport management in Auckland is still overly
focused on serving commuters on the main flows in and out of the city. This is because the rationale
for investing in public transport has been to try to encourage modeshift during the heavily
congested peaks in order to improve the driving experience for other drivers.
A focus on public transport users - of any time of day - requires giving just as much priority to other
services. Users may only actually use an off peak, late night, cross town or counter-peak service
irregularly, but its existence allows them to treat public transport the way drivers treat the road
network - as a system that extends everywhere, any time. In any eventuality, they are secure
knowing they can get wherever they need by public transport. This approach radically shifts
mindsets and reduces car ownership and driving.
The value of an individual service cannot be calculated on a spreadsheet based on the number of
people using it - the effect on customer experience and ridership is not captured there.
Good frequencies are critical and reduced off peak fares can make the services more attractive too.
Attractive off-peak services and cheaper fares also spread the ridership away from the peak hours,
improving the return on investment and the ridership / emissions ratio.
Unfortunately, this approach to public transport investment has not been accepted in the recent
emissions modelling by Auckland Transport, which explains why the scenario in which “public
transport was improved so that fare, frequency and access barriers were removed” didn’t show
significant reduction of emissions.57 They concluded that a larger emissions reduction from public
transport improvements than what the model showed is not pragmatically possible.
Furthermore, simple public transport improvements to help bring emissions were rejected on the
basis that:
the 70% driving modeshare means it is difficult to get public sentiment to change rapidly
The modelling has not been used to find a technical solution to our problems, it has simply reflected
the status quo, and is really a measure of the organisation’s unwillingness to change.
Decarbonising our smaller cities and towns
In most small cities and towns, residents also depend heavily on cars for transport - if they can drive
and can afford a car - while those who do not drive are not well catered for. Census data indicate
many small centres are deprived areas. As a result, residents have, on average, older less reliable
cars.
As already discussed, cars can potentially be electrified but this does not improve access for people
who do not drive. Purchasing new electric cars is also beyond the means of many residents of small
cities and towns so many people in smaller towns will wait for second hand EVs to become available.
For EV uptake to be significant in the next decade substantial government support is required.
57
Auckland Transport (2020, December 10). Personal communication.
18Significant modeshift could be encouraged instead. Distances within towns and smaller cities are
shorter than in NZ’s large cities, making these locations better suited to walking and cycling. The
price of land for off-road shared paths is also considerably cheaper than in cities. This would allow
the creation of long-distance connections to households, workplaces, amenities, local attractions,
and neighbouring towns. A quality solution-finding process with landowners, similar to the Twin
Streams Project in Waitākere City 58, could enable the creation of networks. Engagement would
include discussion about the long-term benefits to the region of taking cars off the roads, and of
ensuring visitors and locals alike have full, active access.
Electric bikes offer an opportunity to transform transport in small cities and towns.59 60 They are
much cheaper than electric cars and have lower energy requirements, and there are bikes to meet
the needs of all people - cargo bikes, bikes for people with disabilities, bikes with covers, bike buses
for groups of young children. In Lithuania, a scheme where old cars can be traded in for subsidised
electric bikes has been very successful.61 Other governments are subsidising, or considering
subsidising, e-bikes.62 63
To enable this, however, safe infrastructure is required. E-bikes overcome the problem of distance
and hills, but in many smaller towns, these problems do not exist. In Palmerston North, Hastings,
Gisborne, towns in the Wairarapa and the Kāpiti/Horowhenua Coast, and elsewhere, what is keeping
the lid on the latent demand for cycling is the lack of safe infrastructure and the ease of driving that
roading investment and ample free parking have provided. With main regional highways often
running through the centre of these towns, safe walking and cycling will need the introduction of
enforced, systematically safe speed limits, road environments that support the low speeds, and a
new approach to freight, making far better use of rail, and smaller, safer trucks.
However, with an ageing population not all people will be able to walk or bike. Creating safe walking
and cycling infrastructure will help those who need to use mobility scooters. Innovative mobility
schemes are also needed to provide transport for non-drivers for activities such as shopping and
medical appointments.
And of course, public transport is important. Over 26% of the New Zealand population do not have a
driving licence - a figure set to rise as driving becomes both less affordable and less socially
acceptable. Taking the bus can be made far more attractive by reducing traffic volumes so buses are
not delayed. Some small urban areas, for example Queenstown and Waiheke Island, demonstrate
that a frequent bus service can attract customers.64
To help pay for the costs of public transport and the physical work of reallocating road space to
buses and cycle lanes, councils can introduce paid parking for all public car parks, raise prices where
they already exist, and levy all private carparks. As in large cities, schools and universities in smaller
centres should not provide free, or very cheap, parking for students. For example, in the past most
students bused or biked to the Massey University campus in Palmerston North. Now, with vast low
cost parking on campus, cheap cars, and drivers not required to pay the full cost of their
58 https://www.mfe.govt.nz/sites/default/files/large-scale-property-purchase-without-recourse-to-compulsory-purchase.pdf
59 Philips, I., Anable, J. and Chatterton, T. (2020) E-bike carbon savings – how much and where?, CREDS Policy brief 011, Centre for
Research into Energy Demand Solutions, Oxford, https://www.creds.ac.uk/publications/e-bike-carbon-savings-how-much-and-where/.
60 McQueen, M., MacArthur, J. and Cherry, C. (2020) The E-Bike Potential: Estimating regional e-bike impacts on greenhouse gas emissions,
Transportation Research Part D: Transport and Environment, Volume 87, https://doi.org/10.1016/j.trd.2020.102482.
61 https://electrek.co/2020/11/01/lithuania-trade-in-old-cars-for-electric-bikes-scooters/
62 https://slate-com.cdn.ampproject.org/c/s/slate.com/technology/2021/02/e-bikes-act-electric-bicycles-subsidy.amp
63 https://www.congress.gov/bill/117th-congress/house-bill/1019/text?r=1&s=1
64
https://www.nzherald.co.nz/travel/nzs-most-beautiful-public-transport-rides/
19environmental impact, most people drive. This creates a downward spiral for the provision of bus
services.
Charging for parking helps ensure drivers pay all the externalities of driving (including
environmental, land use and health costs), preventing them from feeling financially obligated to take
the less socially responsible option.
Urban form is also vital in smaller cities and towns. Towns throughout the country have empty shops
and decaying main streets while subsidised sprawl continues into the rural hinterland. For example,
on the Kāpiti/Horowhenua Coast, small towns are expanding in response to the stimulus provided by
new motorways. An illustration is a new development on the edge of Levin.65 Not only is this
development on prime farmland, it is promoted on the idea that new roading will bring it within easy
car-based commuting range of both Palmerston North and Wellington.
This is the pattern of development that has driven up New Zealand’s high transport emissions.
Kāpiti provides case studies that illustrate this problem. At the same time as developing housing in
Levin, in central Paraparaumu there is an uneconomic airport. The location offers huge potential for
creating medium to high density affordable housing, perhaps mixed with amenities and suitable
commercial uses, close to public transport, shops, schools and civic amenities. Instead, the council
has provided ratepayer support for the airport, and is now arguing for taxpayer subsidies.66
The transport plans that smaller cities and towns have adopted in recent times tend to focus on a
‘business as usual’ concept rather than supporting the decarbonisation pathway called for by the
Climate Change Commission.
On 25 May 2019, the Kāpiti Coast District Council declared a climate emergency. Yet, on 28 January
2021, the same council adopted a ‘Sustainable’ Transport strategy - which was completely at odds
with the proposed national carbon budgets. This was just three days before the Climate Commission
released its draft advice on emission reductions.67
This was especially disappointing, because the Kāpiti council does understand climate: in 2019 they
won a nationwide “Excellence in Climate Action” award. Earning this award - by reducing their own
in-house emissions 76% in just 10 years - the council had learnt through experience that sustainable
action also brings substantial cost savings.
Within a week of the release of the Climate Change Commission report, the neighbouring regional
council, Horizons (Manawatū/Whanganui), released their draft plan. Despite increased spending on
walking and cycleways and a useful discussion of regional rail, the single two largest spending items
are new highways, one being a continuation of the expressways currently under construction
between Wellington and north of Levin. This is despite research indicating a poor business case for
this road.68 In the Horizons region, the proposed spending mix is 4% walking & cycling, 4% public
transport, 36% road maintenance, 56% new roads.
Many local authorities will need to rework their transport plans. Hopefully, they will do so with more
guidance and assistance from the central government to meet emission reduction targets.
65 https://www.stuff.co.nz/national/rnz/300160417/major-new-housing-development-may-expand-levin-by-a-quarter
66 https://www.stuff.co.nz/environment/climate-news/123742011/in-a-climate-emergency-kpiti-mayor-wants-to-save-airport
67 https://www.newsroom.co.nz/comment/flawed-transport-strategy-a-tick-box-exercise
68
https://www.newsroom.co.nz/build-homes-not-airports-and-expressways
20A low carbon regional transport network
While decarbonising transport within cities and towns is vital, so too is developing ways of reducing
transport emissions within regions and between regions. This primarily involves reducing and
eventually replacing trips by fossil-fuelled cars and planes.69
Regional travel can take many forms, both within and between individual regions. Some people wish
to travel long distance, such as from Auckland to Queenstown. Within-region travel might be from
Ōtaki to Wellington, while an example of inter-regional travel would be Hamilton to Taupō. At times,
within region travel will involve leaving the mainland and visiting islands, such as Great Barrier Island
in the Hauraki Gulf.
Some regional travel will be for work, or education, or for engaging in a pursuit or holiday, while
sometimes it will involve visiting friends and families. Many Māori will wish to visit their Marae,
sometimes quite distant from their current homes and often in remote rural locations.70 Other travel
arises from the need to attend specialist medical appointments. Then there are the many holiday
trips taken by domestic and foreign tourists.
Regional transport policy debates often pit technological market-driven optimists against those who
argue for a need to support significant mode shift. Under the first option, the main tools would
involve a major shift to electric cars, perhaps eventually self-driving, and a rapid move by all
domestic airlines to, as yet commercially unproven, electric or hydrogen powered planes. This seems
to be the model promoted by the Climate Change Commission. Some promoters of this vision
support further road building and, sometimes, subsidies to airlines and airports.
Some changes are already being planned. An example is continuing the installation of fast chargers
for electric vehicles throughout New Zealand, especially in areas where there are gaps such as the
West Coast of the South Island. Lower cost slow chargers should also be available at all places of
accommodation, in car parks next to walking tracks and other places where people stop for long
periods. This is already being rolled out by companies such as Meridian.71
But more important, although currently not receiving attention, is the need for a shift to far more
travel by train, bus and ferry. This is the model being pursued by many European nations and is
primarily the model we, the authors, favour. Not only does this have emission reduction benefits,
but more ably fits the goal of a socially just transition as it provides more affordable travel while also
reaching more areas of New Zealand.72
Research clearly shows that by far the lowest carbon forms of travel are trains and buses.73 Shipping
will also have a place, especially if powered by electricity or low carbon fuels such as green
ammonia.74
It is perhaps not surprising that neither long distance trains nor buses - or ferries - are central to the
Climate Change Commission recommendations, given that no groups or businesses advocating for
these modes of travel were included among their main set of advisors. But the Climate Change
69 Both authors have discussed this topic via a number of articles published in a variety of forums but in particular the Greater Auckland
website. Links to many of these articles are to be found in https://www.greaterauckland.org.nz/2020/04/29/the-tourism-taskforce/
70 Te Puni Kōkiri (2017) Kōkiri 31 – Taku Marae E: Connecting to Marae,
https://www.tpk.govt.nz/en/mo-te-puni-kokiri/kokiri-magazine/kokiri-31-2015/taku-marae-e-connecting-to-marae
71 https://www.stuff.co.nz/motoring/EVs/124340492/meridian-to-launch-nationwide-ev-charging-network
72 https://www.wgtn.ac.nz/igps
73 https://ourworldindata.org/travel-carbon-footprint
74
https://www.bbc.com/news/business-54511743
21You can also read