Study on the Assessment of the Regulatory Aspects Affecting the Collaborative Economy in the Tourism Accommodation Sector in the 28 Member States ...
←
→
Page content transcription
If your browser does not render page correctly, please read the page content below
Study on the Assessment of the
   Regulatory Aspects Affecting the
     Collaborative Economy in the
  Tourism Accommodation Sector in
         the 28 Member States
   (580/PP/GRO/IMA/15/15111J)
European Commission - Directorate General Internal Market, Industry, Entrepreneurship
                               and SMEs (DG GROW)

                                       Task 4
                               Cross-analysis report
This study was carried out for the European Commission by
Spark Legal Network and Valdani Vicari & Associati.
Spark Legal Network
Patricia Ypma
Mariana Chaves
Peter McNally
Kaja Kazmierska
María Domínguez Gaitán
Network of legal experts
Valdani Vicari & Associati
Julia Rzepecka
Marius Dragulin
Lison Rabuel
Ricardas Juskevicius
Vilma Kuuliala
Timothe Peroz
Iva Plasilova
Adriana Rodriguez Diaz
DISCLAIMER
By the European Commission, Directorate General Internal Market, Industry, Entrepreneurship and SMEs.
The information and views set out in this study are those of the author(s) and do not necessarily reflect the official
opinion of the Commission. The Commission does not guarantee the accuracy of the data included in this study.
Neither the Commission nor any person acting on the Commission’s behalf may be held responsible for the use
which may be made of the information contained therein.
ISBN 978-92-79-84013-5
doi: 10.2873/697265
© European Union, (2018). All rights reserved. Certain parts are licensed under conditions to the EU.TABLE OF CONTENT
EXECUTIVE SUMMARY........................................................................................................... 5
1 INTRODUCTION ............................................................................................................ 8
1.1 Aims and objectives of this task............................................................................. 8
1.2 Methodological approach ...................................................................................... 9
1.3 Issues and mitigation strategies .......................................................................... 11
2 OVERVIEW OF THE ACCOMMODATION SECTOR .............................................................. 13
2.1 Main players in the short-term rental sector .......................................................... 13
2.2 Overview of the economic development of the short-term rental sector .................... 18
3 REAL ESTATE AND HOUSING AVAILABILITY ................................................................... 29
3.1 Overview of average rental market prices ............................................................. 29
3.2 Overview of number of vacant properties .............................................................. 35
3.3 Overview of impacts on traditional accommodation providers .................................. 38
4 INCOME AND OTHER TOURISM INDICATORS .................................................................. 45
4.1 Income indicators .............................................................................................. 45
4.2 Tourism indicators ............................................................................................. 50
5 IMPACT ON LOCAL COMMUNITIES................................................................................. 56
5.1 Development of ancillary services ........................................................................ 57
5.2 Housing supply changes ..................................................................................... 60
5.3 Inhabitants’ perception of collaborative short-term rental platforms ......................... 61
5.4 Impact on public services ................................................................................... 63
6 FUTURE DEVELOPMENTS ............................................................................................. 65
7 ANNEXES ................................................................................................................... 67
FIGURES
Figure 1: Map of the 11 EU cities within the scope of Task 4 ..................................................... 8
Figure 2: Share of GDP accounted for by the travel and tourism sector ..................................... 14
Figure 3: Share of tourism local units out of all local units - NUTS 2-level .................................. 14
Figure 4: Evolution in the number of AirBnB listings in five cities .............................................. 20
Figure 5: Current and forecasted revenues for the vacation rentals industry .............................. 21
Figure 6: Growth in the number of AirBnB listings for high-growth cities ................................... 23
Figure 7: Current and expected growth rates of revenues in the vacation rentals sector .............. 27
Figure 8: Variation in share of entire properties out of total AirBnB listings between November 2014
and April 2017 ............................................................................................................ 34
Figure 9: Percentage point change in quarterly average daily rates for AirBnB listings ................. 41
Figure 10: Net occupancy rate of hotel bedrooms, at NUTS 2-level ........................................... 43
Figure 11: Percentage point change in quarterly AirBnB occupancy rate .................................... 43
Figure 12: Percentage point change in quarterly revenue/listing for AirBnB listings ..................... 48
Figure 13: Total number of nights spent in tourist accommodation facilities, at NUTS 2-level ....... 51
Figure 14: Percentage of nights spent in holiday and short stay accommodation facilities out of total
nights spent in touristic accommodation facilities, at NUTS 2-level .................................... 52
Figure 15: Current and forecasted penetration rate for the vacation rentals sector ..................... 55
Figure 16: Share of tourism employment out of all employment - NUTS 2-level ......................... 58
TABLES
Table 1: List of indicators ..................................................................................................... 9
Table 2: List of consulted EU stakeholders ............................................................................. 10
Table 3: Overview of available platform listings in the 11 cities under study, for the main EU-level
collaborative platforms ................................................................................................ 15
Table 4: Evolution of average rent prices, in EUR ................................................................... 31
Table 5: Number of conventional dwellings ............................................................................ 35
Table 6: Percentage of vacant conventional dwellings out of total ............................................. 36
Table 7: Comparison between hotel rooms and AirBnB listings in average price/listing ................ 40
Table 8: Comparison between AirBnB and hotels in terms of occupancy rates ............................ 42
Table 9: Platform-specific information retrieved through desk research ..................................... 45
Table 10: Average monthly revenue on AirBnB per peer provider (EUR) .................................... 46
Table 11: Comparison of revenue per room/listing between AirBnB and hotels ........................... 47
Table 12: Share of AirBnB arrivals and nights spent out of the traditional accommodation sector . 52
Table 13: Availability of short-term rental market impact studies at local and national level ........ 56
Table 14: Percentage of regional GDP out of national GDP at NUTS 2-level ................................ 57
Table 15: Total economic impact of AirBnB ............................................................................ 59
3Annex 5 DEFINITIONS USED in TASK 4 REPORT The key terms used in Task 4 are defined below. It should be noted that these definitions may differ from the definitions used by the European Commission. Primary residences: those residences (dwellings) where the person resides more than 180 days per year. Secondary residences: those residences (dwellings) where the owner spends at least some days per year. Short-term rental: the rental of an accommodation (room or entire property) on a short-term basis. “Short-term” can be defined by local laws as the maximum period per year during which an accommodation provider can rent out their property or part thereof under specific circumstances. Long-term rental: the rental of an accommodation (room or entire property) on a long-term basis. “Long-term” can be defined as a period exceeding any short-term threshold imposed by local, regional or national laws (see definition of “short-term rental”). Vacant property: A residence (dwelling) that is not occupied by their owners or any tenants. Peer provider: For the purpose of this study, the term is used to designate all providers of short- term rentals on collaborative platforms. In certain cases, where data are available, the text makes a distinction between “peer” and “professional” provider. In this case, “peer provider” refers to individuals who do not conduct such activities on a professional basis, i.e. earning the majority of their income through to short-term rentals. Conventional dwelling: The term is defined according to its definition on EUROSTAT, namely a room or a suite of rooms and its accessories in a permanent building or structurally separated part thereof which by the way it has been built, rebuilt or converted; it is designed for habitation by one private household all the year round and is not at the time of the census used wholly for non- residential purposes. Vacant conventional dwelling: According to EUROSTAT, vacant conventional dwellings are conventional dwellings (see above) which have no usual residents at the time of the census but are available to become the principal usual residence of at least one person. Vacant dwellings could be either: seasonally vacant, holiday homes, seasonal workers' quarters, non-seasonally vacant, secondary residences, for rent, for sale, for demolition, or for other purposes.
Annex 5

Executive summary
Task 4 report complements the regulatory analysis in Tasks 1 - 3 with 11 in-depth market
case studies assessing the economic development of the collaborative short-term rental
platforms.

The following 11 cities were under consideration: Athens, Amsterdam, Barcelona, Berlin,
Brussels, Florence, Lisbon, London, Paris, Prague and Stockholm. The case study findings
were cross-analysed in the present report and complemented with pan-European data to
identify more wider trends.

Task 4 report provides data and identify trends in the development of collaborative
accommodation platforms by assessing their impacts on the local short- and long-term
housing availability, the local tourism sector, and the local community. These impacts have
been measured with a series of indicators, which have been collected through EU-level
interviews with collaborative platforms and experts, desk research, and city-level
interviews with local stakeholders.

In this study, collaborative accommodation platforms include peer-to-peer (P2P) short-
term rental platforms and home exchange platforms.

Overview of the accommodation sector
The tourism and accommodation sector is an important component of the economy in the
11 EU cities under the scope of this study. Overall, between 5% and 10% of businesses
offer tourism-related activities and most businesses in the sector are small or micro-
enterprises.

The research has identified six large collaborative short-term rental platforms across the
11 cities considered: AirBnB, Wimdu, 9flats, HomeAway, HomeExchange, and
GuestToGuest. Other international platforms such as Booking.com, HouseTrip,
FlipKey, and LoveHomeSwap also host collaborative short-term rental listings, but their
offer focuses on traditional providers.

The study has found just over 355,000 available properties for short-term rental. In
total, 280,000 listings (or 79%) are entire properties, and 59,00 (or 17%) are private or
shared rooms. However, the number of available properties for short-term rental should
be interpreted with caution. First, it is difficult to list all collaborative short-term rental
platforms due to the size of the accommodation offer. Second, attention must be paid to
the duplication of listings, as hosts tend to advertise the same room or property across
multiple collaborative short-term rental platforms.

Although short-term rentals existed before the arrival of collaborative platforms, the
development of such platforms has contributed to an explosion of the short-term rental
market over the past decade. In the EU cities considered, the number of AirBnB listings
has raised from almost zero in 2012 to more than 60,000 in Paris, 45,000 in London, or
25,000 in Barcelona. Although less spectacular, there is also a growing trend to share
homes, as shown by the increased number of listings and membership growth of home
exchange platforms such as GuestToGuest or Home Exchange.

It cannot be concluded if the regulatory environment has affected the growth rate of the
collaborative accommodation offer. Cities with stricter market access requirements for peer
providers have seen their short-term rental listings increase slower over time than in cities
more permissive regulatory environments. Nonetheless the study also shows that some
cities with a more permissive regulatory environment have noted slower growth in
collaborative short-term rental listings, which prevents from drawing definite conclusions
on this aspect.
Annex 5

Real estate and housing availability
Except for Athens, Florence, and Prague, average long-term rental market prices have
increased in the other EU cities considered. In some cities, like London or Berlin, this
increase is significant, with prices having raised by more than a third between 2011 and
2016.

Local stakeholders tend to associate rising long-term rent prices with an increase in the
short-term rental offer, arguing that price rise often occur in the more touristic areas where
the short-term rental offer is higher. Conclusions are more balanced regarding housing
availability, with more uncertainty about causal factors of housing shortage. The study
found that local specificities play an important role, such as average income growth,
unemployment rates or rates of housing ownership.

Housing availability is primarily established as the difference between the rate of housing
construction and the rate of local population increase: the more households there are, the
more need there is for new housing to be built. Local authorities should keep pace with
population fluctuations to ensure a balanced housing market but as shown in the case
study reports, this is hardly the case in any of the 11 cities. Moreover, existing imbalances
before 2008 were aggravated by the slow recovery of the construction sector post-crisis.

Traditional accommodation providers
In terms of price, collaborative short-term rental platform listings tend to be cheaper than
hotel rooms (up to a third in Athens, Brussels, Lisbon or Paris). However, the study
suggests traditional accommodation operators are not negatively impacted by the
collaborative accommodation offer, as overall both types of actors benefit from the
increasing tourist flow in the city.

In terms of occupancy rate, the 11 case studies show that occupancy rate is lower for
collaborative economy listing compared to hotels, which suggests that providers of short-
term rentals operate on an occasional basis.

The research findings suggest potential complementarity between the two offers, as the
collaborative accommodation supply meets the demand of a different target group (e.g.
budget travellers, seeking local experiences), and is more deconcentrated in rural
areas/outskirts of the city centre.

Income and tourism indicators
The study shows that the income providers earn from their collaborative economy activity
accounts for a minor part of their monthly revenue and tends to be seasonal. This
can be attributed due to lower prices in the short-term rental market, the occasional nature
of the activity, and, in some cities, the limits imposed on the number of days providers can
rent out their property (e.g. Amsterdam, Paris and London). In most cities, average
revenues tend to increase year-on-year, with highest growth noted in Barcelona,
Stockholm, Amsterdam and Lisbon.

Qualitative evidence from the case studies illustrates that collaborative short-term rental
platforms tend to have a positive impact on tourism in increasing the number of
incoming tourists overall, or in certain (more remoted) areas of the city. Short-term rental
platform guests tend to stay longer in their rentals and to travel more often, which is
attributed to lower prices, and the intention to discover local and non-touristic areas.

In the cities considered, the attractiveness of the short-term rental or home exchange offer
did not seem to deter travellers from booking hotels, as the number of nights spent
in all types of tourist accommodation facilities has increased in most cities under the study.

                                                                                                 6
Annex 5
Impacts on local communities
Overall, the impact of the collaborative accommodation sector on the local economic
growth is challenging to assess. The study shows that while collaborative economy guests
tend to spend in local businesses, and stay longer, they tend to spend less than the average
tourist.
Most case study reports conclude that the increase in the number of short-term rentals,
cumulated with the high percentage of entire place listings, may have put pressure on
the local housing supply. Clear correlation between the two factors are challenging to
establish, as other factors should be taken into account such as scarcity of the number of
dwellings for residential use, rise of prices due to the economic and financial crisis. The
study found that in some cities, local authorities have made efforts to counter the housing
supply shortage with the construction of new dwellings for residential purpose (e.g.
London), the promotion of sustainable home sharing (e.g. Amsterdam), or the cap in the
number of short-term rentals and hotels allowed (e.g. Barcelona).
The study has reported mixed views from inhabitants regarding the collaborative economy
in the accommodation tourism sector. While academic research and collaborative platforms
highlight advantages for local residents (i.e. the opportunities to gain additional income,
positive externalities brought in outer areas, social and cultural experiences), local
stakeholders have pointed out negative impacts on the peacefulness of neighbourhoods or
housing prices. Opinion surveys in some cities (i.e. Barcelona and Florence) have shown
that the majority of inhabitants perceive tourism positively, and negative opinions
are higher in areas with high tourist pressure.
There are limited data available on the relationship between the collaborative
accommodation sector and public services. Most local-level stakeholders have highlighted
possible pressures on the public service offer, for instance in transport services, waste,
garbage disposal, or public infrastructure. Yet, it is difficult to attribute these issues to the
collaborative accommodation offer only, and they should be rather taken as a consequence
of mass tourism as a whole.
Future developments
The collaborative economy in the tourism accommodation sector has grown in recent years
and, for this reason, is increasingly under the focus of policy makers. In cities like Athens,
Berlin, Brussels, Paris or Florence the collaborative short-term rental market has already
been regulated, but in most cases, it is yet too early to assess effectiveness of
regulatory changes.
The cross analysis of case study reports shows that there are several ongoing and future
developments at the city level:
There are plans to regulate the collaborative economy in the accommodation sector
(i.e. city level: Barcelona, London; country level: France, Portugal);
There are plans to extend cooperation with collaborative short-term rental platforms
at the local level and enforce existing agreements (i.e. Amsterdam and London);
New cities plan to set up online registers of short-term accommodation providers
(i.e. Lisbon); and
Another new development is an attempt to create an alternative to already
established collaborative short-term rental platforms. For example, FairBnB is a
recent movement by local Amsterdam residents to set up their own platform.
7Annex 5
1 Introduction
1.1 Aims and objectives of this task
The objective of Task 4 is to complement the regulatory analysis in Tasks 1 - 3 with 11
in-depth market case studies describing the economic development of the short-term
rental market in EU cities. The aim of this task is to provide data and identify trends in the
development of collaborative short-term rental platforms by assessing their impacts on:
the local short- and long-term housing availability,
the local tourism sector, and
the local community.
The 11 cities assessed are: Athens, Amsterdam, Barcelona, Berlin, Brussels, Florence,
Lisbon, London, Paris, Prague and Stockholm.
Figure 1: Map of the 11 EU cities within the scope of Task 4
STOCKHOLM
AMSTERDAM BERLIN
LONDON
BRUSSELS
PARIS PRAGUE
BARCELONA FLORENCE
LISBON
ATHENS
The report presents a cross-analysis comparing impacts of the collaborative economy in
the short-term accommodation sector evidenced in the 11 case studies. Additional EU-level
literature, as well as input from EU-level stakeholders complement the cross-analysis
report by placing the comparison within the context of broader European trends.Annex 5
1.2 Methodological approach
The market case studies are structured according to a list of indicators as specified in
the Terms of Reference and presented in Table 1.
Table 1: List of indicators
No. Indicators Type of Reference in the
assessment report
Average market rental prices for short-term Table 3
rentals1
A1
Average market rental prices for long-term Table 6
rentals 2
Rooms or residences available for short-term Sub-section 2.1
A2
rental3,4
A3 Number of available residences (housing Table 5
stock) 5
Quantitative
A4 Number of available properties for long-term Table 6
rental (vacant dwellings)6
A5 Number of available rooms/properties offered Section 2.1
through collaborative short-term rental
platforms
A6 Short-term occupancy rate7 Table 9
A7 Average length of stay8 Section 0
Income gained through short-term rental Table 11
A8
activities9
1
Average rental price for renting an entire property for long-term (see definition) in the eleven urban areas
considered. The value corresponds to the monthly average rent paid in the last reference year considered in this
study (i.e. 2016).
2
Average rental price for renting an entire property for long-term (see definition) in the eleven urban areas
considered. The value corresponds to the monthly average rent paid in the last reference year considered in this
study.
3
The sum of all listings, divided into rooms and entire places, found on the EU-level and local collaborative short-
term rental platforms considered in the eleven urban areas. Note that the values do not consider the possibility
of double listings, i.e. the same room or property being listed on multiple collaborative short-term rental
platforms. The value, however, excludes listings in hotels, but it may include rooms in hostels or other type of
touristic houses (e.g. B&Bs) that operate as businesses.
4
The information presented on collaborative short-term rental platforms does not allow us to distinguish between
primary and secondary residences, or between residences (dwellings) and touristic houses. Where available, such
distinctions for one or several collaborative short-term rental platforms are indicated in the text, while the
indicator value corresponds to the sum of all entire listings available on the EU-level and local collaborative short-
term rental platforms considered.
5
The total number of registered residences (dwellings) available in the eleven urban areas under study in the
latest reference year considered (i.e. 2016). The number excludes all dwellings serving purposes other than
residential ones.
6
The number of vacant residences (dwellings) out of the total number of registered residences (dwellings) in the
eleven urban areas under study in the latest reference year considered (i.e. 2016 or latest available).
7
The occupancy rate refers to the percentage of nights a given property is rented out, out of the total number of
nights that property is available. Note that, depending on local laws, properties listed on collaborative short-term
rental platforms may be subject to a maximum limit of calendar days of availability. This aspect is considered in
the indicator: the ratio refers to the actual occupancy rate (i.e. considering the number of days the listing is
available), rather than a theoretical occupancy rate, which assumes availability up to the maximum limit
permitted, or up to the maximum number of calendar days per year.
8
The value refers to the average monthly length of rental for a property, either on collaborative short-term rental
platforms using AirBnB as a proxy, or in conventional accommodation providers such as hotels.
9
The value refers to the yearly median or average income gained from the rental of an average listing on
collaborative short-term rental platforms using AirBnB as a proxy, or for an average room rented via a
conventional accommodation provider. Note that for collaborative short-term platforms, various sources are
indicated to provide a more impartial value for this indicator.
9Annex 5
No. Indicators Type of Reference in the
assessment report
Percentage of total provider revenues Sub-section 4.1
A9
accounted for by short-term rental activities10
Number of tourists using collaborative short- Table 13
B1
term rental platforms
Share of collaborative economy users out of Table 13
B2 tourists using conventional accommodation
services
C1 Development of ancillary services Quantitative/ Section 5.1
Qualitative
C2 Housing supply changes Section 5.2
C3 Inhabitants’ perception of collaborative short- Section 5.3
term rental platforms Qualitative
C4 Impact on public services (e.g. public Section 5.4
transport, etc.)
Task 4 used the following data collection tools:
Interviews at the EU level;
Desk research; and
Semi-structured interviews at the city level.
Interviews at the EU level
10 EU-level interviews with collaborative short-term rental platforms and EU
representatives of the tourism sector were completed as a part of data collection. Table 2
presents a list of consulted stakeholders.
Table 2: List of consulted EU stakeholders
Stakeholder Category
AirBnB Platform
HomeExchange Platform
Guest2Guest Platform
HomeAway Platform
European Holiday Home Association Industry organisation
European Tour Operators Association Industry organisation
European Housing Forum Industry organisation
HOTREC (Hospitality Europe) Industry organisation
OuiShare Industry organisation
NecsTour Public authorities’ association
All interviews were semi-structured in nature and focused on broader European trends of
the collaborative economy in the accommodation sector providing context to the case study
assessment.
Desk research
Desk research gathered mainly secondary data and information regarding the economic
indicators presented in Table 1. The reviewed documents included:
10
The value refers to the percentage of annual income of the peer provider accounted for by revenues deriving
from their collaborative short-term rental platform activities. Due to data availability, the indicator uses AirBnB
statistics as a proxy for all collaborative short-term rental platforms in the eleven urban areas under study.
10Annex 5
statistics at the national, regional and local level,
surveys and economic reports assessing tourist flows, impacts on tourism,
developments on the short-terms rental market etc. prepared by national, regional
and local authorities
reports assessing development of collaborative economy in the accommodation
sector prepared by collaborative short-term rental platforms and market research
companies;
academic literature
websites dedicated to market developments, blogs, press publications, consumer
blogs etc
Semi-structured interviews at the city level
22 interviews were completed at the city level. In most cities, local authorities and tourism
organisations were consulted as part of the assessment. The list of interviewees is provided
in each case study report (individual case study reports are annexed to this report -
Annexes 1 to 11).
1.3 Issues and mitigation strategies
The main challenge in Task 4 related to obtaining access to quantitative data about the
economic indicators in last the five years. Specifically, the following issues with data
availability were noted:
There is no comprehensive database providing data for all economic indicators for
the past five years in each city making cross-comparison between cities challenging.
In most cases, if available, data go back to 2014 only. In certain cases, we provided
historical data (i.e. going back to 2008) to provide context to latest available
figures. In addition, the report also includes data on future trends in terms of
revenue growth and market penetration of the sector, based on Statista
information.
The city-level trends are assessed based on EU wide reports and studies such as
Eurostat, Trivago11, Statista, World Travel and Tourism Council database 12, Visit
Brussels’ EU-level analysis13, and Numbeo statistics on the cost of living 14. Case
study reports focused on the collection of information from national and local
sources, which was used to complement cross-analysis performed in Task 4 report.
Data regarding individual collaborative short-term rental platforms vary
significantly. In all cities only individual data regarding AirBnB exist 15. As a result,
given the comparative size of AirBnB’s offer in comparison to its closer competition
at the local level, AirBnB is used as a proxy for the collaborative short-term rental
market.
There was lack of quantitative information concerning development of ancillary
services, housing supply changes, inhabitants’ perception of collaborative short-
11
Data for hotels retrieved from Trivago:
http://ie1.trivago.com/contentimages/press/tHPI_villes_deurope_Dec_2016_VF.pdf
12
https://www.wttc.org/datagateway/
13
https://visit.brussels/binaries/content/assets/pdf/baro_hotel_11_2016_fr_extr.pdf
14
https://www.numbeo.com/
15
Data was purchased from AirDNA – a platform gathering AirBnB statistics regarding listings and users, i.e.
number of listings, number of booking, total host revenues, etc. Input from AirDNA was used to calculate: average
market prices for short-term rentals (A1); number of available properties for short-term rentals (A2) and number
of available rooms/properties offered through online means (A5).
11Annex 5
term rental platforms and impact on public services (e.g. public transport, etc). In
most case study reports, quantitative information, if available, is used to
complement qualitative assessment.
The sum of short-term rental properties available in each city should be taken as
an estimation. First, it is challenging to list all collaborative short-term rental
platforms due to the size of the accommodation offer. Second, attention must be
paid to the duplication of listings, as hosts may advertise the same room or property
across multiple collaborative short-term rental platforms and little information was
found on the number of duplicated listings.
12Annex 5
2 Overview of the accommodation sector
There are two types of economic activity in the short-term accommodation sector, notably,
conventional (e.g. hotels), as well as collaborative (i.e. services offered via short-term
rental platforms). This section of the report reviews the main players in the sector, as well
as the recent development trends of the late-comers, the collaborative short-term rental
platforms. Concretely, this section of the report answers the following questions:
I. How important is the tourism and accommodation sector in the target cities?
II. What are the largest collaborative short-term rental platforms in Europe?
III. How has the collaborative short-term rental sector evolved over the past five years?
IV. How will the collaborative short-term rental sector likely evolve in the future?
V. How relevant is the regulatory environment in explaining this evolution?
The above-mentioned sequence of questions allows us to complete the first step of the
analysis and finds out how relevant the collaborative short-term accommodation sector is
in the local economy of the 11 cities under study. Considering available data, Section 3
assesses what impacts it has on local housing conditions, as well as on traditional tourism
operators.
2.1 Main players in the short-term rental sector
This sub-section assesses the main collaborative short-term rental platforms operating in
the EU, based on the most popular platforms in the 11 cities under study. The objective of
this analysis is to estimate the total number of listings available in each city, determine
the limitation of such an indicator, and use it to assess to what extent this may affect local
conditions such as housing (section 3), tourism (section 4) or the local community
(section 0).
The main questions this sub-section will answer are:
I. How important is the tourism and accommodation sector in the target cities?
II. What are the largest collaborative short-term rental platforms in Europe?
Figure 2 shows that all travel and tourism activities generate total (direct and indirect)
value equivalent between 5 and 20% of the national GDP for the cities under study. At EU-
level, according to the World Travel and Tourism Council, all tourism and travel activities
will generate almost 3% of GDP in 2017,16. The same source indicates very similar figures
for the sector’s share of total employment, both in the 11 Member States, as well as at the
EU-level.
16
World Travel and Tourism Council (2017). Travel & Tourism economic impact 2017 European Union LCU.
Available at: https://www.wttc.org/datagateway/
13Annex 5
Figure 2: Share of GDP accounted for by the travel and tourism sector
25
% of national GDP
20
15
10
5
0
2009 2017 2027
Source: World Travel & Tourism Council Database
The tourism sector also accounts for a significant share of the local business units within
the 11 cities under study. Eurostat show that, at regional (NUTS 2-level17) close to 10% of
local units in Brussels, Berlin, Barcelona Lisbon, Florence or Prague are part of the sector,
with an increasing trend evidenced in Florence and Lisbon. Most of these businesses are
small or micro-enterprises, as HOTREC, an industry association, suggests based on its
representative’s opinion during a phone interview 18. Figure 3 highlights these trends over
the period 2009-2015.
Figure 3: Share of tourism local units out of all local units - NUTS 2-level19
12%
10%
8%
6%
4%
2%
0%
2009 2010 2011 2012 2013 2014 2015
Source: Eurostat (sbs_r_nuts06_r2)
17
The statistical sub-division system applied by Eurostat for EU Member States. The “Nomenclature of Territorial
Units for Statistics” (NUTS, using the French-language acronym) consists of three levels (NUTS 1, 2 and 3), each
one dividing a Member State into smaller units than the precedent. The NUTS-2 level corresponds, for instance,
to the French departments, the Italian regions, or the Spanish autonomous communities.
18
Interview with a HOTREC representative, 03.05.2015.
19
The graph presents data at NUTS 2-level, therefore the entire regions around the cities are included. For
instance, Barcelona in the graph stands for Catalunya, while Amsterdam stands for North Holland, or Florence for
Tuscany.
14Annex 5
To define what the most commonly used collaborative short-term rental platforms are in
the 11 cities under study, the case studies investigated the international collaborative
short-term rental platforms with the largest number of listings in each city. The websites
were also selected according to their availability in other EU Member States, so that the
data could be comparable across the 11 cities.
Based on statistics retrieved at EU-level via literature and reports, as well as using platform
data at local level, the largest collaborative short-term rental platforms in the 11 cities
under study are AirBnB, Wimdu, 9flats, HomeAway, HomeExchange and
GuestToGuest. Other collaborative short-term rental platforms, which are not specifically
focused on P2P short-term rentals but host them, are Booking.com, HouseTrip and FlipKey.
In addition, LoveHomeSwap is an important player in the home exchange market, however
it is difficult to correctly identify the number of listings available for certain locations.
In addition, as shown in the 11case study reports other collaborative short-term rental
platforms, such as LeBonCoin, EntreParticulares, 2deHands, SpareRoom or KamerNet host
classified ads for short-term rentals, although these are not easily distinguishable from
long-term listings. Finally, some collaborative short-term rental platforms are only
available in certain Member States, and thus specific to them. These include Rentalia and
Idealista in Spain, Bedycasa and Sejourning in France or WG-Gesucht in Germany.
We have identified 274,756 listings on the six main EU-level collaborative short-term rental
platforms: AirBnB, Wimdu, 9flats, HomeAway, HomeExchange and GuestToGuest in the
11 cities under the study. Additionally, adding listings from more local collaborative short-
term rental platforms, as well as from international platforms primarily targeting hotels,
such as Booking.com or TripAdvisor, we find a total of 355,903 available properties for
short-term rental. In total, 280,099 listings (or 78.7%) are entire properties, and 59,162
(or 16.6%) are private or shared rooms20.
Table 3 provides an overview of the size of the EU-level collaborative short-term rental
platforms in the 11 cities assessed in this task. As evidenced in the table, AirBnB has, by
far, the most listings (55.6% of the total), followed by HomeAway. In total, 269,360 short-
term rental listings (87%) and 40,530 (13%) home exchange listings were identified at
EU-level in the period May-August 2017.
Table 3: Overview of available platform listings in the 11 cities under study, for
the main EU-level collaborative short-term rental platforms
Guest
Home Home
City AirBnB Wimdu 9flats to Total
Away Exchange
Guest
Amsterdam 12,581 766 161 3,352 1,042 1,300 19,202
Entire property 9,359 490 161 3,352 1,042 1,300 15,704
Private/shared 3,161 625 - - - -
3,786
room
Athens 4,593 581 156 395 4 1,100 6,829
Entire property 3,908 532 155 395 4 1,100 6,094
Private/shared 679 49 1 - - -
729
room
Barcelona 17,369 3,417 1,419 5,051 1,113 5,700 34,069
20
The calculation was made based on the available data, disaggregated by type of listing, on certain platforms.
Among the EU-level platforms under study, AirBnB, Wimdu and 9flats specify the number of entire properties and
of rooms, while the other platforms only list entire properties. At city-level, certain platforms also provide this
level of disaggregation, and their data was included in the calculation to sum up with the overall numbers of
entire properties and rooms.
15Annex 5
Guest
Home Home
City AirBnB Wimdu 9flats to Total
Away Exchange
Guest
Entire property 8,762 1,356 1,323 - 1,113 5,700 18,254
Private/shared 8,607 299 73 - - -
8,979
room
Berlin 11,902 1,129 600 1,092 703 1,600 17,026
Entire property 5,933 947 495 1,092 703 1,600 10,770
Private/shared 5,969 182 105 - - -
6,256
room
Brussels 4,489 214 139 619 28 1,100 6,589
Entire property 2,978 185 139 619 28 1,100 5,049
Private/shared 1,511 29 - - - -
1,540
room
Florence 8,379 1,027 610 7,822 128 650 18,616
Entire property 6,251 887 597 7,822 128 650 16,335
Private/shared 2,128 140 13 - - -
2,281
room
Lisbon 10,682 1,802 877 4,729 79 560 18,729
Entire property 8,227 1,643 814 4,729 79 560 16,052
Private/shared 2,455 159 47 - - -
2,661
room
London 49,348 3,527 1,840 6,374 653 1,100 61,186
Entire property 24,543 2,767 1,681 6,374 653 1,100 37,118
Private/shared 23,157 760 103 - - -
24,020
room
Paris 41,355 2,298 1,462 9,915 2,276 18,500 75,806
Entire property 36,184 2,178 1,435 9,915 2,276 18,500 70,488
Private/shared 5,171 120 27 - - -
5,318
room
Prague 10,411 1,009 377 1,415 77 180 13,469
Entire property 8,225 946 360 1,415 77 180 11,203
Private/shared 2,186 63 17 - - -
2,266
room
Stockholm 2,413 115 14 266 411 16 3,235
Entire property 1,996 91 13 266 411 16 2,793
Private/shared 415 24 1 - - -
440
room
Total 173,522 15,885 5,999 41,030 6,514 31,806 274,756
Source: collaborative short-term rental platform websites, as well as interview with GuestToGuest on 18/04/2017.
The number of available properties for short-term rental should be interpreted with
caution. First, it is difficult to list all collaborative short-term rental platforms due to the
size of the accommodation offer. Second, attention must be paid to the duplication of
listings (see Box 1), as hosts tend to advertise the same room or property across multiple
collaborative short-term rental platforms. This view was supported by stakeholders in
Amsterdam, Barcelona, London, Lisbon, Paris and Brussels, as well as from EU-level
stakeholder such as the EHHA and HOTREC and there is very little information of the ratio
of duplicated listings. Third, it might be the case that entire flats are listed as independent
rooms, therefore, for instance, a three-bedroom flat might count as three listings, if each
room is listed separately. Fourth, shared rooms might also be separately advertised as
private rooms.
16Annex 5
Box 1: Duplication of listings
The duplication of listings is a feature specifically highlighted by stakeholders in five of the
eleven case studies21. Unfortunately, data on duplicated listings was not available from
local stakeholders, although interviewees in Amsterdam 22, Barcelona23 and Lisbon24
admitted that this practice is widespread and should be accounted for.
The Government of Catalonia found that 40% of collaborative short-term rentals are not
registered (illegal), and that only 23% of AirBnB listings are registered (legal)25. In
Amsterdam, the municipality pointed to the emergence of property managers such as
IAmBnB, which manage one listing on several platforms, and sees them as key actors in
the future development of collaborative short-term rental market in the city26. In Lisbon,
the homeowners’ association states that 1/3 of providers exclusively rely on AirBnB, while
the rest use multiple collaborative short-term rental platforms. Only 10% of listings,
according to them, are not on major collaborative short-term rental platforms27. As a
result, it is very challenging to estimate the number of listings for a given city, and public
authorities themselves have encountered this problem for their own research. 28
The phenomenon of listing a property on multiple collaborative short-term rental websites
is common, and is discussed on online forums 29, in news articles30, and even in books
related to short-term rental in general 31. According to a statement by HomeAway’s CEO in
2014, 6% of HomeAway listings that year were also listed on AirBnB, an increase from the
2% recorded in 201232. Fortune (2014) also states that 40% of listings on HomeAway are
posted by property managers rather than homeowners.
There are many tools for property managers and homeowners to list their properties on
more than one collaborative short-term rental platform. Property managers take care of
the full process of the listing, renting out, cleaning and charging tourists. Such property
managers include IAmBnB, AirSorted, Pillow.com HostMaker or Halldis. AirBnB also
launched a co-hosting service in October 2016, allowing its peers to act as property
managers and earning a fee33.
On the other hand, channel managers are online software tools allowing property
managers and homeowners to efficiently track the listings on multiple collaborative short-
term rental platforms, and to handle bookings. Such channel managers include Kigo.net,
Lodgify, Beds24 or Guesty.
21
Amsterdam, Barcelona, Lisbon, London and Paris.
22
Interview with Amsterdam municipality representative 2: 08/06/2017.
23
Interview with the Directorate for Tourism of the Barcelona City Council, 30/05/2017.
24
Interview with Associação do Alojamento Local em Portugal on 27/06/2017.
25
Barcelona City Council, 2016, Impacte del lloguer vacacional en el mercat de lloguer residencial de Barcelona.
26
Interview with Amsterdam municipality representative 2: 08/06/2017.
27
Interview with Associação do Alojamento Local em Portugal on 27/06/2017.
28
As noted notably by the City Council of Barcelona on 30/05/2017.
29
https://www.tenerifesforumoffun.com/t9282-airbnb-duplicate-properties
30
https://www.tnooz.com/article/silently-debuting-homestays-booking-com-jabs-airbnb/
31
https://getpaidforyourpad.com/podcast/airbnb-vs-homeaway-vrbo/
32
http://fortune.com/2014/03/12/growing-quietly-in-airbnbs-shadow/
33
https://peymans.uk/airbnb-co-hosts-feature-is-launched/
17Annex 5
Local authorities have also attempted to estimate the share of duplicated listings: in
Amsterdam, an upcoming study will rely on input from local providers, collaborative short-
term rental platforms and rental agencies34. In Lisbon, the Portuguese Association of Local
Lodgings estimated that two thirds of all listings are advertised on multiple
collaborative short-term rental platforms.
An alternative way to calculate the number of available properties for short-term rental is
to use local landlord registers, where available. However, there are two caveats to this
method. Firstly, these registers are not available in all cities under the study. Secondly, as
the registers came into the force only recently, not all providers would feature in the
databases. For example, in Lisbon, where such a registry is available nationwide, the
Portuguese Association of Local Lodgings highlighted that 22% of all active listings are not
in the registry, however, no evidence was found to support this view 35. In Barcelona, where
peer providers must register with the Catalan Tourist Register, the City Council found 5,257
non-registered properties, or 35% of all listings accounted in their study. In Brussels,
where such a registry was implemented in March 2016, at the time of drafting only less
than 2,000 peer providers were listed.
Other stakeholders involved in the discussion regarding the short-term rental sector
include local public authorities, tourism associations, short-term rental sector associations,
collaborative economy associations, housing associations and homeowners’ association.
These types of stakeholders consulted as part of this study, expressed their opinions
regarding the development of the short-term rental sector and its impacts.
2.2 Overview of the economic development of the short-
term rental sector
This section focuses on the past and foreseen development trends of the collaborative
short-term rental sector in the EU, as well as in the 11 cities under study. In doing so, this
sub-section attempts to answer the following questions:
I. How has the collaborative short-term rental sector evolved over the past five years?
II. How will the collaborative short-term rental sector likely evolve in the future?
III. How relevant is the regulatory environment in explaining this evolution?
The collaborative short-term rental sector has been rapidly developing over the past
decade. EU-level stakeholders like OuiShare, EHHA, AirBnB, HomeAway, NecsTour, as well
as city-level stakeholders36, noted that peer-to-peer short-term rentals were common
before the arrival of collaborative short-term rental platforms, but such platforms
contributed to making the sector more efficient37. Collaborative platforms involved in the
home exchange sector also point to a strong growth of their market in the past decade and
expect this trend to continue in the coming years38.
34
At the time of drafting, the Amsterdam municipalities specified that they are conducting a study in which they
attempt to provide statistics on the number and type of platforms in the short term renal sector operating in the
city, as well as on the impacts these have on the local community. Based on an interview with the Amsterdam
municipality on 08/06/2017.
35
Interview with the Portuguese Association of Local Lodgings on 26/06/2017.
36
For instance, the Government of the Czech Republic (interview on 09/06/2017).
37
Interviews with EHHA (26/04/2017), OuiShare (27/04/2017), AirBnB (13/04/2017), HomeAway (20/06/2017)
and NecsTour (12/04/2017).
38
Interviews with HomeExchange (07/04/2017) and GuestToGuest (18/04/2017).
18Annex 5
The growth of the short-term rental sector is evidenced by various city- and national-level
statistics and studies. Although more detailed information on such trends is available in
the annexes to this report, it is worth mentioning a few examples:
In Lisbon, based on the number of providers registered in the National Registry of
Local Lodgings, the number of short-term rental lodgings increased by 260.2%
between 2015 and end May 2017. In June 2017, 8,147 establishments were
registered as local short-term rental lodgings in Lisbon (19% of the total number of
registered lodgings in Portugal), with a total capacity of 30,987 beds. 39.
In Barcelona between 2010 and 2015 the number of registered residences for
tourist use increased more than four-fold (from about 2,350 to 9,600), prompting
authorities to place a moratorium on the number of providers 40. Despite this, the
Barcelona City Council suggests that 40% of the supply of tourist homes is illegal 41.
InsideAirBnB, a website retrieving and analysing data from AirBnB’s publicly
available information, finds that 78% of listings do not display their license
number42.
In France, the French National Institute of Statistics and Economic Studies (INSEE)
found that between 2015 and 2016 the number of properties rented out via
collaborative short-term rental platforms increased by 30%, to 25 million43. In
Florence, between 2012 and 2015, the number of holiday dwellings for renting has
grown by 15%44.
City- and country-reports published by AirBnB also evidence the fast growth of
collaborative short-term rental platforms in Europe (see case studies annexed to this
report). To complement such reports, Coyle and Yeung (2016) map the development of
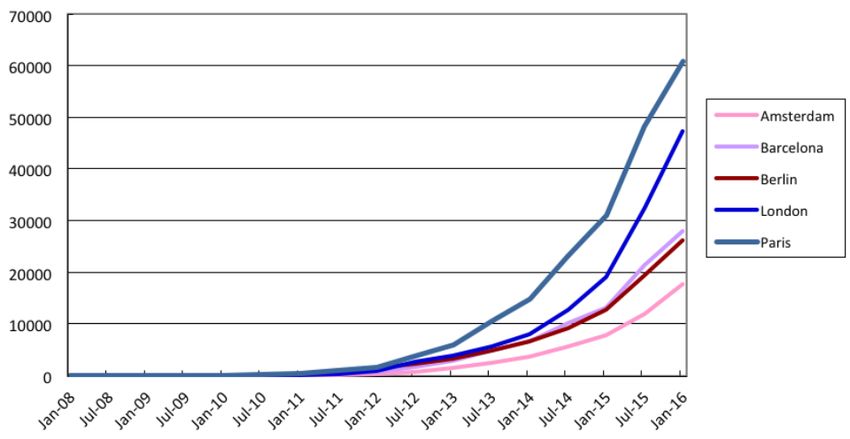
AirBnB listings in 14 European cities and rely on AirBnB data to display their growth trends
in Amsterdam, Barcelona, Berlin, London and Paris45. Figure 4 maps the evolution of the
number of AirBnB listings between 2008 and 2016, based on their findings.
39
Written answers provided by the Lisbon Tourism Office on 07/06/2017.
40
Studies Department, Barcelona City Council based on Catalan Government data.
41
El País, 7 September 2016, “El 40% de los pisos turísticos de Barcelona son ilegales”. Available at:
http://ccaa.elpais.com/ccaa/2016/09/06/catalunya/1473172001_414770.html, accessed on 24/05/2017.
42
Inside AirBnB – Barcelona. Available at: http://insideairbnb.com/barcelona/#, accessed on 29/05/2017.
43
INSEE (2017). Les logements touristiques de particuliers proposés par internet. Available at :
https://www.insee.fr/fr/statistiques/2589218. Accessed on 21/04/17.
44
Data extracted on 10 May 2017 16:33 UTC (GMT) from I.Stat: https://www.istat.it/en/
45
Coyle, D., Yeung, T. (2016). Understanding AirBnB in Fourteen European cities. The Jean-Jacques Laffont Digital
Chair, Toulouse School of Economics.
19Annex 5
Figure 4: Evolution in the number of AirBnB listings in five cities
Source: Coyle, D., Yeung, T. (2016) 46, based on data provided by AirBnB
Collaborative platforms in the home exchange sector, such as HomeExchange and
GuestToGuest, also point to a growing trend to share homes 47. HomeExchange was
launched in 1992 in California, and only became international around 2010. Between 2005
and 2016, its membership has grown eleven-fold to 67,000 in 2016, and the platform
claims to have facilitated over one million home exchanges since 1992 48.
The initial philosophy of early market entrants like HomeExchange was to be very regional
and as close to its users as possible. The collaborative platform indicated that this approach
constricted the market to grow at a moderate level over the years, before expanding
internationally49. With the emergence of new home exchange market entrants like
GuestToGuest, Trampolinn or SwitchHome, the market expanded internationally,
especially due to their ‘a la carte’ offer50. The success of some, like GuestToGuest, founded
in 2011, enabled them to take over older market players – GuestToGuest acquired
HomeExchange in March 2017. The international orientation of new home exchange
providers, as well as innovations in their service range contributed to a faster growth rate:
between 2014 and March 2017 GuestToGuest increased its number of listings six-fold to
280,00051. GuestToGuest, along with newly-acquired HomeExchange aim for a community
of one million people by 2019. According to home exchange platforms, their growth will
have them compete with collaborative short-term rental platforms like AirBnB or
HomeAway, rather than with hotels. As a consequence of the increased regulatory zeal of
local authorities towards short-term rentals, collaborative home exchange platforms see
46
Coyle, D., Yeung, T. (2016). Understanding AirBnB in Fourteen European cities. The Jean-Jacques Laffont
Digital Chair, Toulouse School of Economics.
47
Interviews with HomeExchange (07/04/2017) and GuestToGuest (18.04.2017).
48
HomeExchange (2017). HomeExchange factsheet. Available at:
https://dax87tnsniies.cloudfront.net/images/in-the-news/5b6acmul6.pdf
49
Interview with HomeExchange (07/04/2017).
50
Interview with HomeExchange (07/04/2017).
51
http://blog.guesttoguest.com/guesttoguest-acquires-homeexchange/
20Annex 5
an opportunity to provide an alternative which, according to them, has a more limited
impact on real estate prices or nuisance to locals52.
Looking at prospects for future development, Statista, a private global statistics service,
provides forecasts into the vacation rentals industry53. Statista estimates that the industry
has experienced growth in EU Member States and is expected to further develop in the
future. In terms of industry revenues for the 11 EU Member States, where 11 cities under
the study are based, Statista estimated a growth of 12.54% between 2015 and 2016,
11.14% between 2016 and 2017, and forecasts a growth of 33.47% between 2017 and
202154.
Figure 5 shows the growth trends in revenues for the vacation rentals industry between
2015 and 2021 for the 11 EU Member States whose cities are within this report’s scope.
Figure 5: Current and forecasted revenues for the vacation rentals industry
120%
% growth over previous year
100%
80%
60%
40%
20%
0%
2016 2017 2021
Source: Statista; Data for Greece is not available.
All EU-level stakeholders interviewed as part of this study agree that the short-term rentals
sector, including home exchange activities, will grow over the coming years. Platforms like
AirBnB and HomeAway see their growth coming ever more from listings in peripheral and
rural areas, rather than city centres. As also evidenced by HomeExchange, this trend points
52
Interviews with HomeExchange (07/04/2017) and GuestToGuest (18/04/2017).
53
The “Vacation Rentals” segment comprises of private accommodation that was arranged and booked online.
This includes private holiday homes and houses e.g. HomeAway, as well as short-term rental of private rooms or
flats via portals such as Airbnb. Users represent the people who booked the accommodation, independent of the
number of guests staying at the accommodation on that booking.
Offline bookings made, for example, in a travel agent’s office or by telephone are not included; a prerequisite for
this segment is an online checkout process. Furthermore, hotels and professionally-run accommodation such as
guest houses are not included.
54
Information retrieved from Statista on 30/06/2017. Available at:
https://www.statista.com/outlook/268/100/vacation-rentals/worldwide
21You can also read