Greater Birmingham and Solihull LEP Black Country Local Authorities Strategic Housing Needs Study Stage 3 Report
←
→
Page content transcription
If your browser does not render page correctly, please read the page content below
Greater Birmingham and Solihull LEP
Black Country Local Authorities

Strategic Housing Needs Study
Stage 3 Report

Peter Brett Associates
August 2015

Office Address:

16 Brewhouse Yard, Clerkenwell, London EC1V 4LJ
T: +44 (0)207 566 8600 E: london@peterbrett.com
Project Ref 29710
Peter Brett Associates LLP disclaims any responsibility to the client and others in respect of any
matters outside the scope of this report. This report has been prepared with reasonable skill, care and
diligence within the terms of the contract with the client and taking account of the manpower,
resources, investigations and testing devoted to it by agreement with the client. This report has been
prepared for the client and Peter Brett Associates LLP accepts no responsibility of whatsoever nature
to third parties to whom this report or any part thereof is made known. Any such party relies upon the
report at their own risk.
© Peter Brett Associates LLP 2015

THIS REPORT IS FORMATTED FOR DOUBLE-SIDED PRINTING
.

                                                                                                      ii
Strategic Housing Needs Study
Stage 3 Report
CONTENTS
1 INTRODUCTION .......................................................................................................... 1
Study overview ............................................................................................................. 1
2 STAGE 2 FINDINGS UPDATED .................................................................................. 3
Geography ................................................................................................................... 3
Objectively assessed housing need ............................................................................. 4
Land supply .................................................................................................................. 9
3 SCENARIOS OVERVIEW ...........................................................................................14
4 INTENSIFICATION .....................................................................................................18
Introduction .................................................................................................................18
Background .................................................................................................................18
Derelict, vacant and undeveloped land ........................................................................18
Employment land ........................................................................................................19
Estate regeneration .....................................................................................................20
Higher urban densities ................................................................................................21
Land allocations ..........................................................................................................22
Summary.....................................................................................................................23
5 URBAN EXTENSIONS ...............................................................................................24
Introduction .................................................................................................................24
Previous proposals ......................................................................................................24
Conclusion ..................................................................................................................30
Summary.....................................................................................................................31
6 PUBLIC TRANSPORT CORRIDORS .........................................................................33
The rail network ...........................................................................................................33
Development capacity near stations ............................................................................36
Conclusion ..................................................................................................................40
Summary.....................................................................................................................42
7 FUTURE JOBS AND THE ENTERPRISE OPTION ....................................................44
Future job growth ........................................................................................................44
Aligning housing and jobs............................................................................................46
Conclusion ..................................................................................................................51
Summary.....................................................................................................................51
8 DISPERSED GROWTH ..............................................................................................52
August 2015 iiiStrategic Housing Needs Study
Stage 3 Report
Introduction .................................................................................................................52
Distributing the shortfall ...............................................................................................53
Scale of growth ...........................................................................................................54
Conclusion ..................................................................................................................56
Summary.....................................................................................................................56
9 NEW TOWNS / NEW SETTLEMENTS .......................................................................58
Redditch New Town ....................................................................................................58
Additional new settlements ..........................................................................................60
Conclusion ..................................................................................................................63
Summary.....................................................................................................................64
10 CONCLUSION ............................................................................................................66
Brownfield land............................................................................................................66
Where could additional homes be? .............................................................................67
How can these new homes be delivered? ...................................................................68
Exports ........................................................................................................................70
TABLES
Table 2.1 Housing need, 2011-31: two demographic projections........................................... 7
Table 2.2 Housing need and supply, 2011-31 ......................................................................11
Table 7.1 Workplace job growth, Greater Birmingham HMA, 2011-31 ..................................45
Table 7.2 The Enterprise option ...........................................................................................47
FIGURES
Figure 2.1 Difference in HRRs by age band in 2021 between CLG 2012 and CLG 2011,
England 6
Figure 3.1 The Green Belt ....................................................................................................16
Figure 4.1 Intensification summary .......................................................................................23
Figure 5.1 Urban Extensions summary .................................................................................32
Figure 6.1 Public Transport Corridors summary ...................................................................43
Figure 7.1 Workplace jobs, Greater Birmingham HMA, 2001-31 ..........................................46
Figure 7.2 Enterprise Belt mapping ......................................................................................50
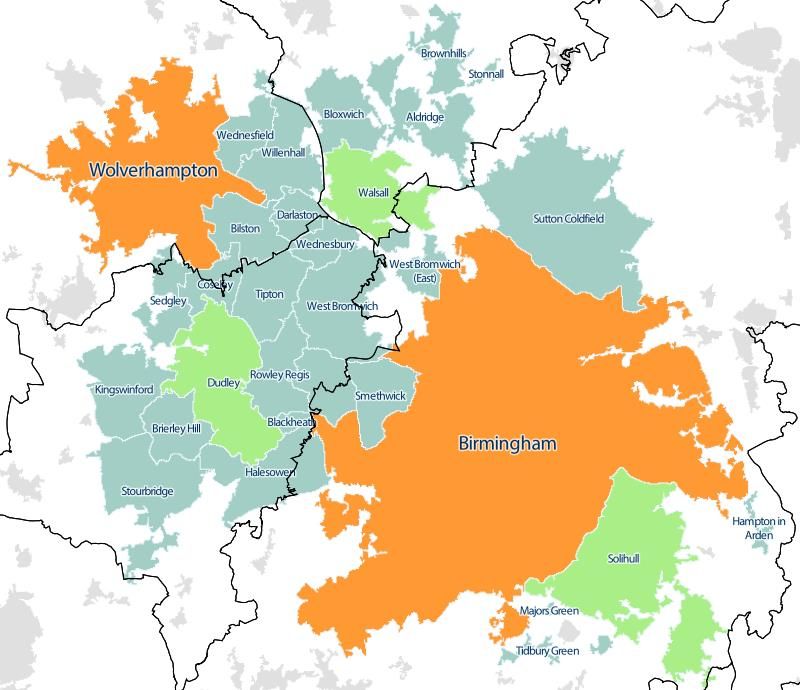
Figure 8.1 The West Midlands Built-up Area ........................................................................52
Figure 8.2 Population in ‘shire district main settlements’.......................................................53
Figure 8.3 Illustrative distribution Dispersed Growth option ..................................................54
Figure 8.4 Estimated change in dwelling stock, selected settlements, 2001-11 ....................55
Figure 8.5 Dispersed Growth summary ................................................................................57
Figure 9.1 New Settlements summary ..................................................................................64
August 2015 ivStrategic Housing Needs Study
Stage 3 Report
1 INTRODUCTION
Study overview
1.1 This study was commissioned by the Greater Birmingham and Solihull Local
Enterprise Partnership (GBSLEP) and the Black Country Authorities. These
commissioning bodies jointly cover the local authority areas of Birmingham,
Bromsgrove, Cannock Chase, East Staffordshire, Lichfield, Redditch, Solihull,
Tamworth, Wyre Forest, Dudley, Sandwell, Walsall and Wolverhampton. The study
has three main purposes: to assess future housing need across the sub-regional
housing market area in the plan period 2011-31; to compare it with the land supply
currently identified; and, if supply falls short of need, to explore spatial options for
meeting that shortfall.
1.2 The first two questions were addressed in the Stage 2 report of the study, published
in November 2014. For the study area specified above over the plan period, that
report showed a shortfall of some 27,000-61,000 dwellings: the difference between
objectively assessed housing need for 204,000-238,000 net new dwellings and
identified land supply for 177,000 dwellings1.
1.3 In the present Stage 3 study we consider spatial options (scenarios) for distributing
this shortfall between local authority areas, which were initially defined by the study
brief as follows:
- Scenario 1: Intensification – deliver extra dwellings through increased densities
and / or intensification of existing urban areas;
- Scenario 2: Peripheral Urban Extensions – distribute the shortfall to the urban
periphery of the conurbation, close to areas where growth pressures are greatest;
- Scenario 3: Public Transport Corridors – distribute the shortfall according to spare
capacity and growth potential in the rail network;
- Scenario 4: Enterprise – base the distribution on future employment growth, to
ensure a broad balance between housing and employment;
- Scenario 5: Dispersed Growth – distribute the growth to shire districts, in
proportion to the population of main urban settlements;
- Scenario 6: New Towns / Settlements – distribute the shortfall to expansion of
existing New Towns at Redditch and Telford, together with potential new
settlements.
1.4 Chapters 3-9 below will consider these scenarios in turn. But first, in the next chapter,
to set the context we briefly recap and update the main findings of the Stage 2 report.
This is a necessary step because, in the months since that report was completed,
there have been important changes in circumstances.
1
Numbers in the text are rounded.
August 2015 1Strategic Housing Needs Study
Stage 3 Report
1.5 The study throughout was overseen by a steering group comprising officers from the
client authorities. We thank group members for their invaluable contribution.
August 2015 2Strategic Housing Needs Study
Stage 3 Report
2 STAGE 2 FINDINGS UPDATED
Geography
2.1 In accordance with national policy and guidance, where housing market areas
(HMAs) straddle administrative boundaries housing needs assessments should deal
with HMAs, rather than individual local authority areas. Therefore, in Stage 2 of this
study an early step was to determine if the study’s client authorities, listed at
paragraph 1.1 above, formed an HMA within the meaning of the NPPF and PPG. The
analysis confirms that most of the client authorities are linked by migration and
commuting into a single ‘Greater Birmingham HMA’. However the edges of the two
geographies do not quite match:
The local authority areas of East Staffordshire and Wyre Forest do not belong to
the HMA, despite being part of GBSLEP. A more accurate market geography
would group East Staffordshire with Derbyshire and Wyre Forest possibly with
Worcestershire.
Conversely, the local authority areas of South Staffordshire, North Warwickshire
and to a lesser extend Stratford-on-Avon do belong to the HMA, although they are
not part of either GBSLEP or the Black Country. South Staffordshire is closely
linked to the Black Country and North Warwickshire to the GBSLEP area.
Stratford is more difficult to classify. The evidence suggests that it’s very large
land area is split between several HMAs, and only the northern section has close
links to GBSLEP.
2.2 The Planning Inspector who recently examined the Birmingham Development Plan
endorsed the above conclusions, and asked for housing needs evidence to cover the
‘true HMA’ - excluding East Staffordshire and Wyre Forest but including South
Staffordshire, North Warwickshire and Stratford-on-Avon. The steering group for the
present strategic study has also resolved that Stage 3 should focus on that true HMA,
rather than the client authorities covered by GBSLEP and the Black Country and
listed at paragraph 1.1. Accordingly, throughout this report we classify the local
authorities as follows:
- The Birmingham sub-market comprises Birmingham, Bromsgrove, Cannock
Chase, Lichfield, Redditch, Solihull, Tamworth, North Warwickshire, and Stratford-
on-Avon.
- The Black Country sub-market comprises Dudley, Sandwell, Walsall,
Wolverhampton and South Staffordshire.
- The two sub-markets combined form the Greater Birmingham HMA.
- The HMA, together with East Staffordshire and Wyre Forest, form the extended
study area.
2.3 The use of a Black Country and Birmingham sub-market in this report is purely
illustrative. These two geographies have no formal status and the NPPF requires
planners to provide for the needs to the HMA as a whole.
August 2015 3Strategic Housing Needs Study
Stage 3 Report
Objectively assessed housing need
2.4 As noted earlier, in Stage 2 of this study we assessed housing need as a range,
which for the client authorities in 2011-31 was between 204,200 and 237,500 net new
dwellings. Once recalculated for the HMA the range becomes 207,100-234,800
dwellings – very close to the original figures, because the impact of removing East
Staffordshire and Wyre Forest is almost exactly balanced by adding South
Staffordshire, North Warwickshire and Stratford.
2.5 In the present stage of the work we revisit if this needs assessment is still fit for
purpose; and also to express it as a single best estimate, because in developing
spatial options it is impractical to work with a range. For this we need to consider two
issues, which are discussed in turn below: firstly unattributable population change
(UPC) and secondly the implications of the new 2012-based CLG household
projections.
Unattributable Population Change
2.6 In the Stage 2 findings, the difference of 27,800 dwellings between the minimum and
maximum estimates of housing need is largely accounted for by one factor: UPC. As
discussed at length in the Stage 2 report, the UPC is an error in the official population
statistics, which could be caused by misrecorded migration, miscounting in the 2001
and/or 2011 Censuses, or (more likely) a combination of both.
2.7 For the Greater Birmingham HMA, the minimum estimate of 207,100 dwellings in
effect assumes that all of the UPC is due to a Census or Censuses miscounting the
resident population, and conversely the maximum estimate of 234,800 dwellings
assumes it is due to misrecorded migration. In Stage 2 of the study we could not find
any evidence that would help us disentangle these causes. This is why we expressed
the objectively assessed housing need as a range, bearing in mind the observation in
Planning Practice Guidance (PPG) that this type of assessment is not an exact
science.
2.8 To provide a single best estimate of need we would ideally find a point between the
two ‘book-ends’, derived from a view of how the UPC divides between miscounted
population and misrecorded migration. But we have found no evidence that would
underpin such a view:
At national level the ONS in the 2012-based subnational population projections
(SNPP) (the latest available) decided to set aside the UPC, in effect assuming
that it was due to miscounted population2.
This decision has been carried forward into the 2012-based CLG household
projections, published on 27th February 2015, which group the population
projected by ONS into households.
The new CLG projections in turn were endorsed by the PPG, on the day they
were published, as ‘the most up-to-date estimate of future household growth’3.
2
The reasons for this decision are summarised in: Office for National Statistics, Questions and Answers: 2012-
based Subnational Population Projections, May 2014
August 2015 4Strategic Housing Needs Study
Stage 3 Report
At local level, as noted earlier we have found no evidence to set against the
national view embodied in the official projections and endorsed by the PPG.
2.9 For these reasons, the study steering group is satisfied that the ONS 2012-based
SNPP, which takes no account of the UPC, provides the best available population
projection available at this time.
2.10 Of the ‘book-end’ housing need figures produced by Stage 2 of this study, this points
to the lower one, equal to 204,200 dwellings over the plan period. This figure is based
on the ONS/PBA 2012 household projection, which groups the 2012-based SNPP
into households.
2.11 However, since we produced the Stage 2 report CLG has released a new official
household projection, which uses a different method for grouping the population into
households. We must consider whether this new household projection would be a
better starting point for Stage 3 of the study. This is the subject of the next section.
Implications of CLG 2012
2.12 As explained in the Stage 2 report, the factor that turns projected population into
projected household numbers is known as the household representative rate (HRR,
formerly headship rate). The HRR is the proportion of persons in each demographic
group (age x sex x relationship status) who are household representative persons
(formerly known as heads of household). CLG uses HRRs to translate the ONS
population projections into household projections. Independent demographers may
choose to use different HRRs.
2.13 When we produced the Stage 2 report last year, ONS had released the 2012-based
SNPP (‘ONS 2012’) but CLG had not yet released the resulting household projections
(‘CLG 2012’). Therefore the most recent official HRRs available were in the CLG’s
2008-based and interim 2011-based projections. The 2011-based set showed
considerably less household growth than the 2008-based one, because in the later
years of the last decade household formation had fallen behind earlier trends. The
CLG 2011 projections rolled forward this slowdown.
2.14 Bearing in mind these circumstances, our Stage 2 preferred household projections for
Greater Birmingham used ‘indexed’ HRRs - in effect a compromise between CLG’s
relatively optimistic 2008-based rates and its relatively pessimistic 2011-based rates.
This approach has been widely used in housing studies. It reflects the view that the
reduction in HRRs between the two projections was partly a recession effect that
would be reversed in due course and partly a permanent change due to other factors,
which would persist over the long term.
2.15 The new CLG 2012 household projection provides new official HRRs for the next 25
years, superseding the 2011 set. The new release uses the same projection method
as CLG 2011, but it is based on revised estimates of actual HRRs at 2011. Ideally
this vital information should be taken from the real-life evidence of the 2011 Census.
But, at the time the Stage 2 report was produced, for CLG 2011 these data were not
3
Reference ID: 2a-016-20150227
August 2015 5Strategic Housing Needs Study
Stage 3 Report
yet available, and therefore the 2011 HRRs by demographic group were estimated
from a mix of sources: national rates from the Labour Force Survey (LFS) and the
relative positions of local authorities principally from the CLG 2008 projections. When
CLG 2012 was being prepared, Census data on HRRs at 2011 were provided by
ONS but looked unreliable. Therefore CLG again had to resort to estimates of these
actual HRRs, and again these estimates were primarily derived from the LFS and
CLG 2008, though with greater inputs from the Census than before.
2.16 In line with the standard timetable of official releases, CLG 2012 next year will be
replaced by CLG 2014, which hopefully will be based on real-life HRRs from the 2011
Census, and hence much more robust.
2.17 For now, the new estimates of 2011 HRRs have had a large impact. CLG 2012
predicts significantly higher HRRs than CLG 2011, especially for the 25-34 age
group, but also for those aged 35-49 (Figure 2.1).
Figure 2.1 Difference in HRRs by age band in 2021 between CLG 2012
and CLG 2011, England
Source: CLG
2.18 Consequently CLG 2012 shows greater household growth than CLG 2011, and the
Greater Birmingham HMA is no exception. It also shows very similar household
growth to our preferred Stage 2 scenario, ONS/PBA 2012. In a sense this is not
surprising, since both projections are based on the same population, ONS 2012.
More interesting, they also agree on overall household formation – the relationship of
households to population – although they projected that household formation by quite
different methods.
2.19 Table 2.1 compares the housing need implied in CLG 2012 and our Stage 2 preferred
scenario (as before, we have assumed that 3% of dwellings are vacant or second
homes). For the HMA and the extended study area, the difference between the two
numbers is 2% or less; that is, they are virtually identical. For individual local
August 2015 6Strategic Housing Needs Study
Stage 3 Report
authorities the differences are greater, which is as one would expect, since
projections are generally less stable and less robust for smaller geographical areas.
Even so, there are just four authorities for which the two numbers differ by more than
5%.
2.20 In our Stage 2 report we showed projected population as well as housing need. Here
we do not repeat these population figures - which have not changed – for the sake of
brevity, and also because the present stage of the study focuses on meeting housing
need, as opposed to calculating that need.
Table 2.1 Housing need, 2011-31: two demographic projections
Net new dwellings ONS/PBA CLG
Difference Difference %
2011-31 2012 2012
Birmingham 89,004 88,409 -595 -1%
Bromsgrove 5,947 5,833 -114 -2%
Cannock Chase 5,985 5,846 -139 -2%
Lichfield 6,688 6,630 -58 -1%
Redditch 3,587 4,030 443 12%
Solihull 12,154 12,228 73 1%
Tamworth 4,206 4,243 37 1%
North Warwickshire 3,149 3,296 147 5%
Stratford on Avon 8,868 9,312 445 5%
Birmingham sub-area 139,588 139,828 240 0%
Dudley 12,686 12,501 -184 -1%
Sandwell 25,962 26,737 775 3%
Walsall 14,412 15,875 1,464 10%
Wolverhampton 10,284 11,410 1,126 11%
South Staffs 4,161 4,131 -31 -1%
Black Country sub-area 67,505 70,655 3,149 5%
Total HMA 207,093 210,482 3,389 2%
East Staffs 9,237 9,237 0 0%
Wyre Forest 4,000 3,567 -433 -11%
Extended study area 220,330 223,287 2,956 1%
Source: CLG, ONS, PBA
2.21 We have discussed with the steering group whether for Stage 3 of this study we
should use CLG 2012 as the demographic measure of housing need, replacing the
Stage 2 ONS/PBA scenario. This option would involve a partial re-run of the Stage 2
analysis as we test the detail of CLG 2012 for any anomalies. The steering group
decided against it, given that, according to the PPG, projections are not rendered out
of date every time a new version is released; moreover in this case the two versions
produce very similar results, and CLG 2012 will be replaced next year by a new, more
robust CLG projection.
August 2015 7Strategic Housing Needs Study
Stage 3 Report
2.22 The purpose of the present study is to provide a strategic evidence base that is
consistent across the HMA, so that the local authorities in the area can work together
effectively. In progressing their development plans, the authorities will wish to refer to
this evidence and also to CLG 2012 which, as advised by the PPG, is the most up-to-
date official projection available. This should not cause any difficulties, because the
two projections are so close.
2.23 As a final comment on housing need, it is important to bear in mind that our
assessment is based mostly on demographic projections, together with consideration
of future jobs (which is discussed in Chapter 7 below). This study has not considered
past provision and market signals or affordable housing needs. In line with the PPG,
plan-makers should analyse these factors separately to see if they justify making
upwards adjustments to the demographic projections. We have provided this analysis
for Birmingham City, in evidence to the examination of the Birmingham Development
Plan, and concluded that no adjustment was required4. But for the other authorities
covered by the study, the analysis and any resulting uplifts is left to local evidence
base studies. Therefore the needs we have assessed are minimum figures, which
might increase in the light of such local evidence.
Relationship to local assessments of housing need
2.24 As noted earlier, one reason this study was originally commissioned was to provide
an assessment of housing need which was consistent across the HMA, at least
before any adjustments made in the light of local circumstances. But alongside this
strategic work many of the Councils have commissioned their own evidence and this
is being used to progress development plans or support adopted plans.
2.25 In this work we are not able to take account of these local assessments alongside our
own calculations. Nor are we able to compare the local assessments with the latest
CLG household projections. The main reason is that local assessments, unlike our
projections and the CLG 2012 household projection, have not been prepared in a
consistent manner across the HMA. They start from different base data, use different
methods for demographic projections and take different approaches to adjustments
for market signals and other factors, depending on local circumstances. Therefore we
cannot add up the various Councils’ preferred demographic and housing need
assessments to present a HMA-wide view,
2.26 Any discrepancy between our numbers and local alternatives does not necessarily
suggest that local assessments are obsolete or wrong. In planning for their areas,
Councils will consider a range of evidence which includes both this study and local
assessments. It is for the Councils to determine what weight they give to these
different sources of evidence.
2.27 Our suggestion is that the total housing need shown in this report be used as a
minimum estimate of the HMA’s total housing need. If this need is met in full across
4
Peter Brett Associates for Birmingham City Council, Objectively Assessed Housing Need: Supplementary
Report, March 2015 (Examination in Public of the Birmingham Development Plan, Exam 145)
August 2015 8Strategic Housing Needs Study
Stage 3 Report
the HMA, the area will provide sufficient new homes for all the households expected
to live in the area.
2.28 When undertaking local assessments, Councils should specify whether any local
increase in projected need (through market signal adjustments or to provide more
labour for job growth) makes a contribution to the missing homes in the HMA or
alternatively requires additional migration to be attracted into the HMA.
Land supply
2.29 In this section we update the comparison of future housing need with supply capacity
that was provided in our Stage 2 report. In this updated analysis, need is taken from
the ONS/PBA projection prepared in Stage 2 and discussed in the last section.
Supply capacity is also based on Stage 2, specifically on the deliverable and
developable totals estimated at that time5. For Stage 3 we asked the client authorities
to review these supply totals and update them if necessary.
2.30 2.28 Most authorities confirmed that the supply data they provided for Stage 2 were
still valid. In the case of Birmingham, these data have been endorsed by the
Birmingham Development Plan (BDP) Inspector, as part of a schedule of proposed
Main Modifications which he considers, on the basis of the evidence available to date,
are required to make the plan sound6. Policy PG1 of the BDP, as proposed to be
modified, confirms that Birmingham has an OAN of 89,000 homes, of which only
51,100 can be provided within the city’s boundary, leaving a shortfall of 37,900 to be
accommodated elsewhere in the HMA. These numbers are taken from our Stage 2
report. The Main Modifications are still subject to consultation, But for the time being
the Inspector’s support gives that number additional weight compared to our supply
figure for other authorities, since none of the other emerging local plans in the HMA
are as advanced as Birmingham (many are dependent on Birmingham’s
shortfall).One area where the Stage 2 supply figures have been updated is the Black
Country. The Joint Core Strategy for the area ends relatively early, in 2026, and a
review of it has not yet started. Therefore for the Black Country, unlike the rest of the
study area, there are no readily available data on supply capacity for the last five
years of our study period, 2026-31. The Black Country authorities, working together,
have produced estimates of this supply that we use in this report, superseding the
figures in our Stage 2 report (nearly all this post-2026 supply is in windfall sites, and
so cannot be identified on maps).
2.31 A further update to the supply figures relates to the three authorities that are part of
the HMA but are not clients for the present study: South Staffordshire, North
Warwickshire and Stratford-on-Avon. As they are not members of our client group,
these Councils were not asked to provide supply data at Stage 2 of the study. In
Stage 3, therefore, we need to make assumptions on their supply capacities.
5
These capacity estimates were based on SHLAAs and additional information provided by the steering group, as
explained in the Stage 2 report. They are not the same as plan targets, because some authorities found capacity
over and above what their assessed need, while other did not find enough to meet that need.
6
Birmingham City Proposed Modifications
August 2015 9Strategic Housing Needs Study
Stage 3 Report
2.32 For South Staffordshire and North Warwickshire, we use targets from adopted local
plans. We considered using their published SHLAA data but decided that this could
result in very misleading analysis.
2.33 For South Staffordshire, this is because the SHLAA (2014) identifies very little
‘deliverable’ or ‘developable’ land, but a very large ‘not currently developable’ land
supply of almost 20,000 dwellings- far above the Council’s plan target of 175 dpa,
which remains current. The SHLAA does not provide detail on these potential sites
but advises that further work will investigate them more closely. Ahead of such
investigation, if we were to count the ‘not currently developable’ supply as part of
South Staffordshire’s capacity we might heavily over-estimate that capacity. However
it should be borne in mind as a possible source of long-term supply.
2.34 In North Warwickshire, the SHLAA (2013) found a deliverable and developable
housing supply slightly above the housing target which was proposed at the time. But
the SHLAA pre-dates the examination of the Core Strategy and has not yet been
updated. Therefore we cannot be confident that the SHLAA reflects the land supply
available today and we prefer to use the Council’s housing target including the 500
new homes being provided to meet Tamworth’s housing need.
2.35 For Stratford-on-Avon the picture is less clear because the plan is currently being
examined. The plan submitted for examination proposed a provision target of 540
dpa. Against our HMA-consistent needs assessment of 443 dpa, this resulted in a
small surplus of 97 dpa that might help offset supply shortfalls elsewhere in the
Greater Birmingham HMA. But the Inspector advised that the submitted plan provided
too few new homes and consequently the Council has revisited its need and now
considers it is 724 dpa; we assume additional land supply is being identified to match
this new figure.
2.36 For the purpose of this study, however, we have used Stratford-on-Avon’s original
figure of 540 dpa. This is partly because the new proposed target of 724 dpa is not
yet confirmed and we have not had the opportunity to consider it in detail. It is also
because we cannot count on Stratford-on-Avon’s additional supply to accommodate
cross-boundary unmet need from Greater Birmingham. Assuming that the Inspector
agrees with Stratford’s new target and the Council identifies enough land to meet it, if
we amended our calculation accordingly Stratford’s surplus would increase
dramatically to 281 dpa7. But this may greatly overestimate the cross-boundary need
that Stratford-on-Avon will import from the Greater Birmingham HMA, much of the
additional migration might come from other areas (as discussed earlier, Stratford-on-
Avon is related to more than one HMA). Therefore we have taken a cautious
approach and assumed that Stratford-on-Avon’s supply capacity stays at 540 dpa.
2.37 Table 2.2 compares projected need with estimated supply capacity. This time need is
expressed as net new dwellings per annum (dpa), as is supply and the difference
7
At the time of writing the Council was consulting on a modification which increases the supply to match their
OAN.
August 2015 10Strategic Housing Needs Study
Stage 3 Report
between the two (surplus or shortfall). In the last column we also show this surplus or
shortfall for the 20-year plan period.
Table 2.2 Housing need and supply, 2011-31
Per annum 20 Years
Net new dwellings p.a. Projected need Supply Surplus Surplus
(ONS / PBA 2012) (deficit) (deficit)
Birmingham 4,450 2,529 -1,921 -38,424
Bromsgrove 297 245 -52 -1,047
Cannock Chase 299 210 -89 -1,785
Lichfield 334 459 124 2,489
Redditch 179 314 134 2,685
Solihull 608 475 -133 -2,654
Tamworth 210 235 24 488
North Warwickshire 157 203 46 911
Stratford on Avon 443 540 97 1,932
Birmingham sub-market 6,979 5,209 -1,770 -35,405
Dudley 634 821 186 3,725
Sandwell 1,298 1,041 -257 -5,148
Walsall 721 548 -173 -3,457
Wolverhampton 514 683 169 3,374
South Staffs 208 175 -33 -661
Black County sub-market 3,375 3,267 -108 -2,167
Total HMA 10,355 8,476 -1,879 -37,572
East Staffs 462 932 470 9,405
Wyre Forest 200 192 -8 -168
Extended study area 11,017 9,600 -1,417 -28,335
Source: ONS, PBA, local authorities.
2.38 Numbers for individual districts should be treated with caution. This is partly because
some supply data are complicated by cross-boundary arrangements. So for example
some of Redditch’s supply will be provided in the adjoining district of Bromsgrove.
August 2015 11Strategic Housing Needs Study
Stage 3 Report
The picture for Tamworth is especially fluid given the cross boundary relationship with
both Lichfield and North Warwickshire. n North Warwickshire the Council is providing
175 dpa to meet the district’s own needs plus 500 new homes over the plan period to
meet Tamworth’s needs. Across the HMA, different Councils and plans take different
approaches when accounting for this cross-boundary need so the data is best used
as it relates to the HMA as a whole. Also as noted above in some districts (Stratford-
on-Avon) the supply figure is not yet confirmed.
2.39 Another reason why the district level data should be treated with caution is that
demographic projections are very unstable at the local authority district level but
much more robust for larger areas. In our Stage 2 report we showed a 10-year and
five-year projection for the HMA8. Across the HMA the results differed by less than
10%; for individual authorities the differences were much greater, often around 20%.
2.40 Regardless of these local complications, the main message is clear. Our best
estimate for the HMA is that as a whole supply falls short of need by 1,879 dpa, equal
to 37,572 dwellings over the plan period. This is much above the shortfall of 27,000
dwellings that we estimated in Stage 2 for the client authorities, based on the same
demographic scenario.
2.41 The main reason for the increased shortfall is the new geography being used in Stage
3. The Stage 2 calculation was for the sum total of the client authorities (‘the study
area’) and therefore included East Staffordshire, which has a substantial surplus of
supply over need, as shown in the lower section of Stage 2. But for Stage 3 we are
focusing on the Greater Birmingham HMA, which excludes East Staffordshire and
therefore does not benefit from that district’s surplus.
2.42 Of the HMA-wide deficit of 1,879 dpa, almost all is accounted for by the Birmingham
and Solihull areas. The data show:
A very large deficit for Birmingham (1,921 dpa or 38,424 over 20 years)
A much smaller deficit for Solihull (133 dpa or 2,654 over 20 years)
2.43 For the Black Country sub-market there is a total shortfall of 108 dpa, more than
accounted for by Sandwell and Walsall, with a combined shortfall of 430 dpa.
Wolverhampton and Dudley have a combined surplus of 355 dpa and South
Staffordshire is almost in balance. Overall the sub-market is short of 2,167 new
homes over 20 years.
2.44 It is important to bear in mind that the demand-supply balances at Table 2.2 are best-
case estimates, because as noted earlier the needs we have assessed are
minimums, which might be increased in the light of local evidence (including market
signals and local economic policy objectives). Also the supply estimates can only be
estimate, based on the best information available today.
2.45 Another important caveat is that figures for individual local authorities should not be
taken literally, because much of the demand for housing is footloose within the HMA,
and especially between places which are close and similar (this is one reason why
8
PBA trends 01-11 & PBA trends 07-12.
August 2015 12Strategic Housing Needs Study
Stage 3 Report
demographic projections for individual districts are so unstable). Thus, the main
points from Table 2.2 are:
Based on past trends9, the HMA as a whole has a minimum shortfall of some
1,900 dpa or 37,600 over 20 years;
Of these ‘missing dwellings’, most should be within easy reach of Birmingham and
to a lesser extent Solihull. This is where the largest imbalances between need
and supply are found.
The remainder of around 108 ‘missing dwellings’ (2,200 over 20 years) should be
within easy reach of Sandwell and Walsall.
2.46 In the remainder of this report we consider alternative strategies for the location of
these missing dwellings. The analysis is largely based on information provided by
members of the steering group, whose contributions are gratefully acknowledged.
9
PBA Trends Scenario and assuming Stratford-on-Avon makes a small (97 dpa) positive addition to the HMA
balance,
August 2015 13Strategic Housing Needs Study
Stage 3 Report
3 SCENARIOS OVERVIEW
3.1 In the following six chapters we test six options, or scenarios, for accommodating the
housing shortfall. As noted in the Introduction these comprise:
Scenario 1: Intensification;
Scenario 2: Peripheral Urban Extensions
Scenario 3: Public Transport Corridors
Scenario 4: Enterprise
Scenario 5: Dispersed Growth
Scenario 6: New Towns / Settlements.
3.2 We have worked with the study steering group to specify and assess each option
under four headings
Quantity – how many dwellings could the option deliver and how would they be
distributed across local authority areas?
Feasibility – what constraints apply to the option? What are the prospects that it
will be delivered successfully?
Timing – how soon could housing be delivered?
Main advantages and drawbacks.
3.3 The answers to these questions are in a brief summary at the end of each chapter,
illustrated by a ‘traffic light’ diagram. In the tables we use slightly darker colouring for
the grouped sub areas from the individual districts. This is only to aid clarity. But the
logic with any traffic light diagram is that green is positive (e.g. for timing = quickly),
red is negative (e.g. slow or not at all). Amber (or light red depending on printer
settings) falls somewhere in between. In some of the diagrams the colour attributed
to a Council area reflects their lack of land to promote this option. For example in the
new settlement diagram Cannock Chase District has no land to accommodate a new
settlement within its boundaries so is shown as red.
3.4 The options analysis deals only with potential development over and above policies
and allocations in adopted and emerging plans, and focuses on sites that can provide
500 dwellings or more. It does not include sustainability appraisal, which will be
provided in a separate study to be commissioned shortly. The diagram is only
intended to signpost potential opportunities which should be investigated further. The
colours shown for each authority are intended as broadly indicative, not definitive
indications of what the authority can deliver.
3.5 In this report we try to highlight as many local supply constraints and concerns as
possible. This is exceptionally difficult to moderate, because opinions differ between
Councils over the weight which should be attributed to their constraints compared to
those of neighbours. So for example we cannot determine whether one district’s
highway constraints are more severe than another’s or whether a local constraint
identified by one district also applies more widely. Even on technical issues such as
August 2015 14Strategic Housing Needs Study
Stage 3 Report
minerals there are no datasets to inform consistent assessment of constraints across
the HMA, given that the area spans three different counties as well as the former
metropolitan boroughs. To resolve these difficulties would need an evidence base
that measures and weighs local constraints on a consistent basis regardless of local
authority boundaries.
3.6 For the purpose of this report we have defined two categories of constraint:
Absolute constraints are those unlikely to be overcome either by infrastructure
provision or changes in planning policy. The list among other things includes
Areas of Outstanding Natural Beauty (AONBs), Sites of Special Scientific Interest
(SSSIs), historic parks and gardens, areas at high risk of flooding and land
protected for the development of the High Speed 2 (HS2) rail line.
Policy constraints relate to policies which may change in future, for example if
harm to the environment or conservation is overridden by the benefits of
development or can be mitigated.
3.7 Some of the policy constraints established in earlier plans may carry little or no weight
under current legislation or national policy. For example, paragraph 49 of the NPPF
advises that ‘relevant policies for the supply of housing should not be considered up
to date if the local planning authority cannot demonstrate a five-year housing supply
of deliverable housing sites’. While the legal arguments are complex, it has been
argued that such policies include settlement boundaries that were drawn to
accommodate given housing targets. If that is the case, and the evidence shows that
objectively assessed need is greater than these targets, the settlement boundaries
defined on the basis of those targets may be an out-of-date policy, which no longer
carries weight.
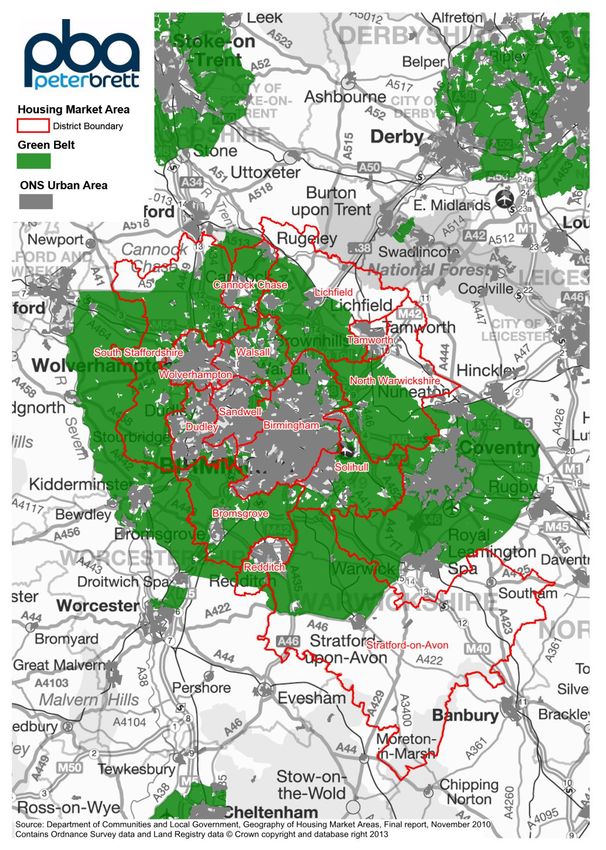
3.8 For this study a particular challenge is the Green Belt (Figure 3.1).
August 2015 15Strategic Housing Needs Study
Stage 3 Report
Figure 3.1 The Green Belt
3.9 Within the HMA itself (which excludes Wyre Forest and East Staffordshire) only the
very northern parts of South Staffordshire, Lichfield and North Warwickshire are free
of the Green Belt constraint. Southern Stratford-on-Avon is also outside the Green
Belt, but as discussed earlier this part of the district is not well related to the
Birmingham HMA.
August 2015 16Strategic Housing Needs Study
Stage 3 Report
3.10 In this study we treat the Green Belt as a policy constraint, rather than an absolute
constraint, for two main reasons. Firstly, the Green Belt may be reviewed in
‘exceptional circumstances’. It is for local planning authorities to determine whether
the strategic housing shortfall is such an exceptional circumstance and if so how this
can be applied throughout the study area. But in the GBSLEP area this threshold has
already been passed, as local planning authorities are currently reviewing Green
Belts to deliver their development strategies and meet their own housing needs. In
the Black Country the threshold has not been crossed, but it may be in the
forthcoming review of the Joint Core Strategy for the area, which will begin in 2016.
3.11 The second reason why we treat the Green Belt as a policy constraint is pragmatic.
Other than areas already built up, as mentioned earlier the bulk of the Greater
Birmingham HMA is covered by the Green Belt. Therefore most of the options we are
assessing cannot realistically be delivered unless Green Belt land is released for
development.
August 2015 17Strategic Housing Needs Study
Stage 3 Report
4 INTENSIFICATION
Introduction
4.1 In this section we explore whether the Councils in our study area consider that there
is additional brownfield and urban development capacity, not already identified in their
current emerging plans, to accommodate additional housing. To do this we consider
potential capacity from three broad sources:
Existing urban land that is currently vacant, derelict or undeveloped
Any new supply that may emerge from future release of employment sites which
is in use today but will become available for redevelopment in future.
Additional estate regeneration.
Background
4.2 The current policy focus on brownfield land has its roots in the late 1990s and the
Urban Task Force. In 1998 the Deputy Prime Minister invited the Task Force, chaired
by Richard (now Lord) Rogers, to identify causes of urban decline and establish a
vision for cities, founded on the principles of design excellence, social wellbeing and
environmental responsibility within appropriate delivery, fiscal and legal frameworks.
4.3 The Task Force identified a large supply of potential development land in towns and
cities, which could be reused for new homes. Most of this was land which was
formerly used by industries that had declined and no longer needed their legacy land
holdings.
4.4 The Task Force made over 100 recommendations. Most relevant to our topic was a
national ‘brownfield first’ policy agenda. The primary national planning policy
document, (PPG3) was redrafted in 2000 to enshrine a policy commitment that by
2008 60% of all new homes would be developed on brownfield sites. The policy shift
was very successful and by 2005 nearly three out of four new homes were being built
on brownfield land.
4.5 The Task Force also promoted a new set of studies to identify and quantify previously
developed land. This included the National Land Use Database (NLUD) and local
studies such as urban capacity studies and employment land reviews. Although the
methods may have changed over time, the principle that authorities are required to
monitor their stock of brownfield land remains. Councils rely on these studies to steer
development to previously developed (brownfield) land in preference to greenfield
sites.
Derelict, vacant and undeveloped land
4.6 Central government used to collect data on the stock of brownfield land through the
NLUD. This was discontinued in 2013, but Councils are still required to assess their
supply locally as part of their Strategic Housing Land Availability Assessments
August 2015 18Strategic Housing Needs Study
Stage 3 Report
(SHLAAs). These documents are required to identify the full extent of the deliverable
and developable capacity of all types, and a key objective is to identify policy-
preferable sites in line with the NPPF and local policies. As well as previously
developed land this should include land in built-up areas which has not been
previously developed but is suitable for development, such playing fields or public
open spaces which are surplus to requirements. In all cases, Councils have
confirmed that the development of this land has already been prioritised in existing
plan targets.
4.7 Across our extended study area, most authorities have reasonably up-to-date
SHLAAs, which have informed the preparation of the latest round of plans. In the
conurbation, where most the urban land supply is found, evidence has quantified
known capacity up to 2031. As noted in the Introduction above, the evidence for
Birmingham appears to have been accepted by the Inspector who has proposed no
modifications to the number of dwellings to be provided within the city boundary. In
the Black Country, the adopted Core Strategy runs only until 2026 but the Councils
have updated their supply estimates to extend to 2031, as discussed earlier.
4.8 Our own review of the evidence confirms that adopted and emerging plans in the
extended study area are already maximising their supply from this source. From a
range of examination documents we can see that, where vacant or derelict brownfield
sites are not identified for development, there are genuine questions surrounding the
viability and deliverability of these sites. Therefore, if these plans were reviewed
today, it is likely that the sites concerned would still not be proposed for development.
4.9 In summary therefore we have no reason to believe that there is a significant supply
of vacant, derelict or undeveloped land in urban areas which has not already been
identified in current and emerging development plans.
Employment land
4.10 All Councils try to estimate land which is currently in non-residential uses, but may
come forward in future to be redeveloped for housing. In the past the main source of
this kind of supply has been former employment land which is no longer required.
Employment Land Reviews, part of the planning evidence base, estimate how much
of the existing employment land stock will be needed in the future, and hence how
much will be available to be recycled for other uses including housing. In our
extended study area this recycling is a key component of all Councils’ identified
housing land supply.
4.11 These employment land documents broadly follow a set method, which is adjusted
according to local circumstances. They are not updated as often as SHLAAs, but in
the Greater Birmingham HMA most are relatively recent:
Tamworth 2013
Redditch 2013
Stratford on Avon 2013
East Staffordshire 2013
August 2015 19Strategic Housing Needs Study
Stage 3 Report
Bromsgrove 2012
Birmingham City 2012
Lichfield 2012 & Addendum 2013
Cannock Chase 2014
North Warwickshire 2013
South Staffordshire 2012
Solihull 2011.
4.12 Surplus employment land has been identified in these studies and carried forward
into emerging local plans.
4.13 For the Black Country, since the Core Strategy was adopted, the authorities have
been updating their evidence on an ongoing basis, partly to support Site Allocation
Documents and Action Area Plans. Walsall Council, for example, updates its ELR
annually. Partly drawing on this evidence, as noted earlier the authorities have
provided new supply estimates for Stage 3 of this study, which include former
employment sites.
4.14 In Cannock Chase and Lichfield, current plans end in 2028 and 2029 respectively.
When these plans are reviewed it is possible that some new supply may be identified
for the period from 2028 or 2029 to 2031. But this is unlikely to yield a strategically
significant supply, because neither Council area has a large stock of employment
land.
4.15 Councils could of course consider releasing more employment land for housing, over
and above this allocated and estimated supply discussed above. But these would be
employment sites which, for the most part, are currently occupied, and according to
the employment land evidence will continue to be in demand over the plan period. If
these sites are redeveloped for housing, planning will be underproviding for the
expected demand and need for employment land. Consequently the shortfall of
housing land may reduce, but the result would be a shortfall (or a greater shortfall) of
employment land.
4.16 In summary, on the evidence currently available, we cannot identify a supply of
employment land likely to be available for housing over and above current plans. But
this is one area of evidence which needs to be kept under review. The amount of
land needed for future employment land purposes is especially volatile to changing
assumptions. If these change, for example if manufacturing employment (generally a
low density employment use) declines faster than assumed then more land may be
made available for new homes. But if manufacturing grows then more employment
land will be needed and less will be available for new homes.
Estate regeneration
4.17 In some areas the redevelopment of older housing estates, which were built at
relatively low densities, can yield net additional new homes. As part of this study we
asked the client steering group whether there was potential for this in their areas.
August 2015 20Strategic Housing Needs Study
Stage 3 Report
Their answer is that estate regeneration cannot deliver additional housing on a
significant scale.
4.18 The group advises that for most small sites, with only one landowner, redevelopment
and intensification of sites (or small estates) is already permitted by current plan
policies, subject to other policies that protect amenity, ensure adequate access and
prevent development that local communities would consider inappropriate. Where
there are opportunities for estate regeneration that satisfy these criteria, they are
already included in SHLAAs.
4.19 For larger estates, group members say that land ownership is generally fragmented,
which makes comprehensive redevelopment very difficult to achieve and unlikely to
be viable. Assembling sites would most likely require the use of Compulsory
Purchase Powers. This is very expensive and it is questionable whether the objective
to increase housing densities can underpin a valid legal case.
4.20 Even where estate renewal is successfully delivered, there is no guarantee that it will
deliver net new homes. Recent examples of comprehensive estate regeneration in
Birmingham City and Solihull, including the North Solihull regeneration, for example,
have yielded little or no net additional housing.
4.21 There is also evidence that in some circumstances continued regeneration may result
in a net loss of housing units. Under the last Labour Government, Birmingham and
Sandwell benefitted from one of the largest and most comprehensive estate
regeneration and renewal programmes in recent years; a Housing Market Renewal
Pathfinder. The programme covered large parts of the local authority areas of
Birmingham City and Sandwell, extending in a broad band through sections of West
Bromwich, Smethwick, Handsworth, Winson Green, Lozells, Newtown and Aston: a
total area of 3,255ha and 60,000 dwellings. But the Pathfinder in this area did not
aim to create net additional homes. Rather, it sought to reduce the number of
dwellings but increase their size, because the evidence showed that existing homes
were too small for the area’s households and often overcrowded.
4.22 Estate renewal can greatly improve the quality of housing and hence the quality of
life, making the conurbation a more attractive place to live and helping reverse urban
decline. What it is unlikely to do, at least in our study area, is to help meet the
quantitative housing shortfall.
Higher urban densities
4.23 Most of the study area's housing need is already provided for in adopted and
emerging development plans. If the development sites identified could be delivered
at higher densities than previously expected, this could reduce or eliminate the
housing shortfall.
4.24 In relation to this option we asked the steering group to consider two scenarios for
increasing housing densities in their district. Although this section primarily deals with
brownfield land, we also asked where it was realistic or feasible to increase densities
on all allocated, or proposed, development sites, whether greenfield or brownfield. In
August 2015 21You can also read