2021-2024 LOCAL WORKFORCE DEVELOPMENT PLAN - VERDUGO WORKFORCE DEVELOPMENT BOARD - Verdugo ...
←
→
Page content transcription
If your browser does not render page correctly, please read the page content below
VERDUGO
 WORKFORCE
DEVELOPMENT
   BOARD

 LOCAL WORKFORCE DEVELOPMENT PLAN
            2021-2024

                CONTACT
             Judith Velasco
           Executive Director
 Verdugo Workforce Development Board
     Email: jvelasco@glendaleca.gov
        Phone: (818) 937-8031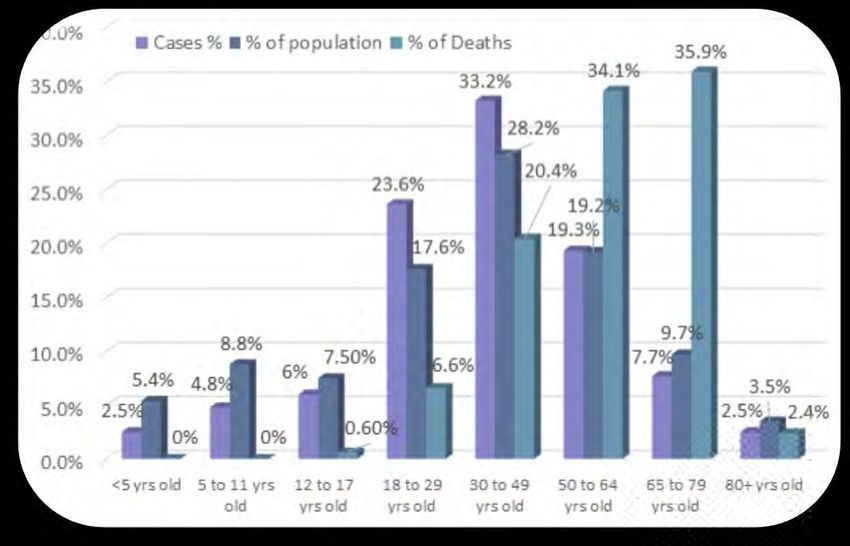
Verdugo Workforce Development Board Local Plan 2021-2024
TABLE OF CONTENTS
I. GLOSSARY OF ACRONYMS ............................................................................................ 4
II. THE VERDUGO WORKFORCE DEVELOPMENT BOARD ...................................................... 8
A. The Verdugo Community .................................................................................... 8
B. The COVID-19 Pandemic.................................................................................. 11
C. The Verdugo Business Community ................................................................... 14
D. The Impact of the Pandemic on the Business Community ................................ 17
E. The Verdugo Workforce and Impact of the Pandemic ....................................... 20
III. ALIGNMENT TO REGIONAL PLAN ................................................................................. 25
A. Local & Regional Plan Alignment ...................................................................... 25
B. Regional Plan Engagement............................................................................... 27
IV. WIOA CORE AND REQUIRED PARTNER COORDINATION ................................................ 28
A. Coordination with WIOA Core and Mandated Partners ..................................... 28
B. Coordination of Services and Resources Identified in MOU ............................. 29
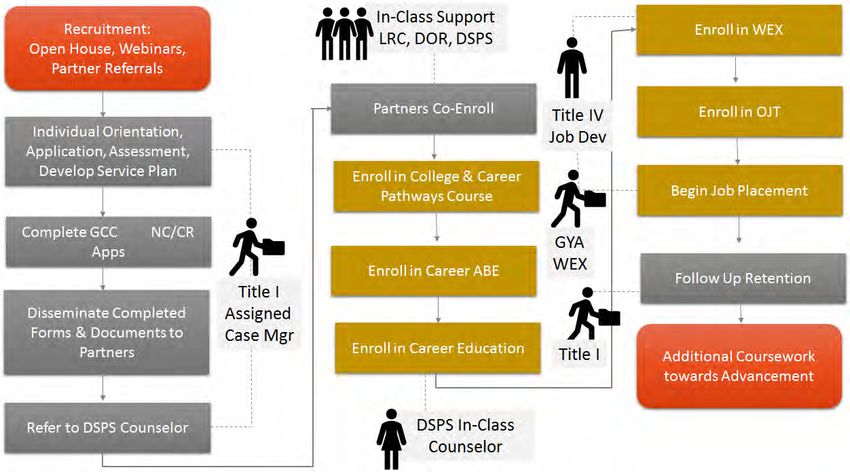
C. Co-Enrollment and Common Case Management .............................................. 30
D. Facilitate Access to Services through Technological Means ............................. 34
E. Coordination of Workforce & Education Activities with Supportive Services ..... 34
F. Compliance with WIOA Section 188 and Americans with Disabilities Act ......... 35
V. STATE STRATEGIC PARTNER COORDINATION ............................................................... 35
A. Coordination with County Health, Human Services Agencies & CalFresh ........ 35
B. Coordination with Local Child Support Agencies and Others for Non-Custodial
Parents .............................................................................................................. 39
C. Coordination with Local Partnership Agreement Partners for Competitive
Integrated Employment ..................................................................................... 43
D. Coordination with Partners to Serve English Language Learners ..................... 47
VI. WIOA TITLE I COORDINATION ..................................................................................... 49
A. Professional Development in Digital Fluency .................................................... 49
B. Professional Development in Cultural Competencies ....................................... 50
C. Coordinate Workforce Activities with Rapid Response Activities ...................... 51
D. Adult and Dislocated Worker Activities and Targeted Populations .................... 52
E. Youth Workforce Investment Activities .............................................................. 56
F. Entity Responsible for the Disbursal of Funds................................................... 58
G. Selection of AJCC One-Stop Operator and Career Services Provider .............. 59
VII. STAKEHOLDER AND COMMUNITY ENGAGEMENT .......................................................... 60
Page 2 of 68
Verdugo Workforce Development Board                                                                   Local Plan 2021-2024

      A.     Public Meeting and Comment ........................................................................ 60
APPENDICES ................................................................................................................... 62
APPENDIX 1: STAKEHOLDER AND COMMUNITY ENGAGEMENT SUMMARY............................ 63
APPENDIX 2: PUBLIC COMMENTS .................................................................................... 66
APPENDIX 3: SIGNATURE PAGE ...................................................................................... 67

                                                        Page 3 of 68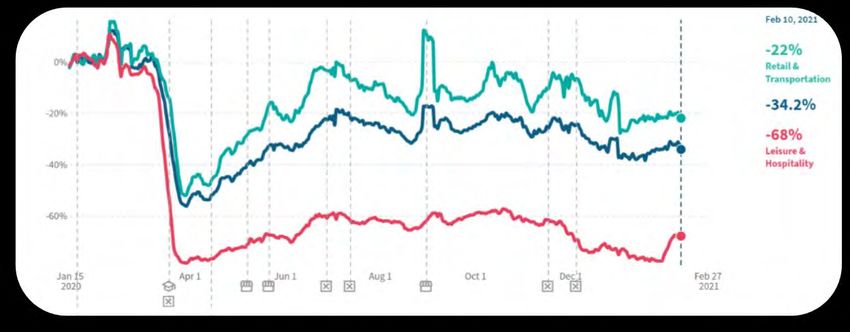
Verdugo Workforce Development Board                                  Local Plan 2021-2024

I. GLOSSARY OF ACRONYMS

 ABE           Adult Basic Education
 AD            Adults
 ADA           American's with Disability Act
 AEFLA         Adult Education Family and Literacy Act
 AJCC          America's Job Center of California
 AMA           American Medical Assistant
 ARS           Automated Referral System
 ASD           Autism Spectrum Disorder
 ASE           Adult Secondary Education
 ASL           American Sign Language
 AWARE         Accessible Web-Based Activity Reporting Environment
 BLS           Bureau of Labor Statistics
 BST           Business Services Team
 BTAC          Burbank Temporary Aid Center
 BUSD          Burbank Unified School District
 BWC           Burbank Workforce Connection
 C2PAD         Career and College Pathways for Adults with Disabilities
 CA            California
 CAEP          California Adult Education Program
 CalWORKS      California Work Opportunity and Responsibility to Kids
 CBIG          California Business Incentives Gateway
 CBO           Community Based Organization
 CCCMS         Correctional Clinical Case Management System
 CCD           Customer-Centered Design
 CDC           Center for Disease Control
 CDCR          California Department of Corrections and Rehabilitation
 CDE           California Department of Education
 CEO           Chief Elected Official/Officer
 CES           Community Enhancement Services
 CFR           Code of Federal Regulations
 CIE           Competitive Integrated Employment
 CLEO          Chief Local Elected Official
 CMTC          California Manufacturing Technology Consulting
 CNC           Computer Numerical Control
 CoC           Continuum of Care
 COE           Centers of Excellence
 CQI           Continuous Quality Improvement
 CQIA          Certified Quality Inspector Associate
 CRM           Customer Relationship Management
 CSULA         California State University, Los Angeles
 CSUN          California State University, Northridge
 CTE           Continuing Technical Education

                                         Page 4 of 68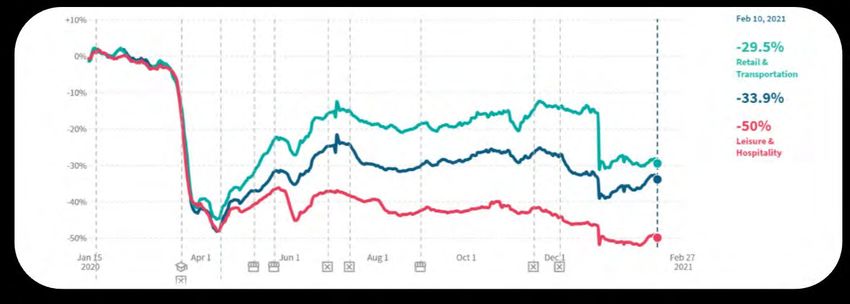
Verdugo Workforce Development Board                                 Local Plan 2021-2024

 CUIC          California Unemployment Insurance Code
 CWA           California Workforce Association
 CWDB          California Workforce Development Board
 DEA           Disability Employment Accelerator
 DCSS          Department of Child Support Services
 DOL           Department of Labor
 DOR           Department of Rehabilitation
 DPSS          Department of Public Social Services
 DSPS          Disabled Students Program and Services
 DW            Dislocated Workers
 E&T           Employment and Training
 Ed            Education
 EDD           State of California Employment Development Department
 EFL           Educational Function Levels
 EIP           Employment Incentive Program
 ELL           English Language Learners
 EMR           Electronic Medical Records
 EO            Equal Opportunity
 ESL           English as a Second Language
 ETP           Employment Training Panel
 ETPL          Eligible Training Provider List
 FG            Focus Groups
 GCC           Glendale Community College
 GEF           Glendale Educational Foundation
 GREAT         Glendale’s Resource for Employment and Training
 GRIT          Glendale Relationship Initiation Team
 GUSD          Glendale Unified School District
 GYA           Glendale Youth Alliance
 GYEP          Glendale Youth Employment Partnership
 HCCP          Health Care Case Manager Career Pathway
 HPB           High Performance Board
 HR            Human Resources
 HSEE          High School Equivalency Exam
 HUD           Housing and Urban Development
 HWOL          Help Wanted Online
 ICS           Individualized Career Services
 ICT           Information and Communication Technology
 ID/DD         Intellectual Disabilities and Developmental Disabilities
 IEP           Individual Employment Plan
 ISD           Integrated Service Delivery
 ISS           Individual Service Strategy
 IT            Information Technology
 ITA           Individual Training Account
 IWD           Individuals with Disabilities
 JPA           Joint Powers Agreement

                                      Page 5 of 68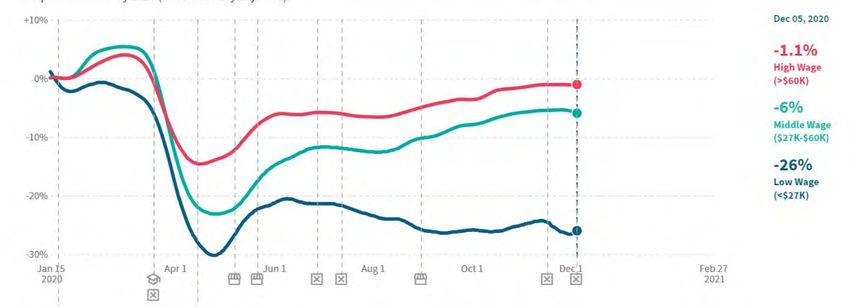
Verdugo Workforce Development Board                                      Local Plan 2021-2024

 JVS           Jewish Vocational Services
 KPI           Key Performance Indicator
 LA            Los Angeles
 LABRPU        Los Angeles Basin Regional Planning Unit
 LACOE         Los Angeles County Office of Education
 LAUSD         Los Angeles Unified School District
 LCF           La Cañada Flintridge
 LLSIL         Lower Living Standard Income Level
 LMI           Labor Market Information
 LMID          Labor Market Information Division
 LPA           Local Partnership Agreement
 LQ            Location Quotient
 LWDA          Local Workforce Development Area
 MCSE          Microsoft Certified Solutions Expert
 MEP           Manufacturing Extension Partnership
 MFT           Marriage and Family Therapists
 MOU           Memorandum of Understanding
 MSA           Metropolitan Statistical Area
 NAICS         North American Industry Classified System
 NICE          National Initiative for Cybersecurity Education
 NIST          National Institute of Standards and Technology
 OES           Occupational Employment Statistics
 OFE           Opportunity for Excellence
 OJT           On-the-Job Training
 OSO           One-Stop Operator
 OMB           Office of Management and Budget
 PJSA          Personalized Job Search Assistance
 PPP           Paycheck Protection Program
 PTSA          Parent Teacher Student Association
 PTSD          Post Traumatic Stress Disorder
 PUA           Pandemic Unemployment Assistance
 QCEW          Quarterly Census of Employment and Wages
 Q             Quarter
 REA           Re-Employment Assistance Workshops
 RFP           Request for Proposal
 RIISE         Regional Immediate Intervention Services for Employment
 RN            Registered Nurse
 ROP           Regional Occupation Program
 SBDC          Small Business Development Center
 SCIC          Southern California Indian Center
 SELPA         Special Education Local Planning Area
 STEPS         Summer Training and Employment Program for Students
 SFV           San Fernando Valley
 SGV           San Gabriel Valley
 SSA           Social Security Administration

                                       Page 6 of 68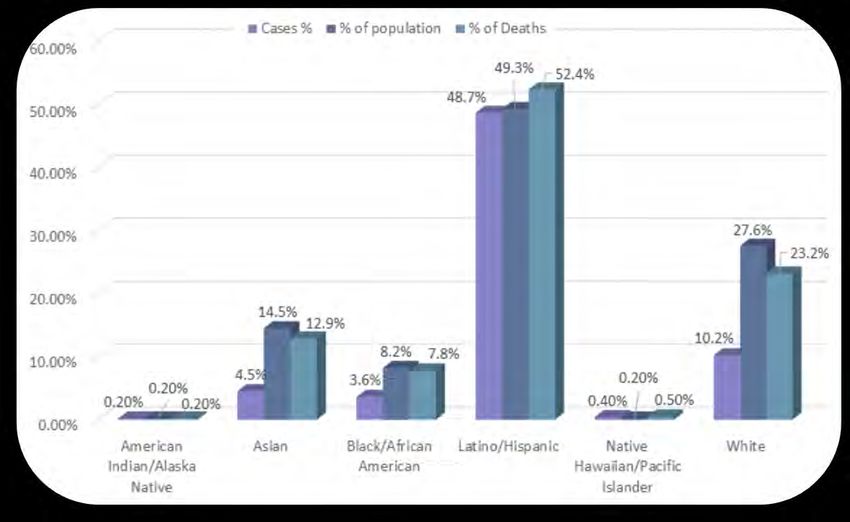
Verdugo Workforce Development Board                              Local Plan 2021-2024

 SSI           Supplemental Security Income
 SWOT          Strength, Weaknesses, Opportunities and Threats
 SWP           Strong Workforce Program
 TAA           Trade Adjustment Act
 TANF          Temporary Assistance to Needy Families
 TAP           Talent Acquisition Portal
 UI            Unemployment Insurance
 US            United States
 USA           United States of America
 UX            User Experience
 VCTC          Verdugo Creative Technologies Consortium
 VSTCC         Verdugo School to Career Coalition
 VCTP          Verdugo Creative Technologies Program
 VESL          Vocational English as a Second Language
 VIVID         Verdugo Innovation and Vision Implementation Design Team
 VJC           Verdugo Jobs Center
 VMA           Verdugo CNC Machinist Academy
 VSTCC         Verdugo School to Career Coalition
 VWDA          Verdugo Workforce Development Area
 VWDB          Verdugo Workforce Development Board
 WARN          Worker Adjustment & Retraining Notification
 WDACS         Workforce Development and Community Services
 WDB           Workforce Development Board
 WSD           Workforce Services Directive
 WEX           Work Experience
 WIOA          Workforce Innovation & Opportunity Act
 WIP           Work Incentive Plan
 WIPA          Work Incentive Planning Assistance
 WSD           Workforce Services Directive
 WSIN          Workforce Services Information Notice

                                      Page 7 of 68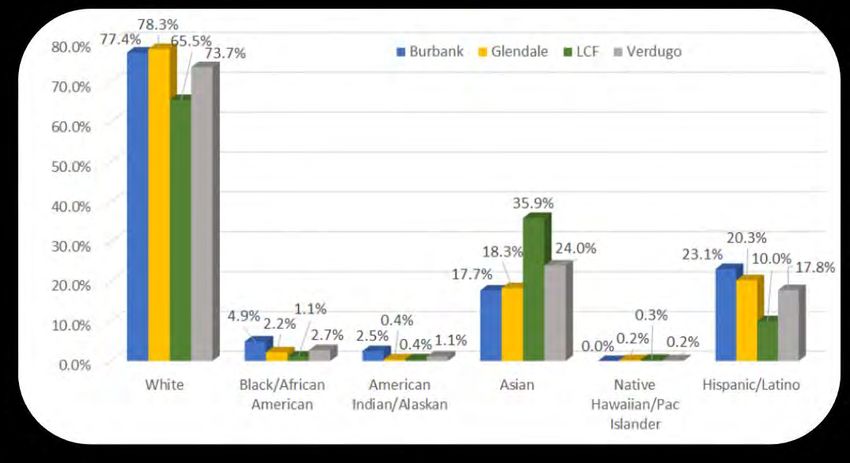
Verdugo Workforce Development Board                                                                 Local Plan 2021-2024

II.    THE VERDUGO WORKFORCE DEVELOPMENT BOARD

A. The Verdugo Community

The Verdugo Workforce Development Board (VWDB) has been providing workforce
development services to the Cities of Burbank, Glendale and La Cañada Flintridge (LCF)
for more than 30 years. It is one of the seven Workforce Development Boards that
comprise the Los Angeles Basin Regional Planning Unit (LABRPU) funded primarily by
the Workforce Innovation and Opportunity Act Title I (WIOA). With a combined population
of 324,196 residents, 1 (Figure 1) it is considered one of the smaller Local Workforce
Development Areas (LWDA) in the LABRPU, serving its residents through its America’s
Job Centers of California (AJCC), known in the community as the Verdugo Jobs Center
(VJC) and its affiliate, Burbank Workforce
Connection (BWC).                                     Figure 1: Verdugo Cities’ Populations

The three Cities that comprise the LWDA,
are governed by an executed Joint
Powers Agreement, creating the Verdugo
Consortium (Verdugo). The JPA appoints
the City of Glendale as the administrative
entity for the Consortium. The physical
boundaries of Glendale, Burbank, and
LCF make up the Verdugo Workforce
Development Area (VWDA).

While the VWDA is small, its economy is like no other region in the state with a mix of
highly specialized industry niches, including entertainment. Over the years, the VWDB
has emerged as a leader in developing innovative programs to serve businesses and
special populations. The fact that the VWDB has been awarded more than 80 competitive
grants over the past dozen years with many of them Figure 2: VWDB Vision & Mission
regional grants, is strong testimony to the role as well as
the fact that education partners in the region rely on the
VWDB to lead efforts for specific sector funding
opportunities. Most noteworthy is our success in serving
people with disabilities in growth occupations that offer
economic security and upward mobility opportunities.

The VWDB oversees the workforce development system,
including the VJC, located in the City of Glendale as well
as an affiliate site in the City of Burbank, the BWC, which
serves as an annex for enrollment into funded programs
and other AJCC services. The VWDB’s Vision and Mission
(Figure 2) are in alignment with CWDB’s Vision with both
focused on upward mobility of customers and targeting the
1
    People and Population: Burbank, Glendale, La Cañada Flintridge, 2019 American Community Survey 5 Year Estimates. US Census
    Bureau.

                                                        Page 8 of 68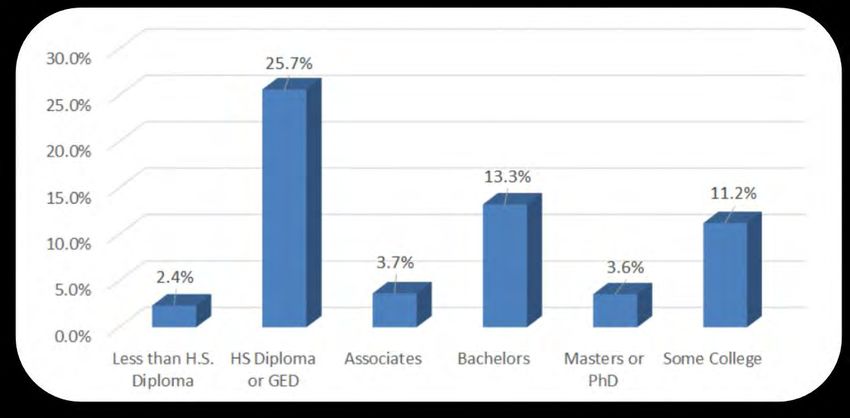
Verdugo Workforce Development Board                                                               Local Plan 2021-2024

most vulnerable to ensure economic equity. 2 The vision and mission establish the
foundation to lead the tri-city workforce development system in responding to community
needs. The VWDB’s Vision and Mission were revised following an
                                                                         Figure 3: VWDB Values
environmental scan and an analysis of its SWOT during its strategic
planning process. The Vision and Mission were introduced to the VJC
partners and other stakeholders for review and comment and the
statements were revised again based on feedback to support regional
growth and self-sufficiency. The VWDB’s Values (Figure 3) were also
developed using the same process as the Vision and Mission
Consistent with WIOA.

The VWDB’s Vision and Mission set forth              Figure 4: Median Household Income
the foundation for the Verdugo workforce
development system. The system and
service delivery are designed based on
the needs identified for the tri-city
community using demographic and
economic data and information. Verdugo
is home to 123,787 households with
median household income of $75,827
(Figure 4), a significant increase from the
median income of $62,980 recorded in
2015, reflecting the economic prosperity
in 2019.3 This economic prosperity is also
demonstrated with the decline in the Verdugo poverty rate (Figure 5) from 12.6%
representing 40,496 in 2015 to 9.3% in 2019 representing 36,911 residents.4 However,
prosperity ended with the COVID-19 pandemic which began in January 2020 with the first
diagnosed case in the United States (US), and the subsequent shutdown of the economy
by closing non-essential businesses.
                                                         Figure 5: Poverty Rate
The impact of the pandemic is
expected to be reflected in 2020 data
scheduled to be released in October
2021 by the US Census Bureau.

In addition to the poverty rates,
educational attainment and other
demographics provide insights to the
community served. The median age for
Verdugo residents is 42 years5 and the

2
    California’s Unified Strategic Workforce Development Plan, for Program Years 2020-2023. California Workforce Development
    Board.
3   Income and Poverty: Burbank, Glendale, La Cañada Flintridge, 2019 American Community Survey 5 Year Estimates. US Census
    Bureau.
4   Selected Economic Characteristics: Burbank, Glendale, La Cañada Flintridge, 2019 American Community Survey 5-Year
    Estimates. US Census Bureau.
5   Selected Social Characteristices: Burbank, Glendale, La Cañada Flintridge, 2019 American Community Survey 5-Year
    Estimates. US Census Bureau

                                                       Page 9 of 68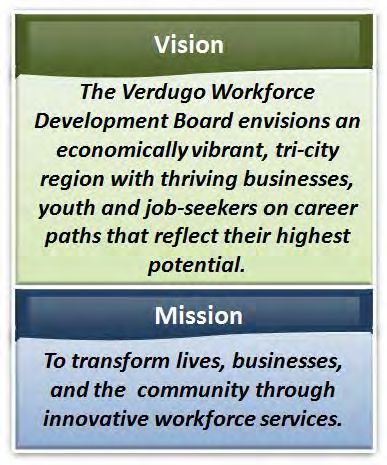
Verdugo Workforce Development Board                                                               Local Plan 2021-2024

average educational Attainment (high school diploma) rate for the VWDA is 92.5% with
all three cities surpassing the national average. While the educational attainment is high,
21% of residents age 25 years and over do            Figure 6: Verdugo Residents with No Diploma
not have a high school diploma,
representing 23,947 residents (Figure 6).
Further, a total of 12,848 of these residents
have less than a 9th grade education level.6
These demographics also provide insight
into the potential need for adult basic
education (ABE) and Adult Secondary
Education (ASE) to assist with addressing
the literacy gap and absence of diploma or
equivalent.

Another target population in addition to low          Figure 7: Verdugo Residents that are Veterans
income, are veterans, individuals with
disabilities and English Language Learners
(ELL). Veterans comprise 5.4% of the
Verdugo community that are at least 18
years of age, representing 7,687 residents7
(Figure 7). Individuals with disabilities,
comprise 10.5% of the Verdugo community,
representing 34,020 residents and 12,441 of
these residents have cognitive disabilities.
Cognitive disabilities include individuals with
intellectual disabilities and developmental
disabilities (Figure 8), both which are target for the design and development of career
pathways for the most vulnerable populations. In determining the number of ELL that
reside in the Verdugo tri-city community, the VWDB begins with examining the number of
residents that speak a language other than English at home (Figure 9). Almost 49% of
        Figure 8: Verdugo Residents with Disabilities                     Figure 9: Speak a Language Other than English

6   Educational Attainment: Burbank, Glendale, La Cañada Flintridge, 2019 American Community Survey 5 Year Estimates. US
    Census Bureau.
7   Veteran Status: Burbank, Glendale, La Cañada Flintridge, 2019 American Community Survey 5 Year Estimates. US Census
    Bureau.

                                                      Page 10 of 68
Verdugo Workforce Development Board Local Plan 2021-2024
Verdugo residents (above the age of five years) speak a language other than English at
home with Glendale recording a rate of 67.5%, significantly higher than Los Angeles (LA)
County of 56.8%, demonstrating the diversity of the VWDA.8 Although the Race/Ethnicity
data for the Verdugo cities shows that 73.7% of residents identify themselves as
White/Caucasian (Figure 10), this percentage includes the large immigrant, asylee, and
refugee population from middle eastern countries that reside in the community. The
community also includes 24% of residents who identify as Asian and 17.8% of residents
who identify as Hispanic/Latino.
Figure 10: Verdugo Race/Ethnicity
B. The COVID-19 Pandemic
No event has changed the local economy and the lives of the Verdugo residents as much
as the COVID-19 pandemic. The first case of COVID-19 case was identified in the United
States in January 2020, and by March 19, 2020, the Governor of California issued an
Executive Order for residents to remain at home and all non-essential services and
businesses closed. This Order was followed with a Safer at Home Order from the LA
County Health Officer, issued on March 19, 2020. Orders continued to be extended in
alignment with California’s Four Tier Reopening Plan. The Governor has lifted the
shutdown orders for some businesses such as restaurants; however, many restrictions
remain due to continued widespread infection of COVID-19 and many non-essential
indoor business operations remain closed.
The LA County is the most populous county in California with a population of 10,081,570
residents9. Daily reported new COVID-19 cases in LA County have increased due to the
spike identified in late November, bringing 92.3 new cases per 100K or 9,270 new cases
8
Selected Social Characteristics: Burbank, Glendale, La Cañada Flintridge 2019 American Community Survey 5 Year Estimates.
US Census Bureau.
9
Los Angeles County Profile 2019 American Consumer Survey 5-Year Estimates. US Census Bureau, https://data.census.gov
Page 11 of 68Verdugo Workforce Development Board Local Plan 2021-2024
as of January 22, 2021. These numbers have declined to 18.8 new cases per 100,000
representing 1,886 new daily reported cases, and 2.26 new daily reported deaths per
100,000, representing 227 deaths as recorded on February 25, 2020.10 The total number
of cases recorded for LA County is 1,190,894 and the total number of deaths is 21,328
as of February 26, 2021.11
Examining the results of the pandemic on demographic segments assists in determining
the impact of COVID-19 on vulnerable populations. COVID-19 cases and deaths (Figure
11) indicate a correlation with age. Cases increase significantly until 49 years of age and
then decline significantly from 50 years of age and older. The labor force ages of 18-64
comprise 76.8% of all diagnosed cases even though they are 65% of the population.
However, even though the cases decline at 50 years of age, the number of deaths
increase for these age groups. The age group of 30 years of age or older, comprise 93%
of the deaths, even though they only comprise 61% of the population. The most
significant impact is to residents that are 65 to 79 years of age which comprise only 7.7%
of the cases, yet almost 36% of the deaths. The VWDB also focuses on the labor force
ages of 18 to 64 which comprise 61% of the deaths. These results demonstrate how
important following health and safety guidelines is for Verdugo’s workforce.
Figure 11: LA County COVID-19 Cases and Deaths by Age
Further demonstrating the impact to vulnerable populations, residents in identified areas
of poverty indicate that those whose income is closer to the poverty line, have increased
numbers of cases and deaths. Residents living at within 20% of the poverty line comprise
10 Daily Reported COVID-19 Cases, Deaths and Tests per 100,000 People: Los Angeles County. Economic Tracker, February 25,
2021.
11 Los Angeles County COVID-19 Dashboard: Gender, Age Range. County of Los Angeles Public Health COVID-19 Homepage,
February 26, 2021.
Page 12 of 68Verdugo Workforce Development Board Local Plan 2021-2024
almost 53% of cases and 57% of Figure 12: LA County COVID-19 Cases and
deaths (Figure 12). These results may Deaths by Area of Poverty
indicate that those residents living in
poverty may not have access to
healthcare and/or affordable care.
These results also support the VWDB’s
focus on creating career pathways that
provide the skills training in higher
paying occupations to create the
economic equity needed to break the
cycles of poverty. Closely related to
residents living in Areas of Poverty, are
the Race and Ethnicity segment results
(Figure 13). Data show that in LA
County, the Hispanic/Latino population comprise the largest segment of the population at
49.3%, and also comprise the 48.7% of cases and 52.4% of deaths, demonstrating the
vulnerability of this population. The Asian population, also a significant population in the
Verdugo community, comprises only 4.5% of the cases; however, this segment
represents almost 13% of the deaths. Similarly, the White/Caucasian population records
only 10.2% of the cases; however, 23% of the deaths, demonstrating the mortality rate is
more than double the case rate. 12 Understanding the impact of COVID-19 to the
community by demographic segments, assists in understanding the impact to the
Verdugo communities and the residents that the VJC serves.
Figure 13: LA County COVID-19 Cases and Deaths by Race and Ethnicity
12
Los Angeles County COVID-19 Dashboard: Areas of Poverty, Race/Ethnicity. County of Los Angeles Public Health COVID-19
Homepage, February 26, 2021.
Page 13 of 68Verdugo Workforce Development Board Local Plan 2021-2024
Locally, the Verdugo community recorded a total of 27,503 of lab-confirmed COVID-19
cases (Figure 14) and 780 deaths (Figure 15).13
Figure 14: Verdugo COVID-19 Cases Figure 15: Verdugo COVID-19 Deaths
Vaccinations began in December and as of Figure 16: Verdugo Residents Vaccinated
February 26, 2021, a total of 48,563
residents were vaccinated comprising
20.4%14 of the Verdugo population (Figure
16). Continued vaccination of residents,
may assist in reducing the future cases and
deaths, allowing for additional non-
essential businesses to resume operations
and improved economic landscape. Until
the Verdugo community is able to control
the spread of the virus, the Verdugo
workforce and business community will
continue to be affected.
C. The Verdugo Business
Community Figure 17: Verdugo Businesses
Recovering from the 2008 Great
Recession, several industry
sectors led the improvement in
the economic environment.
These industry sectors consisted
of: Professional, Scientific, and
Technical Services ($10 billion)
and Retail Trade ($5.4 billion)
combined accounted for 44% of
all reported sales, shipments,
receipts, revenues and business
13 Los Angeles County COVID-19 Cases, City/Community. County of Los Angeles Public Health COVID-19 Homepage, February 26,
2021.
14 Ibid.
Page 14 of 68Verdugo Workforce Development Board Local Plan 2021-2024
done ($35.1 billion) in the VWDA in 2012.15 As of 2019, a total of 49,621 businesses
reside in the Verdugo community, with 15,699 of those being women owned
businesses,14,598 are minority owned, and a total of 3,387 are owned by veterans
(Figure 17).16
Figure 18: Top 10 Industry Sectors for Business – Verdugo Consortium
Businesses in the Verdugo Consortium by industry sector is based on the number of
businesses registered with Dun & Bradstreet that are located within the three cities.
Employers determine their industry sector by selecting the North American Industry
Classification System (NAICS) code when they register with Dun & Bradstreet.
Regardless of the pandemic and its impact on business, Health Care is the largest sector
and has added companies in 2020, an increase of 7% from 2019 (Figure 18). The
Professional Services sector which includes accounting, engineering, information
technology and management and technical consulting has the second largest number of
businesses in Verdugo and has recorded an increase of 6% since 2019. Services
includes repair and maintenance as well as personal services such as housekeeping and
laundry. Administrative and Support Services include office, employment, travel, and
15 2012 Economic Census of Island Areas, and 2012 Non-employer Statistics. US Census Bureau, 2012 Economic Census.
16
Business and Owner Characteristics: Burbank, Glendale, La Cañada Flintridge 2019 American Community Survey 5 Year
Estimates. US Census Bureau.
Page 15 of 68Verdugo Workforce Development Board Local Plan 2021-2024
security services and has seen an 11% decrease since 2019.17 These trends will likely
continue to change given the economic impact of the mass layoffs that occurred in March
2020 as a result of the Governor’s Shelter In Place order in response to the COVID-19
pandemic.
Figure 19: Verdugo Job Ads
In addition to the Top 10 Industry Sectors, the
VWDB also examines the Top Occupations for
December 2020 for alignment. Alignment
supports focusing on these industry sectors
when selecting or reaffirming the target sectors
for the VWDB. The Top 10 Occupations
(Figure 19) include those from Healthcare
(Registered Nurses), Retail (Salesperson) and
Professional and Business Services (Software
Developers) 18 which are in alignment and
support these sectors as targets for the VWDB.
Businesses across all sectors were impacted by the pandemic and the subsequent
shutdown. While the Governor’s Executive Order was specific to non-essential
businesses, even essential businesses experienced reductions. However, within these
reductions, 23 sectors and sub-sectors throughout the LA Basin sustained their resilience
during these most challenging times and continued to employ and even hire new
employees for their business operations.
Figure 20: LA County Resilient Industry Sectors & Sub-Sectors
The 23 LA County Resilient Industry Sectors & Sub-Sectors (Figure 20) show positive
percent change (year over year), above 3%, in employment as of October 2020. Using
March 2019 as a baseline, these sub-sectors show growth even though the prior eight
months were impacted by the COVID-19 pandemic and Shelter in Place order. These
data provide an indication of the sub-sectors and related jobs that were resilient during
this period of decline and show growth levels that can be targeted for workforce services
17
Industry Sectors, Verdugo Consortium. Econovue Report, December 2020, Dunn and Bradstreet.
18 Online Job Advertisement – December 2020 Help Wanted Online. Conference Board, Help Wanted Online; Employment
Development Department, Labor Marked Information Division.
Page 16 of 68Verdugo Workforce Development Board Local Plan 2021-2024
that result in employment. Retail and related sectors show positive change beginning with
Building Material & Garden Equipment Stores at 24.3%, followed by Electrical &
Electronic Goods Merchandise Wholesalers at 10.4% and Grocery Stores at 7%. Finance
and related sectors, manufacturing, healthcare, and computer services also show
resiliency with their positive change. These sectors may be leading the economic
recovery efforts and continue growth even beyond the COVID-19 pandemic, providing
opportunities for a workforce that may not be able to return to their previous employer.19
Based on the industry sector (Figure 18) and
occupations data (Figure 19), and occupational outlook Figure 21: VWDB Target Industries
of the resilient sectors (Figure 20) in the VWDA, as well
as the labor intelligence provided in our Regional Plan,
the VWDB reaffirms its target sectors as: health care,
manufacturing, professional and business services,
information, and retail trade (Figure 21). Manufacturing
and healthcare include: LifeScience, BioScience, and
BioTechnology. which are also growth subsectors that
are a focus for the VWDB. As a region, the LABRPU is
also targeting health care, information and
manufacturing. Further, occupations in these target
industries provide opportunities for our participants to
attain employment in middle-skill and mid-level wages
allowing them an opportunity for economic security.
Understanding the economic and demographic landscape of the Verdugo Consortium,
has allowed the VWDB to establish the strategic direction for the workforce development
system, including business services and the development of new career pathways to
prepare the workforce for these industries and sectors.
D. The Impact of the Pandemic on the Business Community
The Governor's Shelter in Place Executive Order directed the closure of non-essential
businesses and services including restaruants, bars, theatres, retail stores, gyms and
spas, and other retail and entertainment facilities. These closures resulted in numerous
layoffs and furloughs in Verdugo's tri-city communities. Establishments affected in the
Verdugo Area as a result of the Executive Order include retail and entertainment, which
are both hubs in the Verdugo region. According to Dunn & Bradstreet/Econovue, a total
of 4,765 establishments are located in the Verdugo cities that are affected by the
Executive Order, employing 48,760 workers 20 (Figure 22). While some restaurants
maintained a skeletal staff to offer take-out food services, the list does not include other
businesses impacted by the closures of these establshments (mulitiplier effect). For
example, suppliers to these establishments have also been affected; however, the impact
19 Los Angeles Long Beach Glendale Metropolitan Division Industry Employment & Labor Force. State of California Employment
Development Department Labor Market Division, October 16, 2020.
20 Verdugo Consortium Businesses: Retail, Arts & Entertainment, Eating & Drinking, Hotels & Accommodations. Econovue
Report, December 2020, Dunn and Bradstreet.
Page 17 of 68Verdugo Workforce Development Board Local Plan 2021-2024
has not yet been measured. Figure 22: Verdugo Establishments Affected by Executive Order
Therefore, the actual number of
employees affected by the
closures is projected to be
much higher.
Temporary layoffs, furloughs
and closures began almost
immediately upon the Governor’s Executive
Order on March 19th, with the initial plan to Figure 23: Verdugo WARNs
shelter in place for two weeks to control the
spread of the virus. The two weeks became
a month, extending temporary layoffs and as
the Order continued to be extended, some of
those temporary layoffs became permanent
and others became closures. Governor
Newsom’s Executive Order waived the
requirement for the Worker Adjustment and
Retraining Notification Act (WARN). The
WARN requires employers who are planning
a plant closing or a mass layoff to give
affected employees at least 60 days' notice of such an employment action; however,
many companies still submitted a WARN letter to the State of California Employment
Development Department (EDD), as typically required, even though it was not 60 days
prior to layoff. Once the notice is received, EDD sends a copy of the letter to the local
workforce board and notices are also accessible through CalJOBS system. For the
VWDA (Figure 23), a total of 29 WARN notices were submitted to EDD affecting 2,224
workers.21
Figure 24: Verdugo Company Layoffs / Closures Figure 25: Verdugo Workers Affected
The WARN notices from EDD provide us some insight to the layoff occurring in the
Verdugo community; however, the VWDB relies on the VJC Rapid Response Team for
more accurate information on layoffs and plant closures. The Rapid Response Team
21
WARN Summary Report by Month, January 1, 2020 to March 1, 2021.
Page 18 of 68Verdugo Workforce Development Board Local Plan 2021-2024
proactively outreaches businesses that may be affected by layoffs and provides
intervention services once the layoff is confirmed. The VJC reports results of its services
to the VWDB on a quarterly basis. Since January 2021, the total number of businesses
that have experienced layoffs or closures is 186 (Figure 24), affecting 6,612 Verdugo
workers (Figure 25). While these numbers provide a more expansive insight to the impact
of the pandemic on Verdugo, the Rapid Response Team may not capture all layoffs or
closures, and estimates that the numbers may be greater than their report. The
businesses affected are predominantly Retail, Eating and Drinking, and Arts &
Entertainment (Figure 22). These layoffs and closures are in alignment with the Percent
Change in Number of Small Businesses Open in LA County (Figure 26) which shows the
decline of 29.5% in Retail and Transportation, and 50% decline in Leisure and Hospitality.
Overall, in LA County, as of February 10, 2021, the number of small businesses open
(defined as having financial transaction acidity), decreased by 33.9% compared to
January 202022. The initial deep declines occurred in April 2020 following the shutdown
as a result of the Governor’s Executive Order. The stimulus checks were issued in April
and the unemployment benefits and the Pandemic Unemployment Assistance (PUA)
which added $600 per week in benefits, all began in the April-May timeframe which
increased consumer spending, allowing small businesses to open on a limited basis. The
continued fluctuation is based on the continued reopening and closures as COVID-19
cases increase and decrease.
Figure 26: Percent Change in Number of Small Businesses Open – LA County
In alignment with the Percent Change in Number of Small Businesses Open (Figure 26),
the total small business revenue decreased by 34.2% in LA County as of February 10,
2021 as compared to January 2020 (Figure 27). Revenue for Retail and Transportation
small businesses declined 29.5% and revenue for Leisure & Hospitality declined 50%.
The CARES Act was implemented in March 2020 which assisted in the recovery of small
businesses and the opening of businesses also helped to increase revenue in June-July
timeframe. The small decline in August may be attributed to the cessation of the Paycheck
Protection Program (PPP) and PUA which ended in July. The PUA benefit began again
22
Percent Change in Small Businesses Open. Opportunity Insights Economic Tracker, Harvard University, Brown University, and
, February 27, 2021.
Page 19 of 68Verdugo Workforce Development Board Local Plan 2021-2024
in late August-September although at a reduced amount; however, it may have attributed
to gains in that timeframe. The spike in COVID-19 cases that began during the winter
holidays resulted in another shutdown of non-essential businesses which once again,
affected revenue for small business.23 The continued spikes in COVID-19 cases resulting
in closures and intermittent openings contribute to the volatility of small business revenue.
Figure 27: Percent Change in Small Business Revenue – LA County
Declines in the percent change in small businesses open and small business revenue
result in layoffs of workers that may be temporary or permanent. The longer the
shutdowns continue, the less likely that the small business will be able to reopen and
rehire the worker that were terminated as a result of the shutdown.
E. The Verdugo Workforce and Impact of the Pandemic
The Verdugo labor force is 163,900 residents strong (Figure 28) with an average
unemployment rate of 9.8%, as of December 2020, representing 16,000 residents. 24
According to the State of California Employment Development Department (EDD), the
labor force is determined by the number of residents who earned any income during the
reporting period. The City of Glendale has the largest labor force with 98,800 residents.
These labor force results reflect the impact of the COVID-19 pandemic and the
subsequent shutdown of non-essential businesses on March 19, 2020 with the
Governor’s Shelter in Place Executive Order. The shutdown order resulted in the closure
of businesses and layoff of thousands of Verdugo workers.
Figure 28: Verdugo Labor Force Data (December 2020)
City Labor Force Employment Unemployment
Burbank 56,300 50,400 5,900
Glendale 98,800 89,100 9,700
LCF 8,800 9,400 400
23
Percent Change in Small Business Revenue. Opportunity Insights Economic Tracker, Harvard University, Brown University, and
, February 27, 2021.
24 Monthly Labor Force Data for Local Workforce Development Areas, Report 400 December 2020. Employment Development
Department Labor Market Information Division.
Page 20 of 68Verdugo Workforce Development Board Local Plan 2021-2024
Prior to the pandemic and layoffs, the Verdugo community was experiencing historical
levels of prosperity. In December 2020, Verdugo cities recorded some of the lowest
unemployment rates with 3.6% for Burbank and Glendale and 1.7% for LCF (Figure 29).
The shutdown began in March, with the Governor’s Executive Order, and by May,
Verdugo experienced historically high unemployment rates with 21.7% for Glendale,
23.6% for Burbank and 10.4% for LCF. The unemployment rates have gradually declined
with only Burbank remaining above 10%. 25 This decline is due to the reopening of
businesses on a restricted basis. Restaurants reopened to provide “to go” orders and
outside dining. Other businesses also opened on a limited basis, allowing employees to
be recalled for work. Fluctuations in diagnosed COVID-19 cases have also caused
fluctuations in businesses closing and reopening.
Figure 29: Verdugo Unemployment Rates
The VWDB relies on WARN reports and VJC reports to provide insights into the number
of layoffs occurring in the Verdugo community, as well as the number of affected workers.
An additional source for determining the number of affected workers is based on the
number of workers that filed unemployment insurance (UI) claims (Figure 30).
Figure 30: Number of New Unemployment Insurance (UI) Claims for the Verdugo Consortium
25
Monthly Labor Force Data for Local Workforce Development Areas, Report 400 December 2020. Employment Development
Department Labor Market Information Division.
Page 21 of 68Verdugo Workforce Development Board Local Plan 2021-2024
Prior to the Shelter in Place Order, the VWDA had 904 workers apply for UI in January
2020, and 793 in February 2020. Once the Order was implemented in March 2020, and
layoffs began, the number of UI Claims significantly increased to 11,507. The PUA which
provided an additional $600 per week to each recipient, was implemented in April. The
PUA required a separate claim to be filed, which more than doubled the number of claims
to 25,189 by April. The Governor’s recovery plan allowed for some businesses to open in
June 2020, which returned some workers to their employers resulting in a decline of the
number of UI Claims during this month. The PUA benefit ended in July, also causing a
decline in claims; however, another spike in COVID-19 cases came in August resulting in
re-closures of businesses and the new round of PUA benefits was approved by an
Executive Order from the President, albeit only $300 per week.26
The UI Claims have decreased significantly since August 2020, even as the new spike in
COVID-19 cases occurred at the end of November, resulting in closure once again for all
non-essential business. With no new stimulus approved extending unemployment
benefits and PUA, the claims have not increased significantly with the new shutdown
orders to address the spike. Once the new stimulus package is approved, an increase in
UI claims is expected to occur, even though the Governor has lifted the shutdown orders
as of January 2021, allowing businesses to reopen in limited capacity. Claims in January
2021 (Figure 30) consist of only 2,771; however, remain at triple the numbers prior to the
pandemic. Figure 31: Verdugo Ui Claimants by Gender
An examination of the UI claimants’
demographics provides a profile of the
affected workers (Figure 31) to understand
the impact on vulnerable populations. The
Verdugo labor force is comprised of about
the same number of males and females
and this is reflected in the Claimants.
Males are slightly higher at 54.4%
compared to Females at 45.5%. Most of
the Claimants are between the
ages of 25 to 54, which also Figure 32: Verdugo UI Claimants by Age
comprise the largest segment of
Verdugo labor force (Figure 32).
All races/ethnicities were affected
by the layoffs and closures resulting
from the Shelter in Place Order. A
comparison of the data shows the
percentage of UI claimants that
identified themselves in a particular
race/ethnicity, relative to the
percentage of the labor that the
26
Number of Weekly Unemployment Insurance Claims for Verdugo Consortium. State of California Employment Development
Department, Week Ending February 13, 2021.
Page 22 of 68Verdugo Workforce Development Board Local Plan 2021-2024
segment represents. For example, 59.1% of workers identify as “White” and 59.4% of the
claimants identify as “White” (Figure 33). It is then expected that the claimants, which
indicate those impacted by the layoffs and closures, reflect the demographics of the labor
force. Where there are differences, such as the Hispanic segment where claimants are
about half of the Labor Force percentage, indicate that more Hispanics either remained
on the job/payroll or perhaps, did not file for UI.27
Figure 33: Verdugo UI Claimants Demographics by Race/Ethnicity
Verdugo residents who are Black/African American are one of the smallest segments,
making up about 2% of our population. They make up 2.9% of the labor force and
represent 3.8% of claimants. Because the percentage of claimants is higher than the
percentage represented in the labor force, this indicates that the workers who are Black
may have been more impacted by the layoffs and closures.
Figure 34: Verdugo UI Claimants Demographics by Education
27
Number of Unemployment Claims by Demographics: Verdugo. State of California Employment Development Department.
Page 23 of 68Verdugo Workforce Development Board Local Plan 2021-2024
Education was also a demographic that was examined (Figure 34). Results show that
25.7% of the UI claimants were workers with a high school diploma or GED. Those with
higher education including those with some college were less affected, and therefore, do
not have the same numbers of claimants 28 . These results support the importance of
building the skills and education of the labor force, increasing their resiliency during
challenging economic times.
Figure 35: Percent Change in Employment – LA County
The impact of on workers with less education is further demonstrated with the Percent
Change in Employment for LA County (Figure 35). As of December 2020, employment
rate among workers in the bottom wage quartile (earning less than $27K) decreased by
26% compared to January 2020 (not seasonally adjusted). Low wage earners are
typically workers with lower levels of education. In comparison, the middle wage earners
(earning $27K to $60K) only experienced a 6% decrease and the high wage earner
(earning more than $60K) experienced a 1.1% decrease29.
Figure 36: Verdugo UI Claimants by Industry Sector
28
Number of Unemployment Claims by Demographics: Verdugo. State of California Employment Development Department.
29
Percent Change in Employment, December 31, 2020. Opportunity Insights Economic Tracker, Harvard University, Brown
University, and , February 27, 2021.
Page 24 of 68Verdugo Workforce Development Board Local Plan 2021-2024
In addition to the demographics, the VWDB also examined the industries and sectors
where the claimants were employed to understand the extent to which those industries
and sectors were affected. Claimants came from all of the industries that were impacted
in some way by the pandemic (Figure 36). Most claimants came from Retail Trade and
Accommodation and Food Services which were significantly impacted with more than
12% of claimants being from each of these industries30. The affected industries are in
alignment with the identified non-essential businesses expected to be affected (Figure
22). Overall, almost all industry sectors were affected by the pandemic and subsequent
shutdown.
Understanding the Verdugo community, its demographics, economic landscape and the
impact of the pandemic and Shelter in Place Order, provides a profile of current strengths
and challenges. This environmental scan sets the foundation for the continuation and
reimagining of the workforce development system, including the partnership relationships
to meet the needs of the community.
III. ALIGNMENT TO REGIONAL PLAN
A. Local & Regional Plan Alignment
Several virtual public meetings using webinar platforms were held for local and regional
planning throughout the LABRPU. Local workforce boards held meetings in their own
communities and multiple meetings were held regionwide to discuss key issues that affect
the entire LA Basin, including the unprecedented challenges as a result of the pandemic.
The VWDB sent invitations for regional meetings to all partners and stakeholders and
encouraged their participation to provide input on issues that impact the region.
Participants in local and regional meetings included our VJC partners representing
education; community based organizations (CBO); WIOA Title II, III, and IV
representatives; and business customers including those representing our target
industries.
The participants explored key workforce development issues including: industry-valued
credentials, career pathways, and pathways to middle-class. This allowed participants to
assess workforce activities as well as Verdugo’s workforce development system overall.
Key to these discussions was the identification of challenges that job seekers and trainees
faced as a result of the pandemic, including the need for supportive services to assist
participants in completing their training. Supportive services needs include housing
assistance and technology such as Chromebooks, laptops and hotspots for internet
connectivity. Technology allows participants to access services virtually and participate
in distance learning opportunities. This input is used to redesign services to meet the
needs of participants.
30
Number of Unemployment Claims by Demographics: Verdugo. State of California Employment Development Department.
Page 25 of 68Verdugo Workforce Development Board Local Plan 2021-2024
Business customers provided direct input to their expectations and requirements, noting
where workforce development services could develop services to meet their needs. Key
learnings from the sessions were used to develop a summary of opportunities for
excellence (OFE) for the partners to address over the next four years. These OFEs also
serve as a guide for carrying out core programs including industry sector strategies,
career pathways, youth services, earn & learn, and services to special populations.
Addressing these issues will also contribute towards the VWDB’s strategic goals and
objectives. At the local level, business input is gathered through multiple means and
through meetings that already exist as opposed to creating additional meetings for
gathering input. The VWDB accessed information through its Board meetings and
industry sector strategy meetings. Issues such as preserving the technical talent so they
can return to their previous employer has been discussed as a key business concern.
Even though they had to lay off workers, they will need the talent to return when they are
ready to open. Other employers such as our BioScience companies express concern with
meeting their human capital needs through centralized means so they no longer hunt for
candidates through multiple colleges and AJCCs. Input gathered at the local level was
also shared in the preparation of the Regional Plan to ensure alignment.
The Regional Plan also delineates several approaches for implementing regional sector
strategies and career pathways that will assist in implementing core programs at the
regional level. The Slingshot Initiative in health care is an example of how the Local
Boards worked together to develop a sector pathway in the LABRPU. The Boards
identified employment needs for Case Manager and Care Coordinator and launched
training programs in partnership with local college and adult education providers to train
in these occupations. For example, Glendale Community College, the local adult
education provider for Glendale, offered the training and enrolled participants referred by
the AJCCs throughout the LABRPU.
To facilitate in developing and enrolling in regional career pathways, the VWDB submitted
the Slingshot 2.0 grant proposal on behalf of the region to implement strategic co-
enrollment across the region. Through our successful Verdugo Computer Numerical
Control (CNC) Machinist Academy for students with intellectual disabilities, founded in
Glendale in 2015, Verdugo has a proven co-enrollment strategy. This model was shared
with the other six local boards and used as the foundation for developing a strategic co-
enrollment process for the region. This process allows for co-enrollment and co-case
management, implementing Workforce Services Directive (WSD) 19-09, across local
boards. As contributors to WSD 19-09, Verdugo provided the technical assistance and
led the project to design and pilot the strategic co-enrollment process across all seven
boards. To date, all seven boards have piloted the co-enrollment system with at least one
co-enrollment with another board. This system will be fully implemented to facilitate the
co-enrollment of participants in any career pathway or apprenticeship in the LABRPU.
This co-enrollment will maximize the opportunities available for participants to gain the
technical skills they need to earn competitive wage and achieve economic equity.
To further align VWDB local strategies to those in the Regional Plan, as well as to support
regional career pathways, the VWDB is the project lead to coordinate the Communication
Page 26 of 68Verdugo Workforce Development Board Local Plan 2021-2024
Strategy on behalf of the LABRPU. This included managing the procurement process for
selecting a communication consultant to work with all boards and ensure a consistent and
effective messaging for the region. Responsibilities include, but not limited to, identifying
the appropriate marketing tools to ensure the region’s promotion of regional workforce
development activities to all stakeholders. Currently the VWDB is managing the regional
website: https://www.labwn.com which will serve as the communication means for AJCC
staff to access information on current career pathways and continue co-enrollment to
maximize opportunities for their participants.
B. Regional Plan Engagement
The VWDB participates in multiple activities throughout the year in order to ensure that
the Local Plan is aligned and continues to align with the Regional Plan strategies and
direction. Engaged in regional planning is defined as participating in and contributing to
regional planning, regional plan implementation, and regional performance negotiations.
The VWDB participates in and contributed to regional planning and negotiating regional
performance measures in the following ways:
1) The VWDB’s, Executive Director participates on all scheduled LABRPU meetings.
If the Executive Director cannot participate, a VWDB staff participates on behalf of
the organization. Previously, the VWDB has hosted regional meetings at their
AJCC location and provided support by taking minutes for the meeting and
organizing all meeting logistics.
2) The VWDB is currently supporting the Regional Plan by inviting our local
stakeholders to participate in meaningful discussions as well as providing needed
information to incorporate in the plan. Issues that pertain to the Regional Plan
were discussed in the public meetings to prepare the Local Workforce
Development Plan, including: the impact of the COVID-19 pandemic on
businesses and AJCC customer, participant and business needs as a result of the
pandemic and Shelter in Place Executive Order, workforce development system
redesign in response to the pandemic and partner coordination. Minutes and the
summary of attendees were submitted to the LABRPU Regional Coordinator to
include in the Regional Plan.
3) The VWDB staff provide support to regional grants. Staff assisted in writing grants
for P2E and Slingshot 2.0, 3.0 and 4.0. For the P2E grant, VWDB staff reviewed
the grant application, wrote sections of the grant and revised other sections
accordingly, in the spirit of regional collaboration and investment in regional
success.
4) The VWDB has participated and referred clients to regional grant initiatives such
as the regional apprenticeship programs called “Aeroflex” that allows for
manufacturing and aerospace companies to participate in identifying local talent
that can help them with their job needs.
Page 27 of 68Verdugo Workforce Development Board Local Plan 2021-2024
5) The VWDB Executive Committee Members attended a special Board Member
regional meeting that included board members from all seven boards that comprise
LABRPU. The purpose of the meeting was to discuss and engage in common
workforce issues across all boards in implementing WIOA and serving priority
populations.
IV. WIOA CORE AND REQUIRED PARTNER COORDINATION
A. Coordination with WIOA Core and Mandated Partners
The VWDB and VJC are proud of the partnerships they have developed over many years
with their Core and Mandated Partners (Figure 37). Partnerships are solidified in the VJC
Memorandum of Understanding (MOU). The MOU documents the services provided by
each partner, including a matrix for “at-a-glance” reference by partners. In addition, a
contact list is used for each partner so that staff can connect with the specific staff they
can coordinate with for co-enrollment of participants as well as co-case management.
Figure 37: Core and Mandated Partners
Mandatory Program Partner
Adults (WIOA I) Verdugo Jobs Center/City of Glendale (one-stop/AJCC
operator)
Dislocated Workers (WIOA I) Verdugo Jobs Center/City of Glendale (one-stop/AJCC
operator)
Youth (WIOA I) Verdugo Jobs Center/City of Glendale (one-stop/AJCC
operator)
Native American Programs United American Indian Involvement, Inc.
Veterans State of California Employment Development Department
Wagner-Peyser State of California, Employment Development Department
Adult Education & Literacy Glendale Community College
Rehabilitation Act State of California Department of Rehabilitation
Senior/Older Americans Act Los Angeles County Department of Workforce
Development, Aging and Community Services
Postsecondary Vocational Ed./Perkins Voc. Glendale Community College; GlendaleLEARNS
Trade Adjustment Assistance/NAFTA/NTAAA State of California Employment Development Department
Veterans/disabled veterans State of California, Employment Development Department
Housing and Urban Development Programs City of Glendale
Unemployment Compensation State of California Employment Development Department
Temporary Assistance for Needy Families Los Angeles County Department Public and Social Services
Prior to the pandemic, several partners were co-located at the VJC, including State of
California Department of Rehabilitation (DOR), Glendale Community College (GCC), and
State of California Employment Development Department (EDD). Due to the Shelter in
Place, partners were also required to shutdown and work remotely. EDD and WIOA Title
I (WIOA I) staff remained on a reduced basis. Most employees worked remotely and only
skeletal staff remained to answer phones and continue operations. Participants are seen
by appointment as needed in order to accommodate special needs including disabilities.
EDD also maintained skeletal staff to assist with phones and inquiries. Other than special
Page 28 of 68You can also read