Greater Norwich Energy Infrastructure Study - Report Description Author: Archie Corliss - GNLP
←
→
Page content transcription
If your browser does not render page correctly, please read the page content below
Greater Norwich Energy
Infrastructure Study
Report Description
Author: A
rchie Corliss
Prepared for: G
reater Norwich Development Partnership and Growth Board
Date: 28 May 2019
Reference: P3723
Document History

 Role                            Name                            Date

 Draft                           Archie Corliss                  28/02/2019

 Checked                         Becky Hart                      28/02/2019

 Authorised                      Kate Ashworth                   01/03/2019

 Revised                         Archie Corliss                  20/03/2019

 Checked                         Becky Hart                      25/03/2019

 Authorised                      Becky Hart                      25/03/2019

 Revised                         Archie Corliss                  04/04/2019

 Authorised                      Kate Ashworth                   05/04/2019

 Revised                         Archie Corliss                  23/04/2019

 Authorised                      Kate Ashworth                   24/04/2019

 Revised                         Archie Corliss                  28/05/2019

 Authorised                      Kate Ashworth                   28/05/2019

Design recommendations and specifications provided in this report are based on the best
professional endeavours of the authors. All calculations are based on the best information
available to us at the time of report production. Where third party equipment is referred to we
rely on manufacturer performance statements, guarantees and warranties. We are not liable
for any errors in calculations or omissions resulting from data provided by the customer or
third parties.

Egnida Consulting works to all relevant professional standards and is accredited to ISO9001
and ISO14001 by Lloyds Register. We hold professional indemnity insurance as consulting
engineers for design to the sum of £5 million.

                                         April 2019                                               1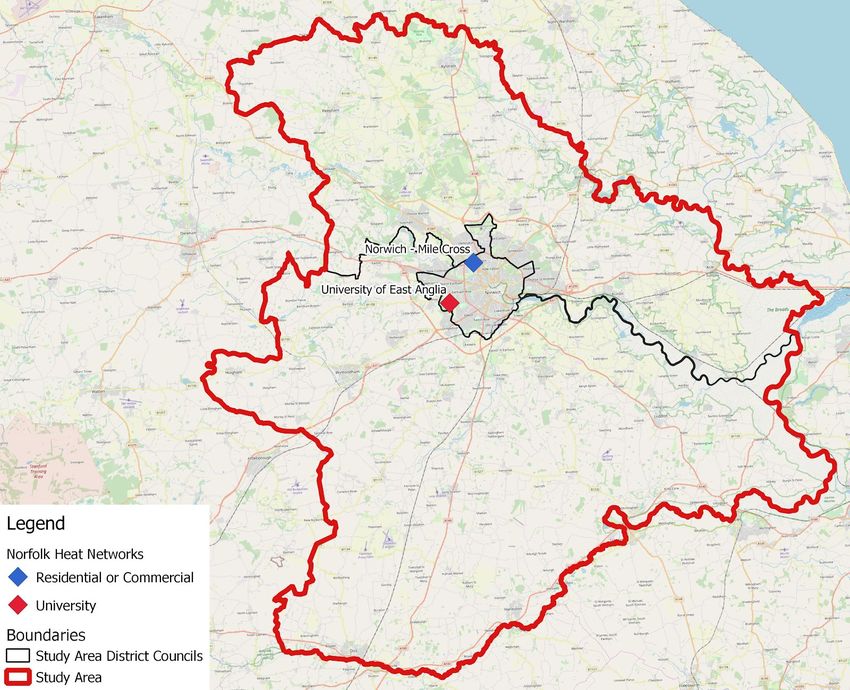
Contents
1. Executive summary                                                   3

2. Introduction                                                         8

3. Existing energy demand                                               9
   3.1. Existing energy demands for electricity and heat                9
   3.2. Projected future demands for electricity, heat and power       10
       3.2.1. Review of energy demand for committed sites              10
       3.2.2. After Diversity Maximum Demand variations                15
       3.2.3. Review of demand from additional development             18

4. Electricity network constraints analysis                            20
   4.1. Existing electricity network constraints                       21
       4.1.1. EHV network constraints                                  26
   4.2. Planned network reinforcement                                  27
       4.2.1. Conventional reinforcement                               27
       4.2.2. Alternatives to conventional reinforcement               28
   4.3. Delivery of development sites in constrained areas             29
       4.3.1. Identified pilot sites                                   30
   4.4. Areas suitable for further development without reinforcement   33

5. Strategic options review                                            34
   5.1. Alternative proposals to deliver required heat and power       34
       5.1.1. Smart control and demand side management                 34
       5.1.2. Innovative approaches to infrastructure investment       36
   5.2. Modelling and cost comparison of interventions                 37
       5.2.1. Costing of reinforcement options                         37
       5.2.2. Cost of an exemplar constraints mitigation scheme        39
   5.3. Case Studies                                                   41
   5.4. Energy policy proposals                                        42
       5.4.1. Planning policy                                          42
       5.4.2. Other areas of energy policy                             44

6. Conclusions and recommendations                                     46
   6.1. Energy infrastructure and demand management recommendations    46
   6.2. Planning policy recommendations                                48
   6.3. Next steps                                                     48

7. Appendix I: Delivering energy investment through an ESCo            50

8. Appendix II Good practice case study review                         54

                                         April 2019                     2
1. Executive summary
Greater Norwich Development Partnership is responsible for all development across the areas
belonging to the councils of Norwich, Broadland and South Norfolk and have ambitious
growth plans for 42,900 homes and around 45,000 jobs to be delivered between 2015 and
2036. One critical aspect to the success of their plans is adequate energy supplies and they
commissioned Egnida to review the current infrastructure and to identify areas where there
may be constraints with energy supplies now and in the future. Further ways to work around
these constraints and mitigate their impact, whether alternative approaches to energy
supplies or planning policy, have been explored. This study is intended to provide evidence in
order for the emerging GN Local Plan to support development and the spatial distribution of
growth.
By reviewing existing energy demand for electricity, gas and heat we created and mapped a
baseline across the region, identifying areas of the highest demand. Plans for development,
both commercial and domestic, were also reviewed and the likely additional peak power
demand was forecast, based on benchmarks and coming changes to government policy. The
final important element is the capacity at each electricity substation across the region. These
are the crucial parts of the infrastructure, which can dictate if development is possible or not.
The peak capacity available has been assessed and then each substation has been
categorised according to the available capacity at peak times.
The results of the analysis are illustrated in F
igure 1. The areas of planned development are
shown, colour-coded in blue according to the peak load of each site. Also shown are local
33/11kV substations, represented by dots colour-coded according to the available capacity.
This shows the current load on these substations and does not account for ‘reserved’ capacity
where part of the available headroom on the substation has already been committed to a
future customer. The substations in green have no capacity issues, however there is only one
on the map. Those in dark orange and red already have little spare capacity and will
struggle to serve any additional development without any mitigation measures.
April 2019 3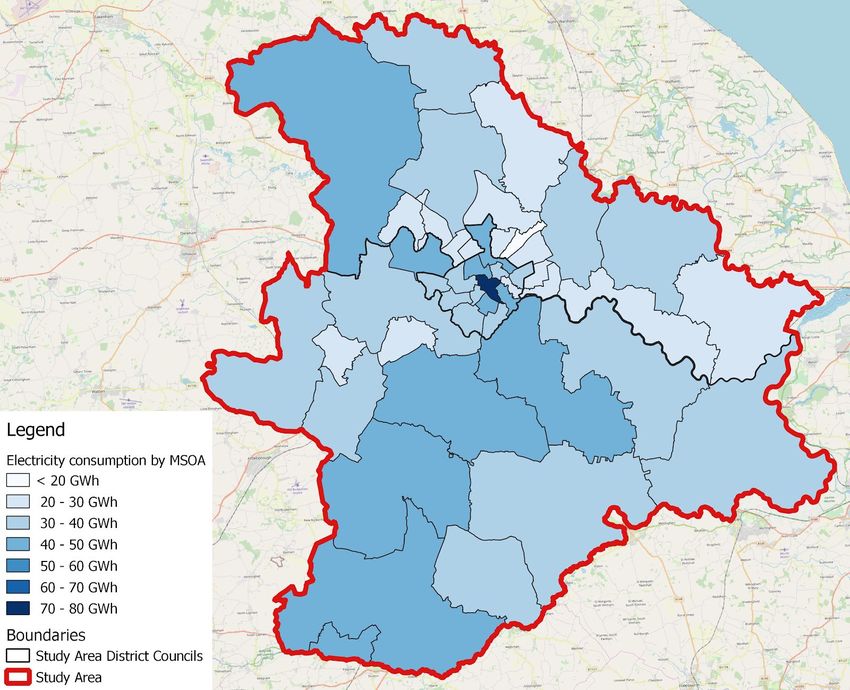
Figure 1: Planned development sites and existing substation spare capacity within Greater
Norwich
Where cumulative required capacity from new development sites exceeds existing available
capacity then not all of the planned development will be able to proceed without potentially
costly and time-consuming reinforcement works.
Primary substations (33/11kV) where forecast demand from planned development exceeds
locally available capacity: Sprowston, Peachman Way, Earlham Grid Local, and Cringleford.
Table 1 shows each of the substations where forecast demand exceeds capacity including
reserved capacity, and the development sites affected. This table accounts for reserved
capacity, which adds an additional barrier to new development where some of the available
headroom is already committed. Beyond these, potential additional sites to be delivered as
part of the new local plan that are provisionally located at Sprowston (Sprowston Primary) and
Costessey (Earlham Grid Local) will also be particularly affected by these constraints, as they
are located in already constrained areas.
April 2019 4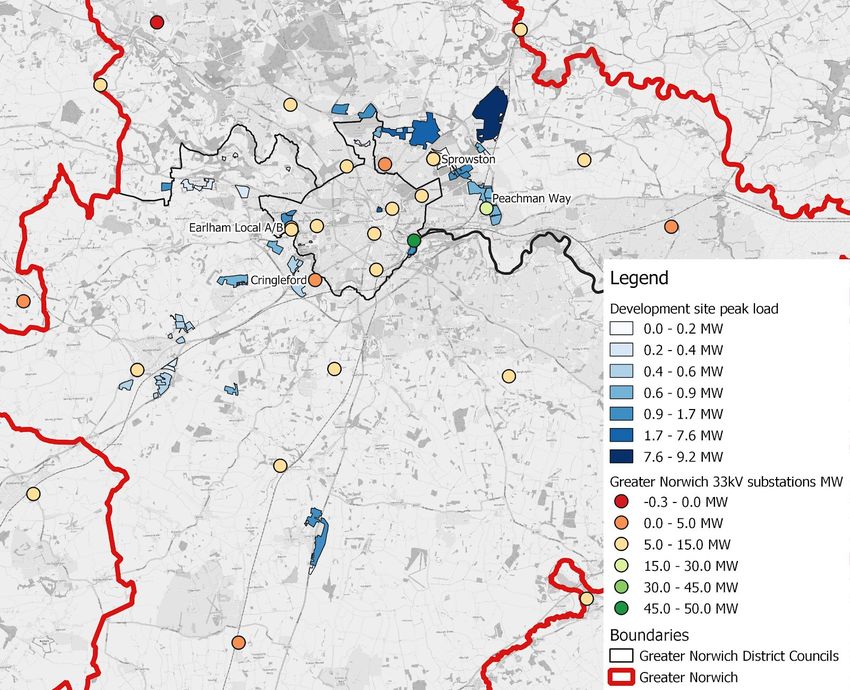
Table 1: Development sites associated with each constrained substation
Substation Affected development sites Current Rating Rating after
(132/33kV) substation including planned
rating reserved development
capacity
Sprowston Beeston Park
Primary Home Farm Sprowston
Land off Salhouse Road
Light Dark
Land south of Green Lane East Red
Amber Amber
Land south of Green Lane West < 0 MW
5-15 MW 0-5 MW
Land south of Salhouse Road
Rackheath
White House Farm
Peachman Broadland Gate Pale
Dark
Way Brook Farm Green Red
Amber
Primary Land east of Broadland Business Park 15-30 < 0 MW
0-5 MW
Land north of Broadland Business Park MW
Earlham Costessey
Grid Local GN Food enterprise zone Light Light
Red
A/B Longwater / Easton Amber Amber
< 0 MW
Norwich Research Park 5-15 MW 5-15 MW
Three Score
Cringleford Cringleford Amber Red Red
Primary Hethersett 0-5 MW < 0 MW < 0 MW
There will be a shortfall in electricity supply for the developments shown in Table 1 unless
remedial action is taken. T his would prevent some of these sites from being developed
within planned timescales and would incur additional cost.
Locations which are currently more suitable for additional development with greater levels of
available capacity are:
● Southeast and Southern Norwich City - particularly where load has been freed up by
reductions in industrial usage.
● Areas to the east of South Norfolk district, supplied by Ilketshall Grid
While there may be electricity capacity in these identified locations, this will not be the sole
determinant of where growth goes, so where development is delivered in other areas a plan
needs to be in place to overcome constraints.
Network constraints are clearly going to present a major barrier to delivering all of the
planned growth in the local plan, and are already having an impact on development, with
capacity issues in areas such as the Norwich Research Park and the Broadland Growth
Triangle. Traditional reinforcement is both a lengthy and costly process, and so innovative
solutions are required in order to facilitate growth within Greater Norwich.
April 2019 5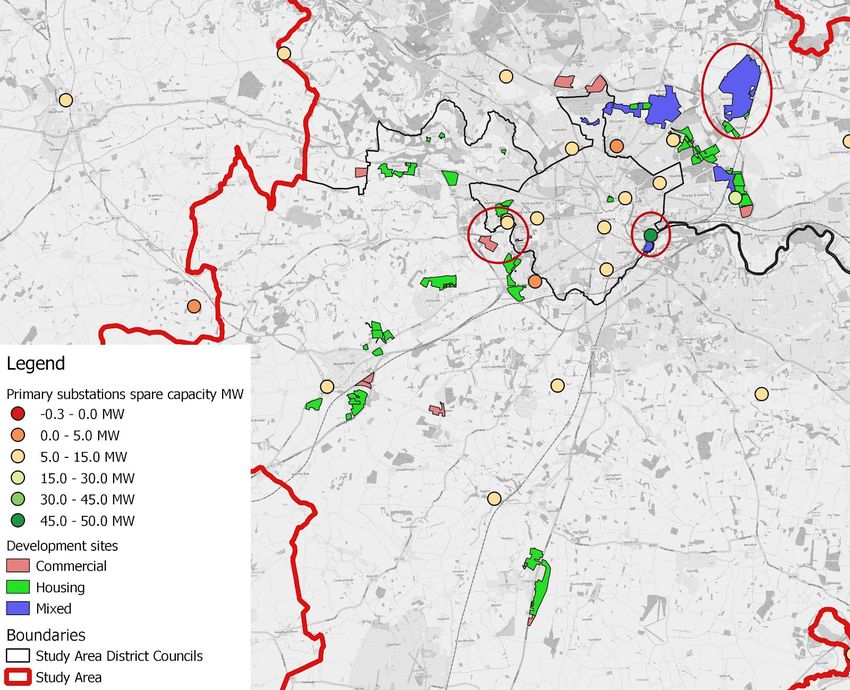
Recommended approaches for grid constraints
The traditional solution to grid constraints is to upgrade the local network connection at the
substation and in the local infrastructure. However, t he capital costs to do this would be
between £2.5 million and £10 million, depending on the scale of the development. It is also
likely to take several years before the work can be undertaken. There are ways to avoid or
reduce the costs of improved network connection. Each site will be different, dependent on
what activity will be undertaken on the site and the local vicinity. However, the following list of
alternative approaches should be considered for all sites affected by grid constraints:
● Semi-islanded approaches utilising on-site generation and smart energy management
solutions can enable development in constrained areas. Semi-islanded development
sites including high levels of on-site, renewable or low carbon generation and batteries
can be designed such that local benefits can be maximised while also having a
positive effect on local electricity networks.
● Work with the DNO to offer demand side response services, where on-site generation
could be turned up or load reduced in response to network signals, can help balance
supply and demand more locally and assist system operators to deal with local
constraint issues, so at times of network stress.
● Investment in infrastructure on these sites should be delivered through an Energy
Services Company model, which can then provide a steady revenue stream for those
involved.
On a modelled constrained site including on-site CHP and solar generation, with private wire
electricity sale and heat supply through a heat network an investment of £3.7m in capital
expenditure would result in a rate of return of 8% over 25 years through selling generated
electricity to customers on site, while capping peak loads on the local network negating the
need for traditional reinforcement.
It is recommended that the pilot sites are developed in such a way so that appropriate
solutions can be identified and tested for how they could be delivered technically and
economically. These solutions can then be applied to other sites with similar issues, and
should be assessed with a view to understanding the potential for replication of each technical
solution.
Public sector organisations are best placed to unlock the barriers to development that a
grid constraint network present a s they are motivated to encourage development in their
areas, have a long term investment view, a low risk profile allowing a lower cost of capital for
investments and can play a vital facilitation role between the key parties. In order for the public
sector to facilitate infrastructure improvements or innovative approaches to power delivery it
is likely to require the establishment of an Energy Services Company to facilitate local
authority involvement in this and manage investment and risk.
April 2019 6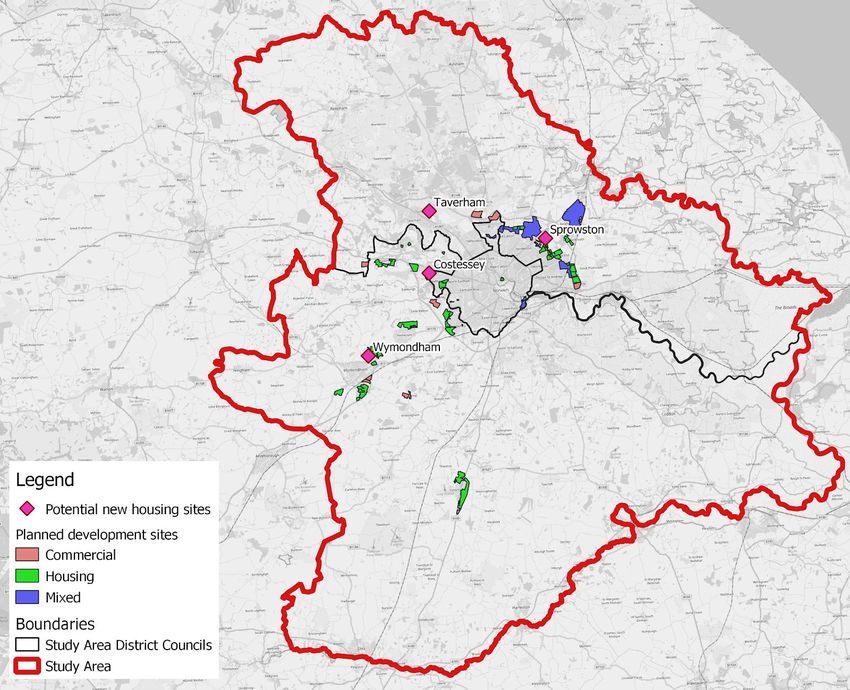
Planning policy
In addition to the commercial facilitation role that the Councils can play, consideration of how
local planning policy could help facilitate development will be beneficial to optimise the
schemes coming forward. The details of the policy would have to be developed by each local
authority, however the following areas are recommended focus areas in order to shape
developments and ensure grid constraints are not a barrier:
● Minimising energy demand from new development – by exceeding Part L Building
Regulations requirements.
● Ensuring energy is used efficiently – look at balancing the demands across as site by
identifying complementary tenancies and activities.
● Managing peaks of electrical demand in new developments - use on-site ESCOs to
balance supply and demand through the use of renewable energy and batteries.
● Reducing carbon intensity of energy supplies through increasing renewable generation
locally and requiring greater carbon reduction from developers
Next steps
Further actions to progress this study are:
● Incorporate planning policy recommendations into Greater Norwich Local Plan
● Undertake more detailed feasibility studies considering identified pilot sites in order
to model potential semi-islanded approach in greater detail
● Get buy-in from local authority senior leadership for development of an E nergy
Services Company to deliver local infrastructure investment
● For sites in areas that are particularly constrained ensure alternative approaches to
energy infrastructure a re considered
April 2019 7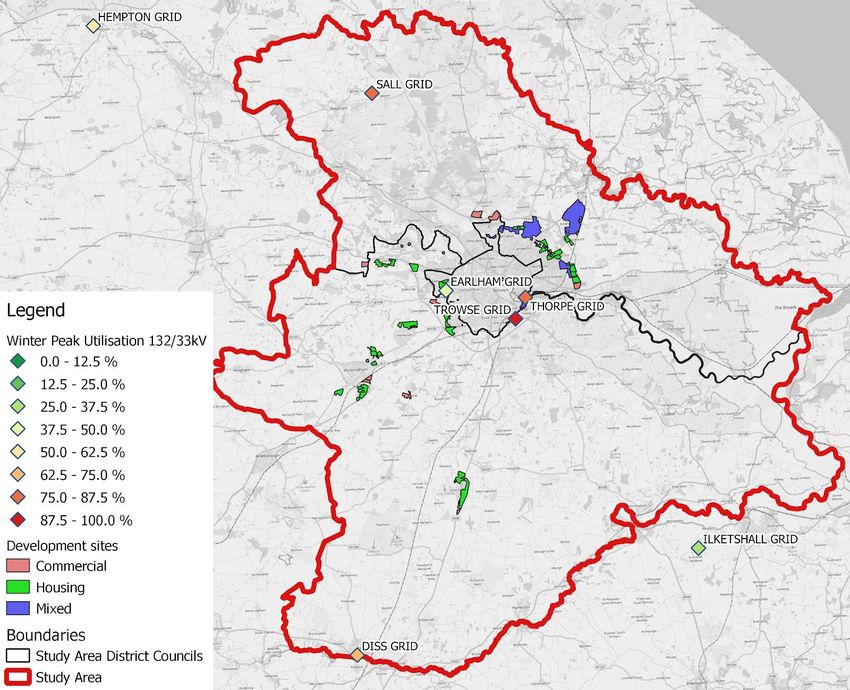
2. Introduction
Broadland, Norwich and South Norfolk councils, the Greater Norwich (GN) authorities, have an
existing Joint Core Strategy (JCS), and supporting Local Plans, covering the period to 2026.

Working with Norfolk County Council and the Broads Authority through the Greater Norwich
Development Partnership (GNDP), GN authorities are reviewing and rolling forward the joint
Greater Norwich Local Plan (GNLP) to 2036, covering both strategic policies and the allocation
of housing, commercial and other sites. Estimated growth requirements out to 2036 have
been produced by the GNDP; the evidence suggests a target of 42,900 houses and around
45,000 jobs 2015-2036.

To support the delivery of their planned growth, the GN authorities require a strategic
approach to identifying any areas of constraint, securing the anticipated power requirements
and putting in place mechanisms and policies to address these constraints. This study will
support both the planning and delivery of growth. It will provide evidence in order for the
emerging GN Local Plan to support development and the spatial distribution of growth. It will
also identify electricity grid constraints and opportunities at key committed sites and advise
on suitable energy policies.

This study will provide a robust evidence base for the GNLP, support the drafting of effective
energy policies, the development of the growth strategy and help ensure delivery of
committed sites.

                                         April 2019                                              8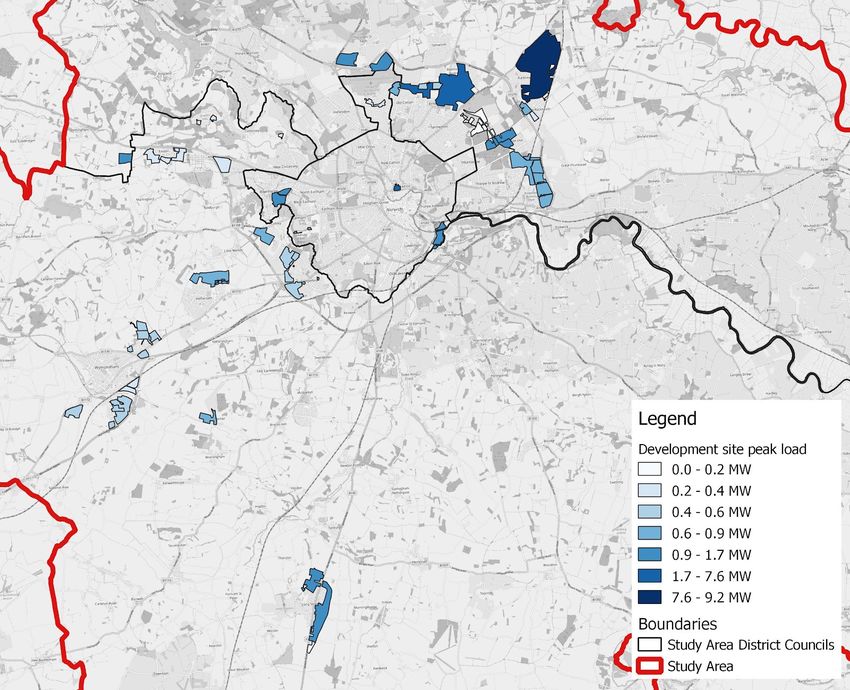
3. Existing energy demand
In order to understand the area’s energy infrastructure, local energy demands have been
analysed and considered in context with the electricity network constraints
3.1. Existing energy demands for electricity and heat
Electricity consumption has been mapped by Middle Super Output Area (MSOA), a geographic
unit by which the Department for Business, Energy and Industrial Strategy (BEIS) publishes
this data, this is shown in F
igure 2 below. From this we can see that the most concentrated
electricity demand is seen in central Norwich. These figures are an aggregation of both
domestic and industrial demand in the area. Electricity demand has also been considered in
the context of peak power demand through analysis of UK Power Networks (UKPN) load data.
This is presented further into the report.
Figure 2: Electricity demand by Middle Super Output Area in Greater Norwich, 2017
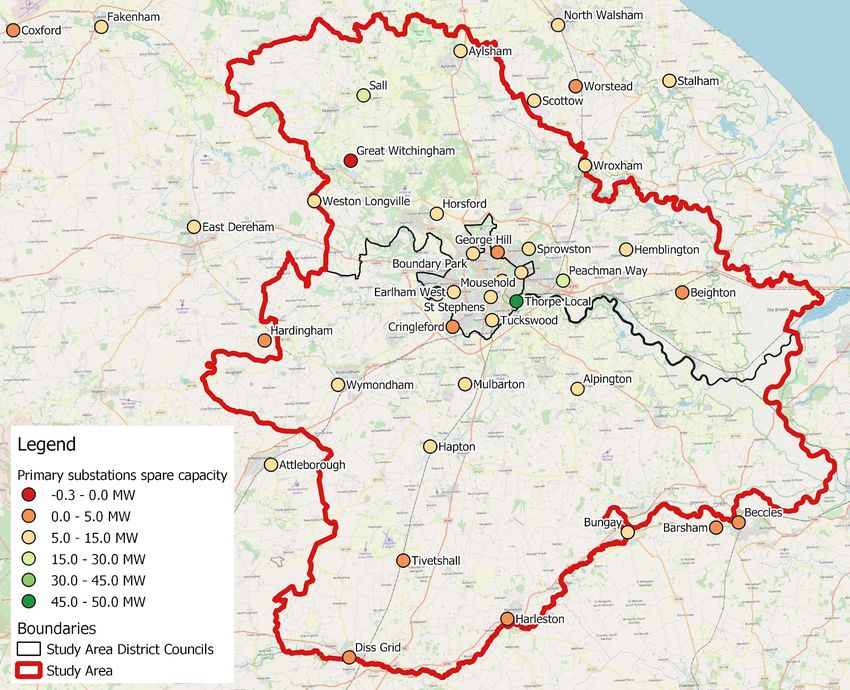
One avenue that needs to be considered is opportunities to supply energy through heat
networks. This is important as it is potentially an alternative means of supplying heat to
homes without utilising in-home gas boilers or electric heating/heat pumps which can impose
April 2019 9additional demands on the grid at peak times. To aid in this we have mapped existing heat
networks within Norfolk to better understand what the potential for connections to existing
networks may be. These are shown in F igure 3 below.
Figure 3: Existing heat networks within Greater Norwich, 2019 (ADE)
The University of East Anglia (UEA) has a heat network supplying heat to buildings on its
campus. This is fed by gas-powered Combined Heat and Power units generating heat and
electricity, with top-up provided by gas boilers. Generated electricity is also used on site to
offset demand. The Mile Cross heat network is a residential network supplying heat only in the
northwest of the city. No planned heat networks of significant scale were identified within the
study area.
3.2. Projected future demands for electricity, heat and power
Modelling has been undertaken to understand the likely impact of local growth on energy and
power demands in order to consider how this might be able to be delivered locally.
3.2.1. Review of energy demand for committed sites
April 2019 10Energy modelling has been undertaken to consider how energy and power demands for new
sites are likely to vary. The 2014 Joint Core Strategy (JCS) for Broadland, Norwich and South
Norfolk identified sites for new development out to 2026; the new Greater Norwich Local Plan
(GNLP) will run to 2036 and identify further sites. F
igure 4 sets out the locations of the
large-scale development sites identified in the JCS and other Local Plan documents. These
include housing sites of 90 homes and above and commercial sites of around 1 hectare and
above.
Broad locations for the additional growth to 2036 to be brought forward through the GNLP
have been provisionally identified for plan making purposes. These locations are referenced in
section 3.2.3, however, specific sites for this additional growth have not yet been identified.
Figure 4: Committed major development sites in the Greater Norwich area
For each commercial site, energy benchmarks for likely site occupancy based on planning use
classifications have been used to model total energy demands on the site. These have been
combined with load profiles for the different types of commercial demand in order to
understand peak power demands. For some sites floor areas are known, while for others only
the total hectares of the site are known, for sites without floor areas, reasonable assumptions
have been made on expected likely floor area based on the size of the site. Figures with
asterisks alongside them show assumed figures. T able 2 shows the data inputs for each site.
April 2019 11Table 2: Commercial site data and assumptions
Site Site area Floor area Commercial use types
(Hectares) (m2)
Aeropark 37 95,035 B1b, B1c, B2, B8, D1
Norwich Research Park 40 99,000 B1b
Browick Interchange employment 15 46,500* B1 ,B2, B8
site, Wymondham
Hethel Technology Park 15 46,500* Advanced engineering &
Technology
Long Stratton employment land 9.5 29450* B1,B2, B8
Norwich International Airport 30,000 Commercial and
Industrial
Land east of A140, Norwich Airport 35 108,500* B1 ,B2, B8
Land north of Broadland Business 15 57,481 B1 ,B2, B8
Park (Laurel Farm)
Broadland Gate 21.5 42,000 B1, B8, A1-A4, C2, D1,
D2
Rackheath 25 77,500* B1 ,B2, B8
Beeston Park 25,600 B1, A1-5, C1, D1, & D2
Home Farm Sprowston 0.8 2,400 A1
Land north of Repton Avenue 5,600 B2
GN Food Enterprise Park 19 50,000 B2, B8
These development sites are at an early stage, so it is not possible to precisely model future
energy demands. These figures should be viewed as an estimate based on reasonable
assumptions and the best available data. The modelling outputs for commercial sites for a
typical February day are shown in Figure 5.
April 2019 12Figure 5: Commercial demand modelling for typical February day
Electricity demand from housing depends on a number of factors. Within this modelling
exercise we have utilised After Diversity Maximum Demand (ADMD) figures for peak domestic
power. ADMD is used in the design of electricity distribution networks where demand is
aggregated over a large number of customers. Network peak demand, considering diversity
between customers is time coincident where within each household there are times, mainly
the 4-8 pm period, in which electricity is used simultaneously, for example when many
appliances are used at the same time. Within an individual property demand can vary
substantially, but as larger numbers of properties are considered the variance between
instantaneous load in each property reduces overall peak loadings for a given area.
Modelled demand for each large committed development site is given in T
able 3 below. Peak
power demand shown is based on an ADMD of 2kW per house. The impact of this on a per
substation basis is shown in Table 4 in section 4.
Table 3: Development sites, energy and power demands
Development sites Commercial Dwellings Modelled total Peak power
floor area to be built electricity demand (kW)
(m2) demand (MWh)
Aeropark 95,035 4,788 1,304
Anglia Square 1,209 3,875 2,418
Beeston Park 25,600 3,520 13,083 7,640
Broadland Gate 42,000 3,119 856
Brook Farm 600 1,860 1,200
Browick Interchange 46,500 2,620 724
April 2019 13Costessey 432 1,339 864
Cringleford 1,421 4,405 2,842
East Norwich Sites 1,200 3,720 2,400
GN Food Enterprise Park 50,000 459
Hethel Technology Park 46,500 3,023 895
Hethersett 1,067 3,308 2,134
Home Farm Sprowston 2,400 91 493 235
Land east of A140 108,500 6,112 1,690
Land east of Broadland Business 1,333 4,132 2,666
Park
Land east of Buxton Road 225 698 450
Land north of Broadland Business 57,481 3,238 895
Park
Land north of Repton Avenue 340 1,418 788
Land off Salhouse Road 95 295 190
Land south of Green Lane East 153 474 306
Land south of Green Lane West 322 998 644
Land south of Salhouse Road 1,183 3,667 2,366
Long Stratton employment land 1,836 4,405 459
Long Stratton 29,450 1,659 3,672
Longwater / Easton 901 2,793 1,802
Norwich International Airport 40 1,950 577
Norwich Research Park 99,000 8,692 2,338
Norwich RFU 250 775 500
Rackheath 77,500 4,000 13,666 9,207
Three Score 828 2,567 1,656
White House Farm 160 3,652 320
Wymondham 2,270 7,037 4,540
These demands have been mapped and are shown in Figure 6 below. These then need to be
considered within the context of the spare capacity at each substation.
April 2019 14Figure 6: Peak demand mapping of Greater Norwich development sites
The figures presented within this mapping represent standard typical assumptions for
domestic demand of 2 kW per house ADMD. The following section explores scenarios in
which this assumption may need to be altered, in particular in relation to increased use of
low-carbon technologies.
3.2.2. After Diversity Maximum Demand variations
ADMD for a standard property connected to the gas network is assumed at a typical 2 kW per
household, however this can vary, for some types of household occupancy this may be lower,
and may be substantially higher for households with additional technologies included, such as
electric heating, heat pumps or electric vehicle charging. Figure 7 shows how the after
diversity maximum demand per household for standard properties changes with an increased
number of households included within the group.
April 2019 15Figure 7: After diversity maximum demand (ADMD) curve for medium income households,
Network Revolution 20151
Peak domestic demand typically occurs between and 4 and 8pm on a weekday, with
contributions from lighting, cooking and appliances. Additional contributions for heating or
electric vehicle charging can make a major difference to the peak demands per property,
however. There are lower levels of diversity when considering heating loads supplied by
electricity, as all houses within a local area are likely to experience similar temperatures,
requiring heating input at the same time.
This depends heavily on the type of heating systems involved and the energy efficiency of
properties. Direct electric heating imposes significant demands on the grid compared to a
technology such as heat pumps, which utilise electricity to extract heat from the ground or the
air, and are two to four times as efficient. Even when heat pumps are utilised, the time
coincident nature of heating demand overlaps substantially with existing winter evening peaks
for electricity, which can impose additional burdens on local networks.
There is greater opportunity for load shifting of heating demand in properties with greater
energy efficiency. In a well-insulated property, heat will be lost to the outside more slowly, so a
property heated to the desired temperature before the peak 4-8pm period would retain more
1
http://www.networkrevolution.co.uk/project-library/diversity-maximum-demand-admd-report/
April 2019 16of its heat and require less input in topup. This is seen most obviously in ultra-low energy
property designs emphasising a fabric-first approach such as homes designed according to
the German Passivhaus standard which has strict requirements on the maximum space
heating load allowed per property as part of the design.
National carbon reduction targets will require substantial cuts in emissions from the built
environment, including homes, and the Government have provided support through the
Renewable Heat Incentive2 (RHI) to encourage the take-up of renewable forms of heating,
including heat pumps. Utilising electricity to supply heat reduces associated carbon emissions
further still as the carbon emissions factor for electricity falls with greater penetration of
renewable and low-carbon generation technologies into the national generation mix.
Figure 8: Modelled ADMD figures under different scenarios from Strathclyde University’s Wire
Resilience Impact Scenario Calculator (WRISC)3
Figure 8 shows the difference in modelled ADMD under different uptake scenarios of low
carbon technologies, including heat pumps and electric vehicles. This shows the substantial
additional demands that can be imposed by high penetration of low carbon technologies and
the need to incorporate an appropriate plan for some of these issues when considering new
developments.
While developments built today are unlikely to include an electric vehicle charging within every
household, the market share of electric vehicles is increasing rapidly. Alongside the
government commitment for no new petrol- or diesel-only vehicles to be sold post-2040 it is
2
https://www.ofgem.gov.uk/environmental-programmes/non-domestic-rhi/about-non-domestic-rhi
3
http://www.esru.strath.ac.uk/EandE/Web_sites/13-14/WRISC/index.html
April 2019 17clear that the demand from electric vehicles is likely to keep increasing. Infrastructure put in
place in new developments between now and 2036 will need to be future-proofed to cope with
likely changes in habits. The major differences in peak demand per household when including
significant proportions of on-peak electric vehicle fast charging (7kW) demonstrate the
importance of smart charging and incentivising households to charge at off peak times.
Government has already taken steps to address this through the passage of the Automated
and Electric Vehicles Act 2018. This legislation aims to ensure all charge points sold or
installed are ‘smart’, meaning they can receive, process and react to information or signals,
such as by adjusting the rate of charge or discharge; transmit, monitor and record information
such as energy consumption data; comply with requirements around security; and be
accessed remotely. This will enable smarter domestic electric vehicle charging to become the
norm, reducing the owner involvement required to adjust charging cycles to respond to
incentives.
The Government’s 2018 ‘Road to Zero’ strategy sets out ambitions and policies for the
decarbonisation of road transport. One such commitment is related to ensuring the houses
built in the coming years are electric vehicle ready, stating “it is our intention that all new
homes, where appropriate, should have a chargepoint available”. Within high density
developments in Greater Norwich it is unlikely to be appropriate for all new homes to have
their own charging points, however communal parking areas should offer shared charging
points. The need for chargers needs to be considered alongside other factors such as
availability of local public transport. Where charging points are not provided new homes
should be made ‘EV ready’ with pre-wiring put in place so that putting in a home charging point
is straightforward in future.
3.2.3. Review of demand from additional development
Within large sites considered as part of this demand analysis there are 22,836 homes planned
to be built on these. The GNLP identifies a forecast of 41,300 homes to be delivered from
2018 to 2036. 34100 of these are on committed sites, with a further 7,200 to be delivered as
new allocations, including a buffer to ensure delivery.
New housing delivered on small sites of 25 homes or less may not have a major immediate
local impact due to their small scale, however cumulatively demand for these houses
contribute significantly to total additional peak electrical demand across Greater Norwich.
Based on standard ADMD figures, the additional 20,029 homes to be delivered would have a
cumulative peak demand of over 40 MW. As many of these would be delivered on smaller,
possibly rural, sites without access to gas the electrical demand for these may be higher still.
These small sites are unlikely to be suitable for a heat network, so the most likely technology
solution would be an oil boiler, biomass boiler or a heat pump. Future changes to the carbon
factors utilised in the Standard Assessment Procedure will make oil a less likely solution into
the future, indicating heat pumps are a more likely solution. Further to this, in the 2019 Spring
Statement the Chancellor also announced that there will be no fossil fuel heating systems in
April 2019 18new homes built after 2025. This will have a major impact, likely leading to greater uptake of
heat pumps even in areas close to the gas network.
The potential 40 MW of additional demand would represent a significant additional aggregate
load even at the higher voltage level. While the distribution is likely to be dispersed enough
that no significant local ‘hotspots’ of additional demand are created, this additional load also
needs to be considered and the upstream impacts of this on UKPN’s higher voltage network
and the trans. This is explored further in section 4.1.1.
Of the 7,200 additional homes, locations for these have not been fully identified as yet, but
some potential sites for large scale housing development greater than 1,000 homes are
shown in Figure 9 below. From this it can be seen that these sites are in similarly constrained
area to existing development sites, and while there is some spare capacity available, this is
likely to be utilised by already planned sites.
Figure 9: Potential additional sites for new housing development (>1000 homes)
April 2019 194. Electricity network constraints
analysis
The electricity network within Greater Norwich is shown in Figure 10 below. Electricity is
primarily supplied to the area from the Grid Supply Point (GSP) at Norwich Main, where there
is an incoming feed at 400kV from the National Grid. At voltages below this, the electricity
network is operated by the Distribution Network Operator (DNO), UK Power Networks (UKPN).
Figure 10: Electricity network in Greater Norwich at 400kV, 132kV and 33kV (UKPN 2018)
From the incoming feed at Norwich Main, the 132kV network shown in black runs to Bulk
Supply Points (BSPs) at Sall, near the village of Salle, Earlham on the west edge of Norwich,
and Thorpe and Trowse, southeast of Norwich. At these substations the electricity voltage is
stepped down from 132kV to 33kV. Some of South Norfolk is supplied from the BSP at Diss,
which is supplied from a GSP further south at Bramford. Each of the BSPs supplies a number
of further Primary substations, connected by the 33kV network shown in green, where
electricity is stepped down again from 33kV to 11kV. Some large industrial sites will be
April 2019 20connected at 11kV, but the majority of loads, commercial and domestic are connected at
415V or 230V. The network below 33kV is not shown on this map.
4.1. Existing electricity network constraints
As part of this brief loading on the electricity network has been investigated. This has been
undertaken in discussion with UK Power Networks the Distribution Network Operator (DNO)
responsible for East Anglia, London and the South East. Reported figures from the biannually
updated Long Term Development Statement have been reviewed, mapped and analysed in
order to better understand the status of the local network.
Figure 11 shows primary substations supplying Greater Norwich mapped and colour coded
using a traffic light system according to percentage loading on each of these. This considers
peak power winter demand for the area connected to the substations against the maximum
rated capacity of the transformers within the substation. From this it can be seen that the
majority of substations in the Greater Norwich area are over 60% loaded, indicating high levels
of capacity usage locally, however there are some exceptions.
Figure 11: Winter loading % on Primary (33/11kV) substations within the Greater Norwich area
However, more important is how much physical capacity is available at each site at times of
peak demand. Figure 12 shows fewer substations as green or yellow and more in dark orange
April 2019 21or red compared to F igure 11. This indicates that even for those substations that had a
reasonable proportion of spare capacity compared to their maximum capacity, many of these
still have less than 10 MW available peak capacity. The only site now shown in green is Thorpe
Local, a site within Norwich City centre that has significant levels of spare capacity and is
connected directly to the 132kV network.
Figure 12: Available winter peak capacity on Primary (33kV/11kV) substations within Greater
Norwich
One constrained development site in South Norfolk - Hethel Technology Park - has been
unable to secure a connection to the local network as the 33kV network supplying the nearest
primary substation at Hapton Primary is at maximum capacity. To provide additional capacity
at Hapton it would be necessary to install a new 132/33kV substation at the Norwich Main
site. This can take a substantial amount of time, around 5 years, and is also subject to
agreeing a lease for the land required.
These figures show only connected capacity, however alongside this the DNO has also made
connection offers to customers that have not yet connected to the network. Any party can
request and accept a quotation for a particular site which will reserve capacity for a finite
period. Beyond this it is possible to enter into a ‘Reservation of Capacity’ agreement, although
this will incur ongoing charges.
April 2019 22This means that even in areas where there appears to be some spare capacity new
development may not be able to proceed. In those development sites that are more advanced
towards implementation developers involved in these sites may have partially secured some
of this capacity for delivery of these sites, so consideration of reserved capacity as ‘utilised’
and unavailable for development can be misleading, but it provides guidance as to where the
areas of most constraint are. T able 4 shows each development site against its closest
Primary substation, and cumulative additional power demand for each, as well as the 132kV
substation it is fed from.
Table 4: Peak demands per site against each substation
Grid Primary Development site Modelled additional
substation Substation peak power demand
(kW)
Per site Per
substation
132kV direct Thorpe Local East Norwich sites 1,200 1,200
Earlham Boundary Park Norwich International Airport 577 577
Primary
Earlham Grid Costessey 864 7,634
Local A/B
GN Food enterprise zone 974
Longwater / Easton 1,802
Norwich Research Park 2,338
Three Score 1,656
Earlham/ Cringleford Cringleford 2,842 4,976
Trowse Primary
Hethersett 2,134
Hapton Primary Hethel Technology Park 895 5,025
Long Stratton 459
Long Stratton employment land 3,672
Wymondham Browick Interchange 724 5,264
Primary
Wymondham 4,540
Thorpe/ Barrack St Anglia Square 2,418 2,418
Trowse Primary
April 2019 23George Hill Land east of Buxton Road 450 1,738
Primary
Land north of Repton Avenue 788
Norwich RFU 500
Horsford Primary Land east of A140 1,690 2,994
Aeropark 1,304
Peachman Way Broadland Gate 856 5,617
Primary
Brook Farm 1,200
Land east of Broadland 2,666
Business Park
Land north of Broadland 895
Business Park
Sprowston Beeston Park 7,640 20,908
Primary
Home Farm Sprowston 235
Land off Salhouse Road 190
Land south of Green Lane East 306
Land south of Green Lane West 644
Land south of Salhouse Road 2,366
Rackheath 9,207
White House Farm 320
Reserved capacity is not accounted for within these graphics, and is not published by the
DNO, as it can change rapidly as new budget estimates and quotes are requested and existing
offers are accepted or rejected if an offer holder decides not to proceed.
Discussions with UKPN have flagged up areas in which reserved capacity would present an
additional problem. This information is not able to be published, however sites where forecast
load exceeds local capacity are:
● Area around Earlham and the Norwich Research Park
○ Significant amounts of spare capacity has already been reserved by users
within the Research Park, this has been offset when considering additional
modelled load for the site itself
April 2019 24● The Broadland Growth Triangle including Rackheath and Beeston Park and other areas
supplied by Peachman Way Primary and Sprowston Primary
● Cringleford - new housing close to Cringleford Primary, spare capacity utilised as
backup for the hospital
Table 5 shows the spare capacity at each substation alongside the forecast load on each
substation and whether it is the forecast load alone or that combined with reserved capacity
that is the major cause of constraint.
Where cumulative required capacity from new development sites exceeds existing available
capacity then not all of the planned development will be able to proceed without potentially
costly and time-consuming reinforcement works. There will be a shortfall in electricity supply
for the developments shown in T able 5 unless remedial action is taken. This would prevent
some of these sites from being developed within planned timescales and would incur
additional cost.
Table 5: Constrained substations and development sites
Substation Affected development sites Spare Development Issue
(33/11kV) capacity site load caused
(MW) (MW) by
Sprowston Beeston Park 5.1 20.9 Forecast
Primary Home Farm Sprowston demand
Land off Salhouse Road
Land south of Green Lane East
Land south of Green Lane West
Land south of Salhouse Road
Rackheath
White House Farm
Peachman Broadland Gate 11 5.6 Reserved
Way Brook Farm capacity
Primary Land east of Broadland Business Park
Land north of Broadland Business Park
Earlham Costessey 14.3 7.6 Reserved
Grid Local GN Food enterprise zone capacity
A/B Longwater / Easton
Norwich Research Park
Three Score
Cringleford Cringleford 5.6 5.0 Reserved
Primary Hethersett capacity
April 2019 254.1.1. EHV network constraints
Issues upstream from the substations mapped in F igure 11 and Figure 12 can impose an
additional constraint on development. These upstream 132/33kV substations are mapped in
Figure 13 below.
Figure 13: Development site locations as Figure 4 and winter loading of 132/33kV substations
It can be seen from F
igure 13 above that there is only limited capacity available at several of
the major substations supplying the Greater Norwich area. T able 6 below shows the data in
more detail. From this it can be seen that those close to capacity include Thorpe and Trowse
in and close to Norwich itself and Sall Grid near Cawston in the northwest of Broadland
district. These substations all have a winter peak loading of over 80%. Trowse in particular is
very close to capacity, over 96% loaded with only 4 MW of spare capacity.
April 2019 26Table 6: Network loading for Greater Norwich 132/33kV substations
Substation (132/33kV) Peak winter Firm capacity Winter
load (MW) (MW) peak
loading
Earlham Grid 53.6 109.7 49%
Sall Grid 90.5 109.7 82%
Thorpe Grid 88.8 109.7 81%
Trowse Grid 105.3 109.7 96%
Ilketshall Grid 22.6 72.9 31%
Diss Grid 45.4 65.8 69%
These 132kV substations also supply some areas outside of Greater Norwich, meaning that
load growth from new development outside Greater Norwich will also have an impact on
spare capacity at this level. In particular, Thorpe and Trowse Grid supply parts of North
Norfolk, Sall Grid supplies parts of North Norfolk and Breckland, Ilketshall Grid primarily
supplies Waveney and Diss Grid also supplies parts of Mid-Suffolk, St. Edmundsbury and
Breckland districts. The areas supplied by these substations can be seen most clearly from
Figure 10.
Potential future growth and associated grid constraints within North Norfolk have been
assessed in a separate report. Total additional loading on Sall, Thorpe and Trowse from
planned growth within North Norfolk to 2036 is likely to be upwards of 14 MW. This likely
future load growth adds additional pressure to the constrained 132kV substations supplying
much of Greater Norwich.
4.2. Planned network reinforcement
The following section sets out UKPN’s approach to dealing with network reinforcement both
through traditional measures and through procurement of flexibility.
4.2.1. Conventional reinforcement
UKPN business-as-usual reinforcement
As highlighted above, one major potential barrier to new development is available capacity at
132kV, in particular Thorpe and Trowse. These two substations run interconnected at 33kV,
with any additional demand on the 33kV network divided between the two. The levels of new
demand committed is higher than available capacity on these substations, however the
timescales for the development of some of this demand is uncertain.
Reinforcement work at this voltage level is included within the DNO’s business plan
submission to OfGEM for forthcoming regulatory periods when their assessment is that the
load is likely to ‘naturally’ grow to an extent to require the works within that period. However,
the work will only be undertaken once the load has materialised, as OfGEM does not
April 2019 27encourage DNO’s to invest ‘ahead of need’ as they see that as not utilising the funds received
from the customers in the most efficient manner.
Future reinforcement at Thorpe / Trowse was included within UKPN’s ‘RIIO-ED1’ business plan
(Apr 2015 – Mar 2023) submission to OfGEM, however the load has grown more slowly than
anticipated so UKPN may not undertake the works within that period. However, even where
reinforcement is included within the strategic plan, if UKPN receive an application that
‘triggers’ the work before it has been fully authorised, then the applicant is still likely to have to
pay at least a proportion of the costs in line with their Common Connection Charging
Methodology Statement. This means that despite reinforcement being planned by UKPN,
constraints at 132kV level can still present a barrier to new development.
Local network projects
There are a number of other projects underway that will provide reinforcement of the UKPN
network. Within the Greater Norwich area there are two such schemes being delivered in
2018/19 in the area of interest. These are:
33kV cable from Boundary Park Primary to Earlham Grid 33kV reinforcement
This scheme involves reinforcing the 33kV connection running from Earlham Grid
132/33kV substation to Boundary Park Primary 33/11kV in Hellesdon, replacing old
cable that has become fault-prone. It does not provide any additional capacity at this
time, as that is limited by the transformers and switchgear at Boundary Park.
Bramford-Norwich - 132kV reconfiguration
Bramford and Norwich are both Grid Supply Points which deliver power to parts of
Greater Norwich. This reconfiguration of the connection between them adjusts supply
such that a section of network around the Beccles / Barsham area that is currently
supplied from Norwich, will in future be supplied from Bramford (near Ipswich). It will
only affect loads supplied by the 132kV Ilketshall Grid substation on the southeastern
side of South Norfolk district.
4.2.2. Alternatives to conventional reinforcement
UKPN standard reinforcement proposals are based on the use of conventional network assets
such as transformers, overhead lines and underground cables. UK Power Networks is
incorporating flexibility services that achieve net load reduction as an alternative to network
reinforcement. Flexibility is the ability to change generation and demand in order to support
UKPN in its role of developing and operating the distribution network.
Flexibility services are provided by any technology or process that can reduce or shift peak
demand - importing less or exporting more power to the distribution network as an additional
amount relative to its baseline operations – to support UK Power Networks in its role in
operating the distribution network. These services can be procured by network operators by
offering generators or loads financial incentives to respond to signals to turn load or
generation up or down if requested.
April 2019 28UKPN has proposed in its Flexibility Roadmap of 2018 to adopt a ‘flexibility first’ approach to
delivering additional network capacity, in order to drive lower costs and increased renewable
energy on the network through more competition. Flexibility services may provide a lower cost
route to increasing renewable generation capacity on the network than traditional
reinforcement. The core applications for flexibility on the distribution network as described in
the roadmap are:
● deferral of network reinforcement
● managing planned maintenance,
● and managing unplanned interruptions.
UKPN has consulted with industry on the design of its’ flexibility programme, and has
published 28 network locations where flexibility could be used across their three licence areas.
A competitive tender process has been undertaken for services to be delivered in the winters
of 2017/18 and 2018/19, which has awarded contracts at two network locations. Further
areas where flexibility is needed have been identified and will be procured by a tender to be
held by March 2019 designed to meet flexibility needs from 2019/20 and 2020/21. These have
been procured through the Piclo Flex platform4.
None of the sites considered to date have been within the Greater Norwich area, however this
may change as UKPN identifies further opportunities to procure flexibility services. Greater
Norwich local authorities should engage with UKPN in order to highlight the potential
opportunities for rollout of flexibility services in the area. The high level of local distributed
generation and industrial loads makes the area well placed to provide flexibility services.
4.3. Delivery of development sites in constrained areas
Delivery of development sites within areas with substantial constraints can prove challenging,
as where predicted loads exceed available capacity the additional cost of reinforcing the
network can prove prohibitive for development. Reinforcements or upgrades to the electricity
network are required when demand exceeds capacity. If development sites cannot proceed
due to insufficient capacity, alternative measures must be considered in order to deliver these.
Figure 14 shows the development sites and peak loads alongside the spare capacity on each
Primary substation.
4
https://support.picloflex.com/article/24-uk-power-networks
April 2019 29Figure 14: Greater Norwich development site peak loads alongside primary substations
4.3.1. Identified pilot sites
At an initial stage of this study we identified three potential pilot sites through analysis of
constraint data, and review of other information about each site. One site for each of the three
council areas was identified as suitable for further investigation. Further feasibility studies are
being taken forward to explore issues on each of these sites and model appropriate options
for these in greater detail. The identified sites are not the only constrained sites or the only
areas that could benefit from innovative energy approaches, however they were deemed most
relevant at the initial stage, considering network constraints, existing knowledge of the site
and potential for undertaking an innovative approach to energy on the site.
.
April 2019 30Figure 15: Greater Norwich development sites, identified pilot sites circled in red
Norwich Research Park - South Norfolk
The Norwich Research Park (NRP) is to the west of Norwich, in South Norfolk. The area
includes:
● The commercial and research properties within the research park;
● The University of East Anglia (in Norwich);
● Norfolk and Norwich University Hospital;
● Neighbouring future development sites related to the Research Park
This site was selected due to the significant new development proposals on the site, known
constraints to securing new grid connections, and an appetite for and expertise in innovation
within a number of parties involved on the site, particularly the University.
The additional load comes from 40 hectares of new commercial development, however the
site is highly constrained. The University of East Anglia adjacent to the site has on-site
generation and well considered and long-term plans to manage their electricity and gas
demand, to decarbonise and maximise their use of on-site electricity generation. There are a
number of stakeholders interested in development in this area, and a range of proposed
solutions involving smart energy management. The hospital site has been the site for a
feasibility study conducted by the Energy Systems Catapult considering potential integrated
April 2019 31energy solutions for the site. The hospital also reserves significant amounts of local capacity
from the local Cringleford substation as backup to its supply.
Rackheath - Broadland
Rackheath is a new development site of 293 hectares total that is part of the Broadland
Growth Triangle to the northeast of Norwich. The endorsed masterplan for the sites
incorporates 4,000 new homes and 25 hectares of employment land which will be delivered in
a series of phases. The wider Growth Triangle is understood by Broadland District Council to
be the largest urban extension in England, with capacity for more than 13,500 homes.
The site was selected due to the scale of the development, with Rackheath the largest single
site within the development, the significant local constraints and the fact it is an entirely new
development rather than an expansion of an existing site presents greater opportunity to put
in innovative approaches to new infrastructure provision.
The local 33kV/11kV electricity substations are significantly loaded, with additional unused
capacity reserved, and under 0.5 MW available for new demand connections. This indicates it
will be particularly challenging to deliver the desired levels of growth within the currently
available capacity. Other utilities investigations undertaken for the Rackheath development
indicate that available capacity may be even more constrained that suggested by this
assessment and thus the challenge of delivery even greater. Peak electrical demand for the
Rackheath site is estimated at 9.2 MW, while the wider Growth Triangle which would also be
connected in similar locations is estimated at 17.3 MW.
East Norwich - Norwich
These sites are close to the city centre. This site was selected partly due to the planning
allocation for on site generation and the opportunities for multiple local generation
technologies to support local energy provision, but also due to the significant available local
network capacity that could allow a demonstrator project to operate in ideal conditions. The
area is relatively unconstrained as a legacy of previous industrial loads and is close to major
UKPN infrastructure, supplied directly from the 132kV network. A smart energy solution would
be able to operate within theoretical import caps to demonstrate the potential impact of smart
control and demand management on peak load.
The area includes three component sites:
● Utilities site – 6.9 ha site allocated for mixed use development to include housing,
employment and renewable power generation
● Deal Ground – 8.1 ha site allocated for residential-led mixed use development
● Carrow Works – a large adjoining site on which industrial activity is to cease. The
expectation is that the site will be redeveloped for residential-led mixed use, though the
principle of redevelopment of the site has not been established.
There is the potential for inclusion of a heat network including supply from Surface Water
Source Heat Pump (SWSHP) heat supply from the River Wensum and from on-site energy
generation. There has been previous work carried out supported by the BEIS Heat Networks
Development Unit (HNDU) to assess the potential for water source heat pump use on the
April 2019 32River Wensum. The sites have the potential to be developed as an exemplar development with
opportunities to model the impact of the design of buildings and infrastructure on site that
include a local heat network and electrified transport.
4.4. Areas suitable for further development without reinforcement
With the significant additions in load from new development sites, constrained areas will
prove more difficult to locate new homes or commercial sites in. Additional sites would ideally
be delivered in those areas that are less constrained. Due to the constraints on the higher
voltage distribution network at 132kV all sites will experience some form of constraint. As
discussed in section 4.2.1 reinforcing these upstream assets is included as part of UKPN’s
business plan, however due to the timescales involved and their requirement to see clear need
for new capacity before investing in the network, the timescales may not align with those
preferred by the council or developers. Longer term additions in development to 2036 will face
different issues to those experienced today, as technological change and reinforcement
undertaken until that point alleviate or change the locations of today’s constraints.
Locations which might be most suitable for additional development on this basis include:
● Southeast and Southern Norwich - particularly where load has been freed up by
reductions in industrial usage. There is, however, a need to be aware of the constraints
upstream at Norwich Trowse 132/33kV
● Areas to the east of South Norfolk district, supplied by Ilketshall Grid shown in F
igure
13
While there may be electricity capacity in the locations identified, this will not be the sole
determinant of where growth goes, so where development is delivered in other areas a plan
needs to be in place to overcome constraints.
In many other parts of the study area, including much of the major northeast-southwest
Greater Norwich development corridor, forecast additional demand is likely to bring assets
close to and exceeding capacity necessitating future reinforcement.
April 2019 335. Strategic options review
This section outlines some innovative proposals to deliver required heat and power for grid
constrained sites. This involves analysis and costing of potential solutions for the identified
problem areas. Modelling has been undertaken to understand how local generation, storage
and automation options could impact the viability of identified development sites. Additionally,
these options are compared to the necessary grid upgrade fees, using indicative costs. This is
to enable an assessment of the options on a financial basis.
5.1. Alternative proposals to deliver required heat and power
New development sites unable to secure network capacity for all of their forecast needs may
need to look to alternative means of securing energy supply for their operations. The addition
of differing forms of on-site generation, storage or other technologies may be able to facilitate
an alternative approach. For example a mixed use development site such as Rackheath may
be suitable for on-site energy generation and infrastructure to be installed in order to reduce
the peak loading on the network. The existing site of the Norwich Research Park would be
more complicated to carry out this approach on due to existing infrastructure already being in
place, but there could be benefits from incorporating smart controls, generation and capacity
swapping.
5.1.1. Smart control and demand side management
There are a number of different measures that fall under the category of demand side
management:
● Smart meters and smart grids – which means:
○ Monitor and control systems.
○ Constraint management tools to monitors and controls loads across the grid.
For example, power aggregators who can help system operators to reduce
electricity consumption at peak times across industrial and commercial clients.
○ Helping utilities avoid the cost of distribution network reinforcement.
● Capacity swapping – facilitating the swapping of excess capacity at certain times of
year between large energy users to negate the need for grid expansion.
● Time of Use Tariffs: Time of Use tariffs are designed to incentivise customers
(domestic and commercial) to use more energy at off-peak times, in order to balance
demand. The benefits are twofold: demand is managed and customers can lower their
bills.
● Complementary tenancies – balancing predicted heat and electricity demand of
businesses/organisations
● Large-scale on-site generation to reduce import requirements
Semi-islanded development
An islanded site is one that is not connected to the electricity network, and is entirely
self-sufficient for energy. A semi-islanded development site is one which maintains a
connection to the wider electricity network, but utilises on-site generation or storage to reduce
the site’s reliance on imported electricity and reduce peak demands.
April 2019 34You can also read