Missing the 23 Per Cent Target: Roadblocks to the development of renewable energy in Indonesia
←
→
Page content transcription
If your browser does not render page correctly, please read the page content below
Missing the 23
        Per Cent Target:
        Roadblocks to the
        development of
        renewable energy
        in Indonesia
        GSI REPORT

                                                                                                 Richard Bridle
                                                                    Danish Embassy, Jakarta

                                                                                                 Philip Gass
                                                                                                 Aidy Halimajaya
                                                                                                 Lucky Lontoh
                                                                                                 Neil McCulloch
                                        © 2014 The International Institute for Sustainable Development
                                                                                                 Erica Petrofsky
                                                                                                 Lourdes Sanchez

© 2018 International Institute for Sustainable Development | IISD.org/gsi                         February 2018
Missing the 23 Per Cent Target: Roadblocks to the development of renewable energy in Indonesia

© 2018 The International Institute for Sustainable Development
Published by the International Institute for Sustainable Development.

International Institute for Sustainable Development
The International Institute for Sustainable Development (IISD) is                      Head Office
one of the world’s leading centres of research and innovation. The                     111 Lombard Avenue, Suite 325
Institute provides practical solutions to the growing challenges and                   Winnipeg, Manitoba
opportunities of integrating environmental and social priorities with                  Canada R3B 0T4
economic development. We report on international negotiations and
share knowledge gained through collaborative projects, resulting in more               Tel: +1 (204) 958-7700
rigorous research, stronger global networks, and better engagement among               Website: www.iisd.org
                                                                                       Twitter: @IISD_news
researchers, citizens, businesses and policy-makers.

IISD is registered as a charitable organization in Canada and has 501(c)
(3) status in the United States. IISD receives core operating support
from the Government of Canada, provided through the International
Development Research Centre (IDRC) and from the Province of
Manitoba. The Institute receives project funding from numerous
governments inside and outside Canada, United Nations agencies,
foundations, the private sector and individuals.

About GSI                                                                             Global Subsidies Initiative
The IISD Global Subsidies Initiative (GSI) supports international                     International Environment House 2,
processes, national governments and civil society organizations to align              9 chemin de Balexert
subsidies with sustainable development. GSI does this by promoting                    1219 Châtelaine
transparency on the nature and size of subsidies; evaluating the economic,            Geneva, Switzerland
                                                                                      Canada R3B 0T4
social and environmental impacts of subsidies; and, where necessary,
advising on how inefficient and wasteful subsidies can best be reformed.
                                                                                      Tel: +1 (204) 958-7700
GSI is headquartered in Geneva, Switzerland, and works with partners
                                                                                      Website: www.iisd.org/gsi
located around the world. Its principal funders have included the                     Twitter: @globalsubsidies
governments of Denmark, Finland, New Zealand, Norway, Sweden,
Switzerland and the United Kingdom, as well as the KR Foundation.

Missing the 23 Per Cent Target: Roadblocks to the development of                      Cover photo © Asian Development
renewable energy in Indonesia                                                         Bank (CC BY-NC-ND 2.0).
February 2018
Written by Richard Bridle, Philip Gass, Aidy Halimajaya, Lucky Lontoh,
Neil McCulloch, Erica Petrofsky and Lourdes Sanchez

                               © 2014 The International Institute for Sustainable Development

                                                                                                      IISD.org/gsi   ii
Missing the 23 Per Cent Target: Roadblocks to the development of renewable energy in Indonesia
Executive Summary
On January 25, 2017, Indonesian Minister of Energy and Mineral Resources (ESDM) Ignasius Jonan stated,
“Indonesia is resolved to increasing its new and renewable energy mix to 23 per cent in 2025 in line with its
commitment to reducing its greenhouse gas emissions it had made during the COP 21 conference in Paris in
2015 (Tempo, 2017). The commitment to increase renewable energy was made as part of a package of measures
to tackle climate change in Indonesia’s Nationally Determined Contribution (NDC) that pledged to reduce
emissions by 26 per cent against the business-as-usual scenario by 2020 and 41 per cent if international support
is granted.
With this high-level commitment to a marked expansion of renewable energy—together with the international
context of falling renewable energy prices—one might expect that renewable energy in Indonesia would be
booming. However, since 2007 most of the increase in electricity production has come from coal (Figure ES1)
and the share of renewable electricity production has remained relatively static, at around 12 per cent of total
250,000
Diesel
Oil
Electricity production (GWh)
200,000
Gas
Diesel
Oil Coal
150,000
Gas Waste
Biomass
100,000 Wind
Solar
Coal
50,000 Geothermal
Hydro
Geothermal
Hydro
0
2007 2008 2009 2010 2011 2012 2013 2014 2015 2016
generation.
Figure ES1: Indonesian Electricity production by source (2007-2016)
Source: Ministry of Energy and Natural Resources, 2016.
Between 2007 and 2016 hydro and geothermal capacity increased by 39 and 67 per cent respectively. But
overall installations pale in comparison to coal, while solar remains almost nonexistent (45 MW total) as shown
in Figure ES2 (Ministry of Energy and Natural Resources, 2016).
© 2014 The International Institute for Sustainable Development
IISD.org/gsi iiiMissing the 23 Per Cent Target: Roadblocks to the development of renewable energy in Indonesia
25,000
20,000
15,000
10,000
5,000
0
Coal Hydro Geothermal Solar
Installed capacity (MW) total Indonesia (PLN + IPP) in 2015
Figure ES2: Indonesian Energy Capacity Selected Sources 2015 (MW)
Source: Perusahaan Listrik Negara (PLN), 2016.
This report seeks to answer the question of why renewable energy deployment, particularly wind and solar, has
not taken off in Indonesia. To understand the forces shaping the sector, and what can be done to remedy the
situation, IISD conducted interviews with politicians, civil servants, industry representatives, renewable energy
developers, civil society organizations, international donors and other stakeholders. A total of 26 interviews took
place, revealing the roots of the problem, the broader political economy of the energy sector and some possible
ways forward.
Core Findings
The most striking finding from the interviews with experts was that none of the respondents
believed that the target of 23 per cent of the energy mix coming from renewables by 2025 target
would be met. This finding alone should ring alarm bells. A change is needed if Indonesia is to meet
its renewable targets and avoid a coal-dominated energy system in the coming decades.
Figure ES3 represents the current share of renewable energy in the primary energy supply mix, including
the share of renewable energy in transportation and electricity generation. The figure shows that the highest
percentage of renewable energy was achieved in 2014, reaching 7 per cent of the total primary energy mix.
A linear extrapolation of this trend would lead to a maximum of 12 per cent of renewable energy share by of
2025—far below the 23 per cent target.
© 2014 The International Institute for Sustainable Development
IISD.org/gsi ivMissing the 23 Per Cent Target: Roadblocks to the development of renewable energy in Indonesia
25%
20%
15%
10%
5%
0%
2007 2008 2009 2010 2011 2012 2013 2014 2015 2016 2017 2018 2019 2020 2021 2022 2023 2024 2025
% of RE in electricity of the total primary energy supply
% of RE in transportation of the total primary energy supply
Target (23% RE by 2025)
Figure ES3: Share of renewable energy in Indonesia’s primary energy supply mix 2007–2015
Source: Created by the authors with data from PLN (2016).
The respondents observed a series of “roadblocks” for renewable energy projects:
• The most important of these is that power purchase prices are simply too low to allow developers to recover
their investments and make reasonable profits, especially since the introduction of Regulations 12/2017
and 50/2017 capping power purchase prices at 85 per cent of the local average generation cost (BPP).
• Frequent changes to policy, regulatory delays and patchy implementation of government policy by PLN all
play a role in further undermining investor confidence and increasing project development risk.
• Developers are also concerned that the new system of pricing does not provide any recognition of the
environmental benefits of renewable energy, and in fact favours fossil sources. By subsidizing and financially
supporting the coal industry, the government of Indonesia is indirectly and artificially decreasing the
average generation cost of electricity. Since renewable energy prices are now linked to these prices through
the BPP, unsubsidized renewables are competing against subsidized coal generation.
• Industry stakeholders also believed that the broad remit and power of PLN present a number of conflicts
of interest. PLN’s role as fuel supplier to diesel generators means it stands to lose a revenue stream
if remote diesel generators are sidelined. PLN owns and operates the majority of fossil fuel generation
capacity and ha an interest in maintaining the status quo to avoid stranded assets.
A final barrier is the nature of support and influence across key stakeholders. Those most unequivocally in
favour of supportive policies for renewable energy exercise relatively little influence over policy-making in the
sector. Actors that are more influential are either moderately supportive but not particularly engaged, conflicted
about whether greater support for renewable energy would positively or negatively affect them, or outright
opposed to developments that could undermine their own business models. A summary of the positions of key
actors is presented in Figure ES3.
© 2014 The International Institute for Sustainable Development
IISD.org/gsi vMissing the 23 Per Cent Target: Roadblocks to the development of renewable energy in Indonesia
On a positive note, continuing global price declines in the renewable energy sector are gradually eroding
the cost gap between renewables and fossil fuels. Almost all the actors would support increased renewable
generation at no extra cost. The regulations capping renewable energy power purchase agreements (PPAs) to
average grid prices provide a benchmark that renewable energy will find difficult to meet. There are however, a
few viable projects being developed. The learning-by-doing effects of these projects will eventually bring down
costs further to the point where a virtuous circle of increasing competitiveness can help to bring forward a
wholesale energy transition, however, this could be greatly accelerated with stronger incentives for renewable
energy.
INFLUENTIAL
The size of the bubbles
How much influence does the group have
represents the level of
Presidency engagement of the group in
promoting renewable energy
over renewable energy policy?
technologies in Indonesia.
State-Owned The larger the size, the
Electricity The Parliament higher the engagement.
Company (PLN)
Ministry of Finance
Renewable Independent
Coal and Fossil Ministry of Energy and Power Producers*
Fuel Industry* Mineral Resources
NOT INFLUENTIAL
Development Partners*
NOT SUPPORTIVE VERY SUPPORTIVE
How much does the group support policies that promote renewable energy?
Figure ES4: Relative support for policies promoting renewable energy, influence and level of
engagement of stakeholder group
Source: Authors’ diagram.
A focused effort to identify and promote opportunities where renewables are the cheapest option—and remove
barriers to deployment of competitive projects—could include:
• Maintain policy stability, remove regulatory barriers and streamline processes for consent and permitting.
• Ensure that off-grid electrification projects use lowest-cost technologies: in practice this would mean taking
steps to transition from diesel to solar and hydro for microgrids where viable.
• Re-evaluate whether trade and local content requirements are delivering value or unnecessarily increasing
prices.
• Proactively support the development of good sites where large-scale renewable energy projects are likely to
come in below wholesale (BPP) prices and develop these sites through renewable energy auctions.
• Level the playing field for renewable energy by phasing out subsidies to fossil fuels including coal and
increasing understanding of the externalities of fossil fuels.
• Many of these measures can also be supported through international financial and technical assistance, for
instance by accessing NDC support mechanisms.
© 2014 The International Institute for Sustainable Development
IISD.org/gsi viMissing the 23 Per Cent Target: Roadblocks to the development of renewable energy in Indonesia
Finally, noting the unique position of PLN as a powerful player in the energy sector, the single buyer of
electricity and the largest owner of fossil-fuelled generation assets, it may be that the internal contradictions of
these roles prevent PLN from being a driving force for renewable energy. Government action may be necessary
to either fundamentally change PLN’s incentives so that its interests are better aligned with renewable energy or
take steps to ensure that PLN implements energy policy, even if that policy is not aligned with its own interests.
© 2014 The International Institute for Sustainable Development
IISD.org/gsi viiMissing the 23 Per Cent Target: Roadblocks to the development of renewable energy in Indonesia
Table of Contents
Introduction...........................................................................................................................................................................................1
2.0 Roadblocks to the Development of Renewable Energy in Indonesia............................................................4
2.1 Technical Constraints and Geographical, Environmental Factors....................................................................4
2.2 Renewable Energy Prices and Tariffs.......................................................................................................................................... 5
2.3 Policies and Regulations .......................................................................................................................................................................8
2.4 Subsidies and Externalities ...............................................................................................................................................................9
2.5 Rent Seeking on Fossil Fuel Supply Contracts ..............................................................................................................10
3.0 The Political Economy of Renewable Energy Policy in Indonesia.................................................................. 11
3.1 The Key Actors .............................................................................................................................................................................................11
3.1.1 The Presidency.................................................................................................................................................................................11
3.1.2 The Parliament (DPR)................................................................................................................................................................12
3.1.3 The Ministry of Finance...........................................................................................................................................................12
3.1.4 Ministry of Energy and Mineral Resources.............................................................................................................13
3.1.5 PLN............................................................................................................................................................................................................13
3.1.6 Renewable Energy IPPs.......................................................................................................................................................... 14
3.1.7 Development Partners and Civil Society..................................................................................................................15
3.1.8 Coal and Other Fossil Fuel Interests.......................................................................................................................... 16
3.2 The Political Equilibrium.......................................................................................................................................................................19
3.3 The Prospects for Meeting the 23 Per Cent Target......................................................................................................21
3.4 How Might Things Change?..............................................................................................................................................................21
3.4.1 A New Vision for Renewables........................................................................................................................................... 22
4.0 Conclusions and Recommendations ...........................................................................................................................25
Annex 1: Methodology .................................................................................................................................................................30
© 2014 The International Institute for Sustainable Development
IISD.org/gsi viiiMissing the 23 Per Cent Target: Roadblocks to the development of renewable energy in Indonesia
1. Introduction
Indonesia has committed to increase its renewable energy capacity to 23 per cent of total energy resources by
2025 (Tempo, 2017, see Box 1). The commitment to increase renewable energy was made as part of a package
of measures to tackle climate change in Indonesia’s Nationally Determined Contribution (NDC).
With the country’s ambitious international climate commitments and national targets for renewable energy,
the future of coal development should be in question and renewable energy should be booming. However,
electricity production from renewable energy has remained relatively flat at around 12 per cent of electricity
supply between 2007 and 2016. Over the same period, electricity production has increased by around 70 per
cent, and production of electricity from coal has more than doubled to meet this rise (Ministry of Energy and
Natural Resources, 2016).
Globally, investment in power capacity is increasingly moving toward renewable technologies. Wind, solar,
biomass, waste-to-energy, geothermal, small hydro and marine sources accounted for 138.5 GW, representing
55 per cent of all capacity added globally in 2016. Investment in renewables was more than double that of fossil-
fuelled capacity. The most investment is currently allocated to wind and solar, which accounted for USD 114
billion and USD 112 billion respectively in 2016, representing more than 90 per cent of all renewable energy
investment.
In Indonesia, the situation is very different—most renewable investment in recent years has been in hydro and
geothermal. Wind and solar appear to be almost absent: official figures record just 21 GWh of solar photovoltaic
(PV) production and 5.7 GWh of wind production, less than 0.01 per cent of the total (Ministry of Energy
and Natural Resources, 2016). In 2016 modern renewable energy use (excluding biomass used for heating and
cooking) accounted for only 5.2 per cent of total primary energy, far below the 23 per cent goal.
Looking just at the electricity sector, the vast bulk of generation is derived from coal and gas (see Figure 1
below). Increases in electricity production since 2007 have been largely met by increases in coal generation. An
increase in the share of renewable generation of electricity is a prerequisite if the 23 per cent target is to be met;
however, recent history shows no sign of a marked increase in renewable energy generation relative to the overall
increase in demand. While there is some growth in generation of renewables in terms of absolute amount, it is
not surpassing relative growth from fossil fuel energy sources.
Yet there have been some increases in installed renewable energy capacity in Indonesia. Between 2007 and 2016
hydro capacity increased by 39 per cent to 5.1GW, geothermal capacity by 67 per cent to 1.6 GW. Solar and
wind energy have not yet seen significant levels of deployment, but small numbers of projects have installed. The
total installed capacity for solar is reported to be 16 MW in 2016. However, over the same period, production
from thermal (mainly coal-powered) steam generators rose from 12 GW to 29.8 GW.
© 2014 The International Institute for Sustainable Development
IISD.org/gsi 1Missing the 23 Per Cent Target: Roadblocks to the development of renewable energy in Indonesia
250,000
Diesel
Oil
Electricity production (GWh)
200,000
Gas
Diesel
Oil Coal
150,000
Gas Waste
Biomass
100,000 Wind
Solar
Coal
50,000 Geothermal
Hydro
Geothermal
Hydro
0
2007 2008 2009 2010 2011 2012 2013 2014 2015 2016
Figure 1. Indonesian Electricity production by source (2007–2016)
Source: Ministry of Energy and Natural Resources, 2016.
The solar and wind revolutions that have sent shockwaves through global energy investment have not yet had
an impact on the energy market in Indonesia. The immediate question is “why not?” The simple answer in the
case of wind is that low wind speeds in much of the archipelago, particularly inland, reduce the potential sites;
however, there are still many undeveloped viable sites in coastal regions (EMD, 2017). The same certainly
cannot be said for solar radiation, where there is significant potential throughout the country.
Hence the question remains “What dynamics and barriers hold back the renewable sector in Indonesia?” The
lack of new renewable energy capacity also calls into question whether the target of 23 per cent renewable
energy by 2025 can be met. Figure 2 shows the current share of renewable energy in the primary energy supply
mix, including its share of transportation and electricity generation. It shows that with the current trend, the
share of renewable energy in the total mix might reach just above 10 per cent. If the 23 per cent target is to be
met, swift action will be needed to identify and address the barriers so that wind and solar in particular will be a
key part of the solution (see Box 1).
© 2014 The International Institute for Sustainable Development
IISD.org/gsi 2Missing the 23 Per Cent Target: Roadblocks to the development of renewable energy in Indonesia
25%
20%
15%
10%
5%
0%
2007 2008 2009 2010 2011 2012 2013 2014 2015 2016 2017 2018 2019 2020 2021 2022 2023 2024 2025
% of RE in electricity of the total primary energy supply
% of RE in transportation of the total primary energy supply
Target (23% RE by 2025)
Figure 2. Share of renewable energy in Indonesia’s primary energy supply mix (2007–2015)
Source: Authors’ figure based on data from PLN, 2016.
Box 1: The 23 Per Cent Energy Target
There is some uncertainty around exactly what is included in the 23 per cent energy target. The target
was enshrined in law by regulation 79/2014, which mandated that renewable energy and “new” energy
should provide at least 23 per cent of energy by 2025 (President of the Republic of Indonesia, 2015). This
regulation defines “new energy sources” as any energy generated by using “new technologies,” a term
that includes renewable energy technologies, but also nuclear or even new technologies based on coal-
to-liquid or coal-to-gas processes. The media, however, defines the 23 per cent target as the renewable
energy share used for electricity and transportation in the total primary energy mix (Tempo, 2017).
While technological innovation in the energy field is welcome, meeting the 23 per cent target from
coal-based energy sources would not bring the same kind of environmental benefits as fulfilling the
target based solely on renewable energy generation. The regulation itself provides no guidance on the
acceptable proportions of renewable and “new energy.” Within this “new energy” it is also not clear what
fraction might be expected to come from non-renewable sources.
For the purposes of this report, it is assumed that the bulk of the target is to be met from renewable
energy technologies, to the extent that fossil fuel-based sources provide a negligible impact on the
delivery of the target.
© 2014 The International Institute for Sustainable Development
IISD.org/gsi 3Missing the 23 Per Cent Target: Roadblocks to the development of renewable energy in Indonesia
This report seeks to answer the question of why renewable energy investment has stalled in Indonesia. It
proposes solutions to break the deadlock and remove the roadblocks to meet the country’s renewable energy
target.
To answer these questions, a team of IISD researchers conducted a total of 26 interviews with politicians, civil
servants, industry representatives, renewable energy developers, civil society organizations, international donors
and other stakeholders. The interviews revealed the roots of the problem, the broader political economy of the
energy sector and some possible ways forward. This report sets out the methodology applied by the study—
outlined in detail in Annex 1—and presents the findings of this research.
© 2014 The International Institute for Sustainable Development
IISD.org/gsi 4Missing the 23 Per Cent Target: Roadblocks to the development of renewable energy in Indonesia
2. Roadblocks to the Development of Renewable Energy
in Indonesia
According to official statistics, Indonesia generates less than 0.1 per cent of its electricity from wind and solar
(Ministry of Energy and Natural Resources, 2016). However, many manufacturers, developers and investors
believe that there is the potential to develop renewable projects across Indonesia and have attempted to work
within the existing system to deliver projects.
At the project level, it is often a combination of factors that render a project financially unviable. This section
explores common factors that were considered by interviewees to have contributed to reducing the number of
renewables project in Indonesia.
If these roadblocks were to be removed there is a significant pipeline of projects at various stages of development
that could help deliver the renewable capacity needed to meet the 23 per cent renewable energy target.
2.1 Technical Constraints and Geographical, Environmental Factors
Several technical factors are often proposed to explain the lack of renewable energy deployment, including
the intermittent nature of the resource, the many grids scattered across Indonesia’s islands, lack of
available land close to population centres and the limited capacity of electricity grids.
Indonesia’s unique geography creates technical constraints for renewable energy projects that will require special
technical solutions. The availability of good sites places restrictions on the types of projects that are technically
feasible and influences the cost of renewable electricity. Indonesia, an archipelago of more than 13,000 islands,
faces unique challenges for designing, constructing and operating electricity networks. In many countries, the
end state for electricity networks is for every significant settlement to be connected to a single national grid. In
Indonesia, this would be impossible. In the foreseeable future, there will continue to be the need to operate a
range of large and small grids in addition to off-grid systems. The variable output from large-scale renewable
generation is easier to accommodate in larger grids such as Java’s, where demand and supply are aggregated
across large number of consumers and generators. The geographical factors that have influenced grid design
have placed constraints on potential renewable generators connecting into these networks. This problem can be
overcome through a combination of developing expertise on grid management, upgrading grid hardware, the
addition of storage in the network and further integration of regional grids through increased deployment of
transmission networks.
Wind resources are also not evenly distributed across the country. Typical mean wind speeds at 80 metres above
ground are in the region of 3–4 metres/second (m/s) in inland sites and 5–6 m/s at coastal sites (IRENA, 2017;
EMD, 2017). Many of the sites with the best resources are in the heavily populated areas of Java, while many of
the areas where low-cost land is available are either far from population centres with only weak grid connections
or poor wind resources. However, many sites could still be developed. A lack of sites is not yet a constraint for
wind, although the constraints that do exist may restrict the potential for very large projects.
Indonesia benefits from globally significant geothermal resources and favourable solar resources right across the
country. Solar can be deployed inland and transmitted to population centres as long as the grid infrastructure is
available to support this. Geothermal resources exist on all of Indonesia’s major islands, and the current level of
generation is estimated to be equal to less than 5 per cent of the available potential (Poernomo et al., 2015).
Energy generation technologies, notably solar PV, are competitive for electricity generation, but when the costs
of providing energy storage are taken into account they are not able to provide power at tariffs competitive
with grid electricity costs. The ongoing fall in the cost of PV and development of affordable electricity storage
technologies are reducing the gap between grid tariffs and off-grid power, but there is still some way to go
before parity is reached. © 2014 The International Institute for Sustainable Development
IISD.org/gsi 5Missing the 23 Per Cent Target: Roadblocks to the development of renewable energy in Indonesia
These factors are important in determining the available capacity of individual sites and projects but there are
many sites where all the major renewable energy technologies are technically viable. It is the financial, regulatory
and, at a high level, political factors that are holding back deployment. Subsequent sections review these
constraints and their impacts.
2.2 Renewable Energy Prices and Tariffs
The price paid to renewable energy generators is the single most significant factor that influences the
financial viability of projects. Over the years, Indonesia has developed a number of mechanisms to provide
attractive prices for renewable generators. Feed-in Tariffs (FiTs) were proposed under a range of ministerial
regulations including 04/2012, 17/2013, 12/2014, 17/2014 and 27/2014 (Asian Development Bank, 2015).
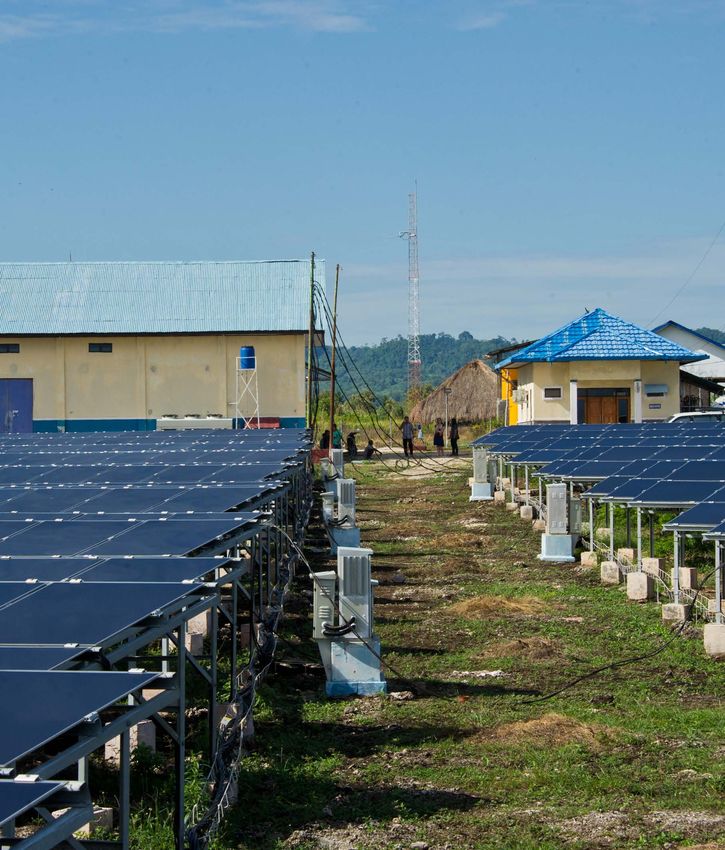
Setting tariffs at a rate that could satisfy renewable energy developers and PT PLN is challenging. All countries
using feed-in tariffs have struggled to set tariff rates at a level that provides a fair return but not excessive profits.
In some countries, failures by regulators to reduce tariffs in line with falling renewables costs have led to booms
in installations but also spiralling subsidy costs. For example, a feed-in tariff in Northern Ireland actually
brought down the provincial government as the true extent of the scheme’s runaway costs became known (BBC,
2017). Figure 3 represents this difficulty to set up the right support policies.
What is the right level of support?
Level of RE projects development
1. Support is insufficient to attract
1 2 3 4 investors at large scale.
2. Support measures become more
and more attractive to investors. RE
projects pick up.
3. The attractiveness of the support
measure to investors causes that
there are more projects in the
pipeline than the regulator or utility
can afford.
4. Support measures become too
expensive for the regulator or utility
and no more projects are approved.
Financial support (FiT or subsidies)
Figure 3. The relationship between support policies and project development
Source: Authors’ diagram.
PLN has historically (and understandably) been reluctant to risk increasing its costs through purchasing
renewable power above market rates. On an annual basis, the Ministry of Finance will provide subsidies to
cover for any gap between actual revenue requirement and actual sales in order to maintain PLN’s financial
sustainability. Under the current policy, revenue requirement is the actual spending until the end of the year
plus a certain percentage of profit margin. However, there is no clear allocation on how much new renewable
energy can be purchased by PLN from new or developing independent power producers (IPPs) beyond next
year, and no mechanism for approval from parliament.
Feed-in tariff legislation in Indonesia established rates but did not provide a clear mechanism for PLN to
recover the additional costs. Other countries such as China have established renewable energy surcharges to
cover the increased cost of renewable energy (Ming, Ximei, Na, & Song, 2013). As a result, PT PLN were
© 2014 The International Institute for Sustainable Development
IISD.org/gsi 6Missing the 23 Per Cent Target: Roadblocks to the development of renewable energy in Indonesia
reported to be unable or unwilling to sign power purchase agreements at the published rates (Horn & Sidharta,
2017). Regulations 12/2017 and 50/2017 attempted to address the costs to PLN by capping renewable
power purchase prices at 85 per cent of the local average generation cost (BPP, Indonesian acronym for biaya
penyediaan pokok). Any renewable power generated at these rates would therefore reduce average costs, adding
renewable energy at no additional cost. Figure 4 represents the price caps per region according to regulations
12/2017 and 50/2017 and compares them with the national average price (BPP). It should also be noted that
the BPP does not differentiate areas in a region where there is a main grid despite some areas in that region are
not connected. The main grid rate in this case is the one applied.
Figure 4. Caps on power purchase prices under regulation 50/2017
Source: Authors’ diagram using data from Ministry of Energy and Mineral Resources, 2017a.
However, interviews with developers and investors indicate that the price caps are themselves a serious barrier
to renewables development, particularly in the Java–Bali region where the majority of power is generated and
consumed. Higher prices in other regions may be enough to finance some projects, but the lack of strong grids
and infrastructure means these are likely to be relatively small. In Java–Bali, the tariffs available under the 85 per
cent cap are deemed unviable for renewable energy developers.
A small number of power purchase agreements are reported to have been signed including 283 MW of small
renewable projects in May 2017 (Newsbase, 2017) and 640MW of hydro and geothermal projects in November
© 2014 The International Institute for Sustainable Development
IISD.org/gsi 7Missing the 23 Per Cent Target: Roadblocks to the development of renewable energy in Indonesia
2017 (Aisyah, 2017b). However, some respondents are skeptical that these projects will actually be built. By
capping prices, the risk to PLN was reduced significantly, but it also removed incentives for project developers.
The development of a steady pipeline of projects has been shown to provide opportunities for cost reduction
through “learning by doing” (Huenteler, Niebuhr, & Schmidt, 2016). Alternative mechanisms that allow an
element of market price discovery, such as reverse auctions, allow a quantity of renewable generation to be
procured at the lowest cost the market can provide. Subsequent auctions can then be used to procure additional
quantities. Quantities can be determined based on a combination of the anticipated cost of the technology and
potential of the technology to become cost effective in the future. Reverse auctions have proved very powerful
tools to reduce costs as companies compete to deliver substantial amounts of capacity (Eberhard, 2013).
Renewable energy auctions have already been used in Indonesia. In May 2017 a pre-qualification process was
announced to develop 167.5 MW of solar projects in Sumatra (Newsbase, 2017). The bids received for these
projects will shed light on the current market prices for solar power. The greater deployment of auctions offers
an opportunity to observe price changes and adjust policy accordingly. However, it is important to realize
that the cost of small remote projects is quite different to large projects with good infrastructure. The current
auctions have not yet explored the cost of large-scale projects on good sites. Future auctions could seek to
promote these kinds of projects.
The capped prices for renewable energy meet the objective of maintaining low tariffs and avoiding subsidies,
but they threaten the development of a viable renewable energy industry. Alternative policy mechanisms such as
reverse auctions also cap prices, by reducing the risk of overspending on renewables subsidies. They have also
provided faster-than-expected cost reductions in other countries and could do the same in Indonesia.
Box 2: 10 Months to Lower Wind Power Prices by 30 Per Cent in India
India’s experience with reverse auctions has been remarkable for its large tender sizes and developer
responses. Before its first reverse auction for wind power in February 2017, the secretary general of
the Indian Wind Turbine Manufacturers Association predicted that tariffs would remain above 4 Indian
rupees (INR), or USD 0.062 / IDR 845, per kWh. He said, “Wind is a very mature sector with a lot of
sophisticated engineering and hardware, and has been in business for 30 years. So one knows the costs
and has learned how to handle feed-in tariff mechanism and project IRRs. Unlike solar, wind sector has
not seen massive cost reduction.” The lowest existing FIT in India was INR 4.16 per kWh. Surprisingly,
developers offered 2.6 times the capacity requested, and amid this competition the winning bids came
in at INR 3.46, or USD 0.054/IDR 730, per kWh. The winning developers and state-owned Solar Energy
Corp. of India (SECI) signed power purchase agreements for a total of 1,050 MW (in 250 and 50 MW
units) in July 2017. A further 1 GW of wind was successfully auctioned in October 2017 with bids as low
as INR 2.64 (USD 0.041/IDR 557) per kWh (Chandrasekaran, 2017). Though not directly comparable, it is
significant that Indian wind auction results are below BPP prices, indicating that at least on good sites
with few technical and regulatory barriers renewables can be competitive.
An SECI representative said that the corporation was planning to tender 4 GW of wind capacity in the
2017–18 fiscal year, plus 5–6 GW per fiscal year thereafter until 2022 until a total of 60 GW is reached.
India’s wind reverse auctions have also resulted in a shift from FITs to reverse auctions across the
country. In May 2017, the Karnataka Electricity Regulatory Commission indicated its intent to reduce
its FIT from INR 4.5 per kWh to a cap of INR 3.61 per kWh, and to select developers based on reverse
auction.
© 2014 The International Institute for Sustainable Development
IISD.org/gsi 8Missing the 23 Per Cent Target: Roadblocks to the development of renewable energy in Indonesia
2.3 Policies and Regulations
Respondents listed a lack of policy stability, difficulties in the negotiation of power purchase
agreements and other regulatory issues (such as the local content requirements) as the main hurdles
stopping the development of renewable energy projects. Regulatory changes increase project development
costs due to the expense of understanding and complying with regulations and can also render some projects
unviable if there is no practical way of complying with the technical constraints of the project. If frequent
changes become the norm then the additional risk associated with regulatory change will also be built into
project margins (Barradale, 2010).
Costs are low where processes are streamlined, very stable and have been in place for a long time. However,
many respondents told stories of projects held up for years by difficulties in the negotiation of power purchase
agreements and other regulatory hurdles. Particular frustration was voiced regarding the cancellation of the
proposed feed-in tariff rates with the consequent capping of power purchase prices and the frequent update of
policies driven by governance changes in the involved ministries. Policy changes of this type place high costs
on developers as they line up viable projects under one set of rules only to find that these were impossible to
develop under the revised rules.
The inclusion of local content requirements for energy projects was reported to increase project costs at the
same time that developers were facing policy changes that reduced tariffs. Ministerial Decree 5/2017 includes
provisions to gradually increase local content requirements from 40 per cent in 2017 to 60 per cent in 2019
(Singgih, 2017a). Due to the relatively small scale of solar manufacturing in Indonesia, it is unlikely that local
production is competitive with international prices. Mandating local production of solar panels raises prices
for developers, reducing the number of viable projects. The local content requirements are intended as a part
of industrial policy to create local industries. However, there is a real risk that local content requirements
combined with the gap between local production costs and international production costs will prevent the solar
industry from becoming competitive in the short to medium term. Requiring local content also increases costs
and makes it more difficult for the 85 per cent cost target to be met by developers, adding to an already difficult
policy viability assessment. Policy-makers should think carefully about whether the benefits of local content
requirements outweigh the costs to the energy sector. There are also reports that international companies
have tried to establish manufacturing capacity in Indonesia, and it has been difficult to obtain the necessary
agreement that their output qualifies under the local content rules (see Box 3).
There is currently a sense among developers and prospective investors that regulations change rapidly and their
experiences with real projects may be variable. Regulatory processes should be developed in consultation with
developers to guarantee some basic levels of service and increase confidence in the regulatory system. Such a
move would yield an immediate dividend, as more projects would be developed in the new climate of certainty.
Box 3: Canadian Solar and Local Content
Canadian Solar, a large manufacturer and project developer, invested in a 60 MWp per year module
manufacturing facility. Following completion of the facility, initial efforts to receive accreditation of the
facility under the local industrial content (TKDN) scheme were rejected, despite significant efforts to
develop local manufacturing capacity.
A key goal of local content requirements is to incentivize investment in manufacturing capacity and
jobs in manufacturing. Placing additional restrictions on who can invest undermines the objective of the
policy and risks reducing supply and increasing project costs further.
MWp is a measure of the peak electricity production of solar modules under standard operating conditions.
© 2014 The International Institute for Sustainable Development
IISD.org/gsi 9Missing the 23 Per Cent Target: Roadblocks to the development of renewable energy in Indonesia
2.4 Subsidies and Externalities
The importance of the coal industry means that coal mining groups have a very close relationship
to the government, and the sector has received considerable government support in the form of loan
guarantees, tax exemptions and price supports. A GSI study from 2017 (Attwood et al., 2017) found that
the government provided at least IDR 9 trillion (USD 664 million) in fiscal supports to the coal industry in
2015. This indicates that the industry is capable of influencing policy.
By subsidizing the coal industry, the government of Indonesia is indirectly and artificially decreasing the
average generation cost of electricity in the country. Since renewable energy prices are now linked to these
prices through the BPP, unsubsidized renewables are effectively being asked to compete against subsidized
coal generation. A GSI estimate found that if all subsidies to coal were removed, the price of electricity from
coal could rise by as much as IDR 68 per kWh (USD 0.05/kWh) (Attwood et al., 2017). Setting tariffs for
renewables based on subsidized costs of coal is creating an unequal playing field for renewables.
Energy use comes at a financial cost, but there are also “external” costs in the form of impacts on the
environment or society that are not currently factored in. Reorienting the fiscal system or otherwise promoting
policies that increase prices on activities associated with environmental “negatives” like pollution, and reducing
charges on activities that provide social benefits, like employment, is becoming increasingly common as
economists look beyond financial costs. Currently, electricity prices are set to reflect the generation cost, and the
impacts of burning fossil fuels on health and climate change are not reflected in these prices. In a country where
around 88 per cent of its electricity capacity comes from fossil fuels, and mostly coal, there is a strong argument
for factoring the cost of environmental harm into the price of electricity (Ministry of Energy and Natural
Resources, 2016).
The World Health Organization (WHO) lists air pollution as the most harmful environmental carcinogen,
killing more people every year than passive smoking (World Health Organization, 2013). Emissions from coal
are associated with respiratory illness, acid rain, and the contamination of water and food with mercury and
persistent organic pollutants (POPs), such as dioxins and polycyclic aromatic chemicals (PAHs) (HEAL,
2013). To evaluate the health cost linked to air pollution in Indonesia, a study developed by Greenpeace based
on results by Harvard University, found that coal power generation caused 6,500 premature deaths a year
(Greenpeace, 2015). Despite the ethical and technical difficulties of estimating the cost of a human life, the
Institute for Health Metrics and Evaluation (IHME, 2016) estimates a mean “Value of a Statistical Life” (VSL)
from a survey of middle-income countries of USD 383,440. The report by Attwood et al. (Attwood et al., 2017)
considers both previous values and estimates the cost of health due to air pollution in Indonesia at USD 0.02
per kWh.
The costs of climate change are calculated considering the cost of CO2 emissions, valuing changes in net
agricultural productivity, human health and property damages from increased flood risk and changes in the
energy system. These estimates range between USD 0.05 per kWh (Interagency Working Group on Social Cost
of Carbon, 2010) and USD 0.26 per kWh (Westphal et al., 2015).
The use of trading systems and pollution charges is one approach to correcting market failures. However, many
countries take account of external costs less formally by adopting policies that promote clean technologies.
The system of establishing a benchmark (BPP) price for generators does not take into account any recognition
of the environmental benefits of renewable energy. In fact, since the coal industry receives support from the
government, the energy market actually favours more polluting coal over cleaner renewables. There is a clear
case for renewable energy to attract some sort of premium to reflect the technology’s positive environmental
impact.
© 2014 The International Institute for Sustainable Development
IISD.org/gsi 10Missing the 23 Per Cent Target: Roadblocks to the development of renewable energy in Indonesia
2.5 Rent Seeking on Fossil Fuel Supply Contracts
Maintaining low electricity tariffs and low generation costs is a key objective for the electricity
sector, yet expensive diesel generators are still seen as a good option for rural electrification. There
is still a large amount of generation from costly diesel generators in many grids across Indonesia. As renewable
energy prices fall, renewables are increasingly becoming the most cost-effective technology for remote areas. A
recent study from the Carbon Trust found that even based on 2016 costs, the levelized cost of energy for mini-
grids operating on solar PV, micro-hydro, biomass or diesel was broadly equivalent and that the economics of
renewables were particularly favourable in remote areas where local diesel prices may be above USD 1 per litre
(Jennings, 2017).
There is an opportunity to use renewable energy to drive rural electrification. The 2,500 village program aims to
provide access to electricity to approximately half a million households in areas that currently have no or limited
access to electricity, mainly in Papua or West Papua (Jennings, 2017).
Some respondents suggested that PLN provides PPAs for diesel and gas-powered projects in remote grids at
rates above regional grid averages. Pertamina, the state-owned fuel supplier, is also involved in remote power
applications through its subsidiary Pertamina Power. In some cases, PLN acts both as a purchaser of the power
and as fuel supplier to power generation projects. This relationship creates a potential conflict of interest.
Some respondents suggested that guaranteed diesel sales resulting from installation of generators allow various
middlemen involved in the distribution of liquid fuels, including in some cases subsidiaries of PLN, to make
consistent profits from fossil fuel-based projects. The replacement of diesel with renewable systems would result
in fuel supply reductions and a loss of profits. This is likely to be opposed by those who stand to lose out and
could lead to resistance to renewable energy projects.
There is a risk that regardless of the technical and economic merits of the technology, the vested interests that
benefit from fuel supply contracts will continue to lobby for fossil fuel-based electrification. One of the key
strengths of renewable energy is that it requires very little maintenance and no fuel inputs. This also means
it does not offer the same opportunities for rent seeking, and it is likely to provoke opposition from those
benefiting from a continued reliance on diesel and gas. Policy-makers should monitor the development of off-
grid generation to ensure that decision making reflects the costs and benefits of the technology
There is also evidence of rent seeking further up the supply chain. In 2015 it was reported that Petral, a
company supplying fuel to Pertamina, engaged in price manipulation estimated to have artificially increased
the cost of oil and gas on procured on contracts by around USD 18 billion (IDR 250 Trillion) (Tempo.Co,
2015). There has also been some criticism of the lack of transparency over the negotiations of power purchase
agreements between PLN and IPPs, suggesting that private project-specific negotiations do not necessarily
secure best value or allow open competition compared to auctions or open tenders (WRI, 2010).
© 2014 The International Institute for Sustainable Development
IISD.org/gsi 11Missing the 23 Per Cent Target: Roadblocks to the development of renewable energy in Indonesia
3. The Political Economy of Renewable Energy Policy in
Indonesia
The lack of renewable energy development in Indonesia is not primarily due to technical constraints—it
represents a political equilibrium. To understand why renewable energy development has stalled, it is necessary
to consider the political economy of renewable energy in Indonesia. This section presents a review of the major
groups involved in the sector with a focus on their influence on—and support of or opposition to—additional
policies to promote renewable energy.
An analysis of the motivations and relative influence of the key actors identifies an impossible balancing act
between access and affordability for consumers, low subsidy cost and renewable energy deployment targets (see
Box 4). It is currently possible to satisfy only two of these objectives. The balance of power in the Indonesian
electricity market is prioritizing lower prices and low subsidies over meeting the renewable energy targets.
The slow progress persists because some of the more influential and engaged actors believe that the current
equilibrium best serves their interests. Section 3.4 outlines some of the forces and actions that might overcome
the inertia that has led to the lack of progress toward the targets.
3.1 The Key Actors
Interviews were conducted with 26 actors involved in the renewable energy sector in Indonesia. They could be
divided into eight main interest groups, depending on their roles and objectives. The groups considered are:
the Presidency, the Ministry of Finance (MoF), the parliament (DPR), the Ministry of Energy and Mineral
Resources (MEMR), PLN (Perusahaan Listrik Negara, the state-owned utility), renewable energy independent
power producers (IPPs), development partners and the coal industry. We briefly consider below the objectives
and attitudes of each group toward renewable energy, the knowledge and capabilities of that institution, along
with the extent of their engagement and influence, and the interests that they have. Table 1 summarizes the main
characteristics of these groups.
The Presidency
The President and his office can be extremely influential and are generally supportive of renewable energy.
The Presidency is responsible for defining the National Energy Strategy (KEN)1 and validating the General
National Energy Plan (RUEN) (Cabinet Secretary of the Republic of Indonesia, 2017). The renewable energy
vision plays an important role in these documents, suggesting that the president is personally supportive of the
renewable energy agenda. Our discussions with this team made clear the support that the president has for a
renewable energy future for Indonesia. However, his framing of the issues is important. As one senior official put
it “The President wants prosperity for the people; we need infrastructure for that; energy is a milestone toward
that goal.”2 In other words, energy policy is one part of a broader push to improve infrastructure and boost
growth, the source of energy—whether renewables or otherwise—would appear to be a lower priority, at least in
the short term.
The Presidency is focused on delivering affordable energy for the people and concerned that renewables could
increase costs. As almost all respondents mentioned, the president is heavily constrained and primarily oriented
toward the immediate impact on ordinary Indonesians. Staff from the president’s office argued that renewable
energy was good and could increase access, but it has to be economically sustainable. As one put it “We cannot
make it [renewable energy] sustainable if next door [coal-based electricity] is 4.5 c [per kWh].” This may reflect
1 The 23 per cent renewable energy target was included in the KEN by Jokowi’s predecessor. Legally, the KEN is a
government regulation, which are in the hand of President, so that Jokowi can adjust the target without consulting the DPR.
2 Interview with senior staff in President’s office, April 2017.
© 2014 The International Institute for Sustainable Development
IISD.org/gsi 12Missing the 23 Per Cent Target: Roadblocks to the development of renewable energy in Indonesia
the belief of senior officials that certain types of renewable energy, notably solar, are not economically viable in
the regions that have significant coal-fired electricity capacity.
The Parliament (DPR)
The Indonesian parliament (Dewan Perwakilan Rakyat, or DPR) has a key role in laying down the legislative
framework for renewable energy and in approving the budgets for line ministries and for PLN that determine
whether renewable energy developments can take place. There is a wide range of different views among the
560 parliamentarians. Some are strongly in favour of renewable energy; however, many are closely allied with
the fossil fuel industry, notably the coal interests. Most are extremely sensitive to the price of electricity for
their constituents and regions. Moreover, it is widely recognized that the in-depth technical knowledge of
many members of the DPR is not high. Consequently, many DPR members are not familiar with the details of
the energy sector—their main knowledge is of the prices, which are paid by businesses and voters within their
regions and the quality of service that they receive.
The process for passing legislation and budgets in the DPR has been criticized as taking place behind “closed
doors,” indicating a lack of transparency (Sherlock, 2012). A number of respondents raised the political process
as a potential barrier to renewable energy policy-making, as it places a layer of uncertainty between elected
representatives and the decisions made by the DPR. Several high-profile corruption cases of former energy
sector policy-makers suggest that the capture and distribution of rents has been a notable feature of the energy
sector, at least in the past (The Jakarta Post, 2016).
One respondent—a representative of the renewables sector who had been asking parliament members to
support renewables policies—told us that the response they had received from DPR members was “The
government didn’t push the agenda so why should we push?” This highlights a need for senior support from
government before parliament members are willing to back key pieces of legislation. As another respondent put
it, “There isn’t anyone pushing for renewable energy except NGOs, the World Bank and industry.”
Several respondents cited the rejection of a budget for renewable energy subsidies for PLN in August 2017
as an example of the lack of support for renewable energy in the DPR. PLN split its accounts and separated
out the funding that would be required to support the expansion of renewables through offering higher
feed-in-tariffs. A request was put to parliament for IDR 1.3 trillion (USD 96 million) but this was rejected.
Numerous respondents argued that had the government really wanted it to this budget could have passed.
Some respondents suggested that, by separating out the renewable component, which had previously been
part of PLN’s operational costs and therefore its general request for annual subsidy, PLN reduced its overall
request for subsidy from parliament, while providing a mechanism through which parliament could reject funds
for renewable energy developments that PLN did not wish to make. Indeed, we were told that forcing things
through parliament was a common way of stopping things from happening.
Overall, the DPR therefore has an important influence. Our judgement is that, on balance, it is not very
supportive of renewable energy despite commitments like the 23 per cent target and the NDC. However, given
the huge number of other issues facing parliament, most DPR members are not deeply engaged in the issue.
The Ministry of Finance
The Ministry of Finance (MoF) provides fiscal governance and manages the state budget, having a critical
role in determining eventual financial support to renewable energy sources. From the ministry perspective,
renewable energy that came at no or little additional cost would be welcomed. However, our interviews suggest
that MoF’s priority is to keep subsidies low, which is at odds with additional spending on renewable energy.
The MoF already supports renewable energy technologies in the forms of fiscal incentives, such as tax policies
and financing, notably for geothermal energy (Attwood et al., 2017). However, the MoF remains reluctant to
increase the subsidies to PLN to cover greater incentives to renewable energy in the form of, for example, feed-
© 2014 The International Institute for Sustainable Development
IISD.org/gsi 13You can also read