Trends Transport and Australia's Development to 2040 and Beyond - Transport and Australia's Development to 2040 and ...
←
→
Page content transcription
If your browser does not render page correctly, please read the page content below
Trends > Transport and Australia’s Development
                          to 2040 and Beyond
© Commonwealth of Australia, 2016
ISBN 978-1-925401-81-3
October 2016/INFRA2516
Ownership of intellectual property rights in this publication
Unless otherwise noted, copyright (and any other intellectual property rights, if any) in this publication is owned
by the Commonwealth of Australia (referred to below as the Commonwealth).
Disclaimer
The material contained in this publication is made available on the understanding that the Commonwealth is not providing
professional advice, and that users exercise their own skill and care with respect to its use, and seek independent advice
if necessary.
The Commonwealth makes no representations or warranties as to the contents or accuracy of the information contained in
this publication. To the extent permitted by law, the Commonwealth disclaims liability to any person or organisation in respect
of anything done, or omitted to be done, in reliance upon information contained in this publication.
Creative Commons licence
With the exception of (a) the Coat of Arms; (b) the Department of Infrastructure and Regional Development’s photos and
graphics; and (c) [OTHER], copyright in this publication is licensed under a Creative Commons Attribution 3.0 Australia Licence.
Creative Commons Attribution 3.0 Australia Licence is a standard form licence agreement that allows you to copy,
communicate and adapt this publication provided that you attribute the work to the Commonwealth and abide
by the other licence terms.
A summary of the licence terms is available from http://creativecommons.org/licenses/by/3.0/au/deed.en.
The full licence terms are available from http://creativecommons.org/licenses/by/3.0/au/legalcode.
This publication should be attributed in the following way: © Commonwealth of Australia 2016, Trends – Transport and
Australia’s Development to 2040 and Beyond.
Use of the Coat of Arms
The Department of the Prime Minister and Cabinet sets the terms under which the Coat of Arms is used.
Please refer to the Department’s Commonwealth Coat of Arms and Government Branding web page
http://www.dpmc.gov.au/resource-centre/government/australian-government-branding-guidelines-use-australian-
government-logo-australian-government-departments-and-agencies and in particular, the Commonwealth
Coat of Arms Information and Guidelines publication.
Contact us
This publication is available in hard copy or PDF format. All other rights are reserved, including in relation to any Departmental
logos or trademarks, which may exist. For enquiries regarding the licence and any use of this publication, please contact:
Director — Publishing and Communications Section
Department of Infrastructure and Regional Development
GPO Box 594, Canberra ACT 2601 Australia
Email:   publishing@infrastructure.gov.au
Website: www.infrastructure.gov.au
Trends > Transport and Australia’s Development to 2040 and Beyond

CONTENTS

EXECUTIVE SUMMARY                                                                                             3

ECONOMIC CONTEXT                                                                                              7

INNOVATION AND DISRUPTION                                                                                   11
   Technology: exponential opportunities                                                                    11
   Big Data                                                                                                 13
   Extreme weather                                                                                          14
   Energy and emissions                                                                                     16
   Fuel efficiency and emissions reduction                                                                  17

TRANSPORT AS A SERVICE                                                                                      19
   Services for people                                                                                      19
   Services for freight                                                                                     21
   Services for network corridors                                                                           22
   Safety and security                                                                                      23
   Revenue and investment                                                                                   26

REGIONAL DEVELOPMENT                                                                                        29
  Demographic change                                                                                        29
  Locational disadvantage                                                                                   30
  Industry across regions                                                                                   31
  Interconnected regions                                                                                    34
  The future of regional Australia                                                                          35

WHERE TO FROM HERE?                                                                                         37

KEY ISSUES AT A GLANCE                                                                                      38

AUSTRALIA’S TRANSPORT MODES AT A GLANCE                                                                     41
  Road		                                                                                                    41
  Rail		                                                                                                    43
  Public transport                                                                                          43
  Active travel                                                                                             44
  Aviation                                                                                                  45
  Maritime                                                                                                  47

                                                        Department of Infrastructure and Regional Development > 1
Trends > Transport and Australia’s Development to 2040 and Beyond

2 > Department of Infrastructure and Regional Development
Trends > Transport and Australia’s Development to 2040 and Beyond

EXECUTIVE SUMMARY

What will Australia look like in 2040? While this cannot be answered with certainty until that time, our
future depends on informed decisions made today. In recent years, our nation has regularly featured in
the highest rankings of the Organisation for Economic Co-operation and Development’s (OECD) Better
Life Index. Maintaining and building upon our current standard of living will support future generations to
remain happy, healthy, productive and competitive in what is an increasingly connected and technologically
advanced world.
This report updates and extends the 2013 publication Trends: Infrastructure and Transport to 2030 with
projections out to 2040 and, where possible, thereafter. Trends draws on a variety of data sources such as
research by the Bureau of Infrastructure, Transport and Regional Economics (BITRE), and other government
and industry sources.
Trends provides a sound evidence base on the key strategic issues that are projected to affect the portfolio
into the future. It does not recommend policies to address these issues or include references to the
existing or proposed policies and activities of the current Australian Government.

Economic context
Understanding Australia’s economic landscape provides context for the changes in the transport sector.
Over recent decades, the rapid industrialisation of the Chinese and Indian economies has driven a sharp
increase in the demand for commodities and a consequential rise in commodity prices. Australia’s mineral
wealth and geographic proximity to the Asia–Pacific region enabled our economy to prosper.
Yet commodity prices have subsided and Australia’s mining industry is transitioning from a construction
phase to a production phase.
Structural change is noted as a hallmark of the modern Australian economy. The transition in the mining
industry is consistent with structural changes across many of Australia’s regions, with the long-term trend
away from employment in primary industries and manufacturing in favour of services.
Meanwhile, low interest rates and the decline in the exchange rate since early 2013 have contributed to
rebalancing the economy towards the non-resource sectors. The lower Australian dollar means that our
exports are relatively cheaper and therefore more competitive internationally.
Looking forward, Australia may benefit from the rising per capita incomes of Asian countries, with
Asia predicted to account for 66 per cent of the global middle-class population by 2030.1 This, coupled with
ageing demographics in Asia, may lead to an increased demand for education, tourism and financial services.
After successive budget deficits, Australia faces a tight fiscal environment. This means we must be smarter
and more open to new ways of providing transport capacity for Australia’s increasing freight task and
growing population, while ensuring transport infrastructure is positioned to adapt to the changing demands
of the future.

1   Pezzini, M, 2012, An emerging middle class, Organisation for Economic Co-operation and Development

                                                                           Department of Infrastructure and Regional Development > 3
Trends > Transport and Australia’s Development to 2040 and Beyond

Innovation and disruption
The ‘Internet of Things’ is changing the way we connect and interact with the world around us. It is driving
new business models like sharing economies (such as Uber), spurring innovation and transforming
community expectations. This connectedness is accompanied by growth in robotics and automation,
advanced analytics using Big Data, drones and 3D printing. These ‘disruptive’ technologies are
transforming how we use transport and improving productivity.
Notably, vehicle technology is shifting toward increasingly sophisticated automation – from autonomous
emergency braking and advanced speed control to fully automated operation. The potential benefits
of such features include improved safety, efficiency, environmental and social outcomes, and
traveller convenience.
In Australia, fully driverless vehicles could be on the market in the next few years, although it may be decades
before a significant proportion of the passenger vehicle fleet are fully automated. This new technology
could improve mobility for people with disability, the young and elderly, free up parking space for urban
redevelopment, reduce infrastructure construction costs and make better use of existing infrastructure.
Changes in climate and extreme weather events remain an ongoing challenge for Australia. Infrastructure
assets are susceptible to the impacts of changing weather patterns2 and the disruptive impacts of
extreme weather often result in large-scale expenditure by the Australian Government, state and territory
governments on disaster relief, recovery assistance and infrastructure restoration.
Currently, Australia has the eighth highest national transport emissions in the OECD3 and these are
projected to increase by 25 per cent between 2013–14 and 2029–30.4
With Australia committing to reduce greenhouse gas emissions by 26 to 28 per cent on 2005 levels by
2030—and other countries adopting new targets to reduce greenhouse gas emission levels further—the
adoption of more energy efficient transport and cleaner forms of fuel is expected to increase substantially
over coming decades.

2   Department of Industry, Innovation, Climate Change, Science, Research and Tertiary Education, 2013, Climate adaptation outlook, Australian
    Government, Canberra
3   Organisation for Economic Co-operation and Development (OECD)/International Transport Forum, 2014, ‘Greenhouse gas emissions database’,
    OECD
4   Department of the Environment, 2015, Australia’s emissions projections 2014–15, Australian Government, Canberra

4 > Department of Infrastructure and Regional Development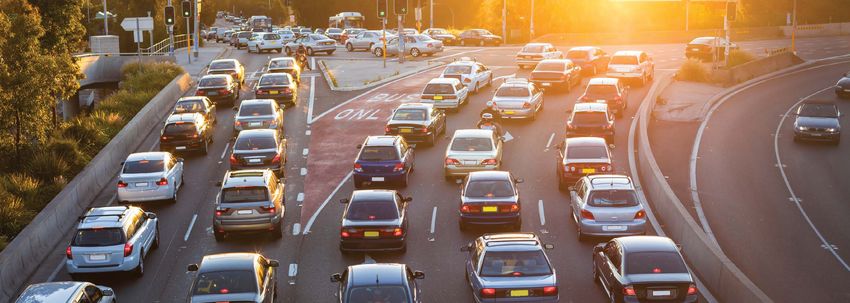
Trends > Transport and Australia’s Development to 2040 and Beyond

Transport as a service
Transport services connect people to jobs, their communities and essential services.
Although one in eight people in Australian cities use public transport for daily commuting, driving remains
the preferred means of transport within Australian cities accounting for 80 per cent of travel.5
The avoidable social costs of congestion in Australia’s capitals may continue to rise from approximately
$16.5 billion in the 2015 financial year to around $30 billion by 2030.6
International air travel will grow strongly to 2030, with both domestic and international passenger
movements through Australia’s capital cities expected to double.7
In addition to transporting people, Australia relies on its freight transport services to connect us to world
trade – from the farm gate through to our major ports and airports.
Australia’s national land freight task is expected to grow by around 75 per cent between 2011 and 2031.8
Maritime transport underpins Australia’s international trade. Over the past decade, total international
trade through Australian ports has more than doubled from 680.6 million tonnes in 2004–05 to
1,447.0 million tonnes in 2014–15.9
Meanwhile, air freight will continue to grow as demand for just-in-time delivery increases for items such
as high value manufacturing and mining products, perishables such as food, urgent medical products and
market flowers.
Beyond moving people and things, transport infrastructure influences the organisation of cities so
that labour and capital can be used more efficiently and flexibly.10 Globally, policy trends towards
transit‑oriented development are expected to continue with the aim of alleviating the impacts of urban
sprawl and congestion, such as lost productivity, social exclusion, emissions and health impacts.11
In Australia, governments still primarily own and finance road infrastructure and assets, with all three
levels of government raising revenue for transport-related activities.12 While there is only very limited
hypothecation of road-related revenue to road expenditure, the cost of building and maintaining our roads
is increasing at a rate faster than road-related revenue collected from motorists in taxes and charges.

5    Bureau of Infrastructure, Transport and Regional Economics (BITRE), 2015, Australia’s commuting distance: cities and regions, Information
     Sheet 73, Australian Government, Canberra
6    BITRE, 2015, Traffic and congestion cost trends for Australian capital cities, Information Sheet 74, Australian Government, Canberra
7    Based on BITRE data, analysis and projections
8    Based on BITRE data, analysis and projections
9    BITRE, 2016, Australian Sea Freight (unpublished data), Australian Government, Canberra
10   Department of Infrastructure and Regional Development, 2015, State of Australian Cities 2014–2015, Australian Government, Canberra
11   Tourism and Transport Forum, 2010, The benefits of transit oriented development, Tourism and Transport Forum, Sydney
12   Constitutional responsibility for road infrastructure provision lies primarily with state, territory and local government

                                                                                Department of Infrastructure and Regional Development > 5
Trends > Transport and Australia’s Development to 2040 and Beyond

Regional development
Australia has diverse regions with differing opportunities and challenges.
The Australian population as a whole is ageing and this will have a greater impact in regional Australia.
Not only is the portion of people aged 65 and over increasing faster in regions than our capital cities,
but this increase in ageing populations will be more difficult to support in regional Australia. The smaller
populations and longer distances make services and transport options more difficult to fund and provide.
It is also more difficult for people in regional Australia to achieve the same labour market outcomes when
compared to their major city counterparts. The differences in regional labour market disadvantage can
be attributed to a number of factors including a region’s access to higher education, industry diversity,
transport networks and the skill level of its labour force.
Although the services sector is now Australia’s major employer in both regional and urban areas, it is
estimated that 44 per cent of Australian jobs are potentially at high risk of automation. However, job losses
are expected to be somewhat offset by new jobs generated by emerging technologies.13
In the coming decades, regional Australia will continue to experience a number of challenges relating to
its demographic and industry structure. However, many opportunities lie in improving the connectivity of
regions through transport and communications infrastructure to facilitate access to jobs of the future.
Fostering innovation and embracing opportunities based on trends in the transport sector will provide
economic growth and productivity gains, allowing Australia to continue to prosper in the years up to
2040 and beyond.

13   Hajkowicz, Reeson, Rudd, Bratanova, Hodgers, Mason and Boughen, 2016, Tomorrow’s digitally enabled workforce: megatrends and scenarios
     for jobs and employment in Australia over the coming 20 years (Megatrends), CSIRO

6 > Department of Infrastructure and Regional Development
Trends > Transport and Australia’s Development to 2040 and Beyond

ECONOMIC CONTEXT

Since the turn of the century, the world economy has seen many changes including an increased focus on
security, a global financial crisis and rapid economic growth in Asia (Figure 1.1). This growth reflects the
rapid industrialisation of the Chinese and Indian economies in particular, which led to a sharp increase in
the demand for commodities to feed their expanding manufacturing sector and a consequential sharp rise
in commodity prices. Australia’s mineral wealth and geographic proximity to the Asia–Pacific region enabled
our economy to participate in this growth.

Figure 1.1: Annual GDP Index, selected countries
                        400

                        350

                        300
Index base 2000 = 100

                        250

                        200

                        150

                        100
                             00

                                           02

                                                  03

                                                         04

                                                                05

                                                                       06

                                                                                       08

                                                                                                09
                                    01

                                                                                                                     12

                                                                                                                            13
                                                                                07

                                                                                                              11
                                                                                                       10

                                                                                                                                   14
                                                                                                     20

                                                                                                                                 20
                                                                             20

                                                                                                            20

                                                                                                                          20
                                  20

                                                                                                                   20
                           20

                                         20

                                                20

                                                       20

                                                              20

                                                                     20

                                                                                     20

                                                                                              20

                                                           World        China         India           Australia

Source: World Bank 2015, World Development Indicators.

This demand for commodities was particularly evident to Australia’s iron ore producers. Over the three
years to 2014–15, iron ores and concentrates were Australia’s largest export by value, accounting
for around a third of all goods and services exports.14 Although there was a sharp increase in capital
expenditure at mine sites and freight linkages to ports over the five years to 2012, the long timelines
involved in constructing new infrastructure contributed to a substantial lag between commodity price
rises and increases in production (see Figure 1.2). For example, work on the Roy Hill iron ore project in the
Pilbara region of Western Australia began in 2011 and made its first shipment in December 2015.

14                      Department of Foreign Affairs and Trade, 2015, Australia’s trade in goods and services 2014–15, Australian Government, Canberra

                                                                                                     Department of Infrastructure and Regional Development > 7
Trends > Transport and Australia’s Development to 2040 and Beyond

Figure 1.2: Australian iron ore production and price
                 900                                                                                                                      160

                 800                                                                                                                      140

                 700
                                                                                                                                          120

                 600
                                                                                                                                          100
Million tonnes

                                                                                                                                                $A per tonne
                 500
                                                                                                                                          80
                 400
                                                                                                                                          60
                 300

                                                                                                                                          40
                 200

                 100                                                                                                                      20

                   0                                                                                                                      0
                       00

                                   02

                                          03

                                                 04

                                                         05

                                                                06

                                                                                  08

                                                                                       09
                            01

                                                                                                              12

                                                                                                                     13
                                                                        07

                                                                                                      11

                                                                                                                                    15
                                                                                              10

                                                                                                                             14
                                                                                            20

                                                                                                                           20
                                                                      20

                                                                                                    20

                                                                                                                                  20
                                                                                                                   20
                            20

                                                                                                            20
                   20

                                 20

                                        20

                                               20

                                                       20

                                                              20

                                                                             20

                                                                                       20

                             Iron Ore Production (for steel making – left axis)         Iron Ore Price (export unit value – right axis)

Source: Department of Industry, Innovation and Science, Resources and Energy Quarterly, and Australian Bureau of Agricultural and Resource
        Economics and Sciences (ABARES), Australian Commodity Statistics.

It is to be expected that commodity prices would rise dramatically in a short-term response to increased
demand, but then subside as production levels increase to meet this demand. Iron ore prices have eased
since the peak in 2010–11, reflecting both substantial increases in global supply as capacity expansions
come on line in Australia and Brazil, and an easing in demand growth, especially from Asia. While
commodity prices are significantly lower than the peaks of a few years ago, production has continued to
grow as new mining projects come on line. As mining industry construction projects conclude and the
industry moves from a construction phase to a production phase, the mining workforce will change from
a large construction-based workforce to a smaller production-based workforce, resulting in significant
structural changes for affected regions.
The significant increase in the value of commodity exports led to a strengthening of the Australian currency
through to 2011–12. While this resulted in more affordable imported consumer products, it also led to
lower returns to other Australian exporters or import-competing industries. As mines expanded their output
and commodity prices eased, the exchange rate also eased to somewhere closer to its long-term average
(see Figure 1.3).

8 > Department of Infrastructure and Regional Development
Trends > Transport and Australia’s Development to 2040 and Beyond
Figure 1.3: Change in value of AUD relative to USD (USD per 1 AUD)
1.15
1.05
0.95
USD per 1 AUD
0.85
0.75
0.65
0.55
0.45
00
02
03
04
05
06
08
09
01
12
13
07
11
15
10
14
16
20
20
20
20
20
20
20
20
20
20
20
20
20
20
20
20
20
Source: Reserve Bank of Australia 2016, monthly historical exchange rates, FXRUSD.
Low interest rates and the decline in the exchange rate since early 2013 have contributed to rebalancing
the economy towards the non-resource sectors. The lower Australian dollar means that our exports are
relatively cheaper and therefore more competitive internationally. This has led to greater opportunities
in service sector exports particularly tourism and education, which grew at 4.1 per cent and 9.2 per cent
respectively from 2012–13 to 2013–14.15
East Asia now accounts for about one quarter of Australia’s business service exports and almost half of
travel service exports. Around half of international students in Australia come from East Asia, and another
ten per cent or so come from India.16
Looking forward, Australia will benefit from the rising per capita incomes of Asian countries, with Asia
predicted to account for 66 per cent of the global middle-class population by 2030.17 This, coupled
with ageing demographics in Asia, will lead to an increased demand for education, tourism and
financial services.
15 Department of Foreign Affairs and Trade, 2015, Australia’s trade in goods and services 2014–15, Australian Government, Canberra
16 Reserve Bank of Australia, 2016, May statement on monetary policy, Sydney
17 Pezzini, M, 2012, An emerging middle class, Organisation for Economic Co-operation and Development
Department of Infrastructure and Regional Development > 9Trends > Transport and Australia’s Development to 2040 and Beyond
Australia’s increased freight task and growing population will need additional infrastructure. However
while the Australian economy weathered the Global Financial Crisis better than most developed nations,
successive Australian Government deficits have led to net debt of $242 billion as at June 201518
(see Figure 1.4). This is not considered sustainable in the long-term. Australia needs to develop
innovative ways to generate more transport infrastructure capacity with less Australian Government
funding, either by using different funding methods, through land transport market reforms or by
embracing technologies that maximise the benefits we receive from our current infrastructure.
Figure 1.4: Australian Government net debt to GDP ratio
20
Current ratio at 15.1% in 2015
15
Debt as a per cent of GDP
10
5
Lowest ratio -4.6% in 2008
Debt
0
Assets
-5
00
02
03
04
05
06
08
09
01
12
13
07
11
10
14
15
20
20
20
20
20
20
20
20
20
20
20
20
20
20
20
20
Source: Australian Bureau of Statistics (ABS), 2016, Government finance statistics, Australia, 2014–15, Catalogue number 5512.0, ABS, Canberra, and
ABS, 2016, Australian national accounts: national income, expenditure and product, Dec 2015, Catalogue number 5206.0, ABS, Canberra.
18 Australian Bureau of Statistics, 2016, Government finance statistics, Australia, 2014–15, Catalogue number 5512.0, ABS, Canberra
10 > Department of Infrastructure and Regional DevelopmentTrends > Transport and Australia’s Development to 2040 and Beyond
INNOVATION AND DISRUPTION
Technology: exponential opportunities
The future of transport and infrastructure in Australia is perhaps best viewed through the lens of a smart
phone, rather than a crystal ball. The ‘Internet of Things’ is changing the way we connect and interact with
the world around us. It is driving new business models like sharing economies (such as Uber) and bringing
consumers who demand higher or customised services into previously stable markets. This connectedness
is accompanied by growth in robotics and automation, advanced analytics, drones, and 3D printing.
Such so-called ‘disruptive’ technologies are transforming how we use transport and the way we interact
with infrastructure, bringing exponential opportunities as well as some significant challenges.
Technological advances are fundamentally changing the design and operation of Australia’s transport
systems. They are reducing the cost of new infrastructure, improving the efficiency in the use of existing
infrastructure, and improving road safety and freight efficiency. For example, low-cost, internet connected
sensors being deployed in smart phones and fixed infrastructure like street lights provide access to better
real-time traffic data, and can be used to optimise planning and road management activities.
On the Sydney Harbour Bridge, sensors and sophisticated data analytics are being used to predict
maintenance problems before they occur, reducing costs and disruptions to users.19
Vehicle technology is shifting toward more sophisticated automation – from autonomous emergency
braking and advanced speed control to fully automated operation. Vehicles are also increasingly connected
through wireless communication to real-time safety messages between vehicles or infrastructure.
The potential benefits of such features include improved safety, efficiency, environmental outcomes,
and traveller convenience. Fully automated vehicles could also improve mobility for people with disability,
the young and elderly, free up parking space for urban redevelopment and reduce infrastructure costs.
Upper bound projections indicate that shared automated vehicles (combined with a high capacity public
transport network) could reduce the size of the national vehicle road fleet by as much as 90 per cent.
In contrast, lower bound projections indicate that mixing shared automated vehicles with conventional cars
(combined with a low capacity public transport network) could result in up to seven per cent more cars
being required to provide the same level of service. These results suggest that shared automated fleets
may face some transition issues in the presence of legacy fleets.20
To realise the potential benefits and manage any transition complications, policy makers will need to
facilitate the uptake of this technology by revisiting regulatory models, removing barriers, facilitating
improved enabling services such as positioning or mapping, and addressing potential risks, such as
cyber security.
19 National ICT Australia, 2014, NICTA response to the public infrastructure, Productivity Commission issues paper and draft report, NICTA, Sydney
20 International Transport Forum, 2014, Urban mobility: systems upgrade, International Transport Forum and Corporate Partnership Board, Paris
Department of Infrastructure and Regional Development > 11Trends > Transport and Australia’s Development to 2040 and Beyond Outside of the public realm, mining and defence facilities already employ fully automated technology. Interest among road operators is rising – South Australia hosted the first demonstration of a highly automated vehicle on a public road in the Southern Hemisphere in November 2015. Further demonstrations and trials are planned by industry and state governments, and fully driverless vehicles may enter the market in the period 2020–2030 (although it could be 2035–2040 before a significant proportion of vehicles are fully automated). Integration with other technologies such as vehicle‑to-vehicle communications, electrification and ride-sharing could dramatically improve the performance of Australia’s transport networks. Automated vehicles may disrupt or complement other transport options like light rail, taxis and traditional bus services – especially in delivering first-and-last mile services.21 Automation is forging ahead in other modes too. Sydney Metro’s Northwest rail project will provide Australia’s first fully automated rail lines from 2019. Advancements in robotics have improved operations efficiency and safety at the Port of Brisbane and Port Botany.22 Business models are likely to change significantly as a result of automation and other technological changes. The logistics industry will be impacted by disruptive technologies. As additive manufacturing (3D printing) takes off, logistics and manufacturing are converging.23 Car parts can now be produced in the workshop, rather than ordering them in from elsewhere.24 Logistics innovators see disruptive technologies as a part of business. In 2015 Amazon filed patents for a 3D printing delivery truck, gained approval for drone delivery trials, and launched its Flex service – a sharing economy model allowing participants to deliver for Amazon, monetising their vehicle and smartphone ownership. Sharing economy platforms are creating opportunities and productivity benefits while agitating previously sedentary markets. Services such as Uber are challenging existing regulatory structures, spurring innovation, and transforming community expectations. As technology continues to lower transaction costs, such services are now established consumer alternatives to traditional services.25 In this transition, new consumers and competitors may hold concerns on how sharing platforms operate, however, the productivity benefits may override these in the long-term.26 21 Department of Transport, 2015, Pathways: connecting Canada’s transportation system to the world, Canadian Government, Canada 22 Saulwick, J, 2015, ‘Sydney’s Patrick terminal goes automated, with fewer staff but dancing robots’, Sydney Morning Herald, June 18 23 Halterman, T, 2015, ‘German shipping giant, TNT is working to integrate 3D printing into supply chain’, 3D Printing, May 22 24 Karena, C, 2013, ‘3D printing on the road to motoring spare parts’, Sydney Morning Herald, November 26 25 Chan, ND and Shaheen, SA, 2011, ‘Ridesharing in North America: past, present, and future’, Transport reviews, vol. 32, no. 1, pp. 93–112. 26 Frey, T, 2014, ‘The disruptive nature of the sharing economy: finding the next great opportunities’, Futurist Speaker 12 > Department of Infrastructure and Regional Development
Trends > Transport and Australia’s Development to 2040 and Beyond

Technology will be a key enabler for Australia to meet its rising demands for infrastructure and transport.
The challenge for government is to facilitate technological transformation, while ensuring safety outcomes
are achieved.

Big Data
Ninety per cent of digital data was created over the two years 2014 and 2015. It is growing by
2.5 quintillion bytes daily27 (that’s roughly equivalent to over half a billion HD movie downloads28),
expanding from the explosion in social media and mobile connectivity, and ubiquitous embedded sensors
and devices. The digital world is growing at an exponential pace from two billion objects in 2006 to a
projected 200 billion by 2020.29 Today’s cars run on around 100 million lines of code and produce up to
25 gigabytes of data an hour.30
Big Data can provide accurate, rapid and comprehensive information to inform transport and infrastructure
use, promoting productivity. Such analytics can address urban issues of waste management, transport
and traffic congestion. The infrastructure and transport sectors are already harnessing this information.
In Stockholm, for example, traffic data from GPS systems in taxis is analysed to provide online journey
planners by creating forecasts based on historical data, while at the same time building long-term
visualisation tools for use by policy makers and traffic planners. The project has reduced congestion,
resulting in commuter times falling by 20 per cent and vehicle emissions by 10 per cent.31 In aviation,
data is being used to improve flight performance, cut turbulence, improve safety and identify engine
defects 2,000 times faster than before.32
Data streams from public transport usage, route mapping, GPS/satellite tracking and road-side sensor
technologies continue to support33 real time route suggestions, active traffic network management and
regulatory or revenue collection applications.
Data can also optimise transport networks and infrastructure maintenance. Freight and passenger flows
can be mapped in real-time, using data from phones, video, toll-roads and navigation systems. This can
identify where infrastructure is under stress and enable investment to prevent problems arising as well as
focusing investment on areas of greater benefit, for example to address congestion on high-use bridges or
aiding the flow of traffic in and around ports.34
While some concerns on data use relate to legal, privacy, safety and intellectual property issues, perhaps
the most acute obstacle relates to skills and capacity. CSIRO sees Big Data analysis developing into a
profession of specialists across sectors, conversant with machine learning, automation, cyber security,
encryption and cloud computing.35 With 44 per cent of Australian jobs at high risk of automation,36
the transport sector will need to adapt37 and build new skills.

27   IBM, 2015, Bringing big data to the enterprise, IBM
28   PC Advisor, 2013 ‘What is Big Data? Understanding Big Data, and how it affects us all’ PC Advisor
29   Intel, 2016, A guide to the internet of things, Intel
30   Mckinsey & Company, 2014, What’s driving the connected car, Mckinsey & Company
31   IBM, 2010, IBM helps city of Stockholm predict better commuting options, IBM
32   CSO, 2015, BSA’s “What’s the big deal with data?” report illustrates worldwide impact of data revolution
33   Schimbinschi, F, Nguyen, X.V, Bailey, J, Leckie, C, Vu, H, and Kotagiri, R, 2015, ‘Traffic forecasting in complex urban networks: leveraging Big
     Data and machine learning’ in Proceedings of the 2015 IEEE International Conference on Big Data, Santa Clara, United States of America,
     29 October –1 November
34   Fitzpatrick, R, 2015, ‘On the road: research can improve transport across Australia’, The Conversation, 9 July 2015; Casserly, M, 2013, ‘What is
     big data’ PC Adviser, 24 April 2013; CSC, 2012, ‘Big Data universe beginning to explode’, CSC
35   Hajkowicz, Reeson, Rudd, Bratanova, Hodgers, Mason and Boughen, 2016, Tomorrow’s digitally enabled workforce: megatrends and scenarios
     for jobs and employment in Australia over the coming 20 years (Megatrends), CSIRO
36   Hajkowicz, Reeson, Rudd, Bratanova, Hodgers, Mason and Boughen, 2016, Tomorrow’s digitally enabled workforce: megatrends and scenarios
     for jobs and employment in Australia over the coming 20 years (Megatrends), CSIRO
37   Cully, M, 2015, Industry and workforce futures, State of the Nation Conference, Department of Industry and Science, Canberra

                                                                                Department of Infrastructure and Regional Development > 13
Trends > Transport and Australia’s Development to 2040 and Beyond
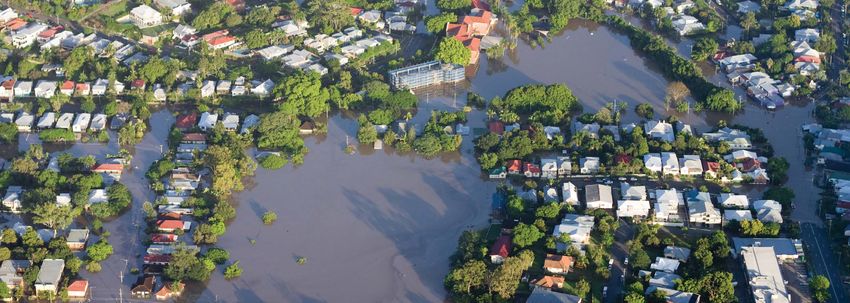
Extreme weather
The disruptive impacts of natural disasters often result in large-scale expenditure by the Australian Government,
state and territory governments on disaster relief, recovery assistance and infrastructure restoration.
In 2011, all jurisdictions, except the Northern Territory and Tasmania, had well-developed commercial
insurance arrangements to protect their non-road assets. However, there remains a significant gap in the
insurance of road assets, which are generally uninsured. The ACT and Victorian governments maintain
commercial insurance policies for their roads, demonstrating that cover is available in some circumstances
(refer to Table 2.1 below).38
Table 2.1: Insurance arrangements of states, 2011
ACT NSW NT QLD SA TAS VIC WA
Non-roads ü ü û ü ü û ü ü
Roads ü û û û û û ü û
Terrorism û ü û ü û û û ü
Source: Department of Finance and Deregulation, Review of insurance arrangements of state and territory governments under the Natural Disaster
Relief and Recovery arrangements determination 2011 Phase 1 Report.
Infrastructure assets are susceptible to the impacts of changing weather patterns.39 There has been
a general upward trend in insurance losses, with these increasing significantly between 2007 and
2010 as shown in Figure 2.1.
38 Department of Finance and Deregulation, 2012, Review of insurance arrangements of state and territory governments under the Natural
Disaster Relief and Recovery Arrangements Determination 2011 Phase 1 Report, Australian Government, Canberra
39 Department of Industry, Innovation, Climate Change, Science, Research and Tertiary Education, 2013, Climate adaptation outlook, Australian
Government, Canberra
14 > Department of Infrastructure and Regional DevelopmentTrends > Transport and Australia’s Development to 2040 and Beyond
Figure 2.1: Insurance losses from natural disasters
9,000
Cyclone Tracy,
8,000 Brisbane floods
7,000
6,000
5,000 Sydney Queensland
(AUD$m)
hailstorms floods
4,000 Newcastle
earthquake
Black Saturday
3,000 bushfires
Ash Wednesday
bushfires
2,000
1,000
003
05
09
67
69
83
85
89
93
95
99
01
13
81
87
91
15
07
11
73
75
79
97
77
71
19
19
20
20
20
20
19
19
19
19
20
19
19
19
20
20
20
19
19
19
19
19
19
19
19
2011 Normalised cost
Source: ICA (2014e), ICA Data Globe 2016 and Productivity Commission, 2014, Natural Disaster Funding Arrangements, Australian Government.
Changes in climate and extreme weather events are not only capable of causing direct damage to
infrastructure assets, but can also cause operational disruptions with flow-on financial, economic and
logistical consequences.40
Given the likelihood of climate variability having increasing impacts on insurance losses, the mitigation of
and adaptation to climate impacts should be considered in future infrastructure investments.
Higher average temperatures will accelerate damage to roads and track buckling in the rail network, further
adding to already rising costs. Elevated levels of carbon dioxide in the atmosphere also have the potential
to accelerate deterioration of concrete. Overall, infrastructure developers and managers will increasingly
need to consider Australia’s climate change adaptation to ensure adequate provision is made for system
resilience—approaches that minimise the consequences of asset and service failure across the range of
likely climate scenarios while considering the cost of providing resilient infrastructure.41
40 Productivity Commission, 2014, Natural Disaster Funding Arrangements, Inquiry Report no. 74, Canberra
41 Organisation for Economic Co-operation and Development/International Transport Forum, 2015, Adapting transport infrastructure to climate
change, OECD/ITF, Paris
Department of Infrastructure and Regional Development > 15Trends > Transport and Australia’s Development to 2040 and Beyond
Energy and emissions
Transport energy use and carbon dioxide (CO2) emissions are closely linked, as carbon-intensive fossil fuels
are the main fuel used across the transport sector.
Australia is the world’s 13th largest emitter of overall greenhouse gas emissions, producing 1.3 per cent
of global emissions.42 In 2013–14, domestic transport accounted for around 17 per cent of Australia’s
greenhouse gas emissions, with approximately 60 per cent of this attributable to light vehicles.
From 2013–14 to 2029–30, transport emissions are projected to increase by 25 per cent.43 Passenger
vehicles will remain the largest contributor, but emissions from civil aviation, light and heavy commercial
road vehicles and rail are expected to grow at a faster rate.44
Similarly, strong global growth is also projected for transport emissions. For instance, CO2 emissions from
maritime transport in 2050 are projected to be between 50 and 250 per cent higher than current levels.45
This indicates that by 2050 international shipping emissions could represent between six and 14 per cent of
total global emissions.46
Australia currently has the eighth highest national transport emissions in the OECD and trends indicate this
is likely to continue.47 The average emissions intensity for new passenger vehicles in Australia in 2014 was
43 per cent higher than the European Union average due to differences in the transport task, consumer
preferences and policy settings.48
Noxious emissions (such as oxides of nitrogen and particulates) from road vehicles will continue to have an
impact on air quality and public health in Australian cities. While air quality in our cities is good by international
standards, noxious emissions from road vehicles will continue to remain a concern for regulators. International
developments, such as a shift to gasoline direct injection technology, the alleged use of ‘defeat devices’ by
the Volkswagen Group and recent findings by the United Kingdom and Germany of a significant difference
in ‘tested’ and ‘on-road’ emission levels for diesel vehicles more generally, suggests that further changes to
noxious emission standards (to reduce emission limits and improve the integrity of the testing regime) will be
necessary to minimise any adverse health impacts from changes in the vehicle fleet.
42 Climate Change Authority, 2015, Australia’s climate policy options – special review – second draft report, Australian Government, Canberra
43 Department of the Environment, 2015, Australia’s emissions projections 2014–15, Australian Government, Canberra
44 Bureau of Infrastructure, Transport and Regional Economics, 2009, Greenhouse gas emissions from Australian transport: projections to 2020,
Working Paper 73, Australian Government, Canberra
45 International Transport Forum, 2015, Shipping and climate change: where are we and which way forward?, ITF
46 International Maritime Organization, 2014, Third greenhouse gas study 2014, IMO, London
47 Organisation for Economic Co-operation and Development/International Transport Forum , 2014, ‘Greenhouse gas emissions database’, OECD, Paris
48 National Transport Commission, 2016, Carbon dioxide emissions intensity for new Australian light vehicles 2015 – Information Paper, Australian
Government, Canberra
16 > Department of Infrastructure and Regional DevelopmentTrends > Transport and Australia’s Development to 2040 and Beyond
Fuel efficiency and emissions reduction
Advancements in technology are being used to increase fuel efficiency and reduce emissions.
With Australia committing to reduce greenhouse gas emissions by 26 to 28 per cent on 2005 levels by
2030, and other countries adopting new targets to reduce greenhouse gas emission levels further, the
adoption of improved fuel efficiency and cleaner forms of fuel is expected to increase over coming decades.
Global initiatives favouring low-carbon transport are gaining momentum in developed economies, including
the increased use of electric vehicles and alternative aviation fuels.
In the road transport sector, emissions can be reduced through changes to vehicle design such as
greater use of light-weight materials and improvements to transmissions and engine management
systems. There are also technologies that can provide real-time feedback to encourage more efficient
driving practices.
Manufacturers are developing hydrogen fuel cell vehicles and are continuing to improve the battery life of
other electric and plug-in hybrid vehicles to increase the distance travelled before refuelling/recharging is
required. These measures, and the reducing costs of technology, will improve the viability of these vehicles
as alternative options for consumers.
In the aviation sector, environmental performance has improved dramatically since the early 1990s
through technological innovation and operational changes, including improved fuel efficiency, the use of
voluntary carbon offset schemes and the uptake of alternative fuels. In Australia, most new and some older
aircraft are now fitted with navigation systems that use satellite-assisted guidance to fly with a high degree
of accuracy, and with only a small variation in the actual routes flown from one aircraft to another. The
International Civil Aviation Organization (ICAO) is also aiming to reduce emissions from international civil
aviation by two per cent a year until 2050, and obtain carbon-neutral growth from 2020.49
In the maritime sector, a number of domestic shipping companies are converting vessels to use new
liquefied natural gas fuels, resulting in a significant reduction in CO2 emissions.
Domestically in the maritime sector, the Energy Efficiency Design Index (EEDI) has been established to
improve energy efficiency for ships built from 2013. Under this regulation—and provided that the required
energy efficiency level is attained—ship designers are free to use the most cost-effective solutions. The
EEDI standards will be phased in from 2013 to 2025.
It will be important to harmonise Australian and international vehicle emission standards to ensure
Australia can take advantage of the latest technologies to reduce emissions.
There is yet to be international agreement on a standardised approach to measuring CO2 emissions from
heavy vehicles at a whole vehicle level due to the wider range of heavy vehicle configurations. This may
limit the potential to reduce heavy vehicle greenhouse gas emissions by direct regulation. However, further
regulatory reforms to encourage the uptake of more efficient and higher productivity vehicles (through
performance based standards) will help reduce greenhouse gas emissions from the heavy vehicle fleet.
49 International Civil Aviation Organization (ICAO), 2013, ICAO Assembly Resolution A38–18 on climate change, ICAO, Montreal
Department of Infrastructure and Regional Development > 17Trends > Transport and Australia’s Development to 2040 and Beyond
Further changes to international standards may lead to technological improvements that will be
incorporated into Australia’s domestic fleet. Electric and hydrogen-cell vehicles present both a challenge
and opportunity as they require new refuelling and recharging infrastructure.
Electric vehicles could allow users to recharge vehicles at home, and reforms to electricity pricing may
be required to ensure the electricity grid can use the latent battery storage capacity in managing any
consequential changes to demand. To effectively reduce greenhouse gas emissions, Australian
electric vehicles will need an electricity generation source that produces less than 600 tonnes of
CO2 per gigawatt‑hour. Current coal-fired plants produce approximately 1,000 tonnes of
CO2 per gigawatt‑hour. If a less emissions intensive source of electricity generation is not used,
Australia will not receive any greenhouse gas reduction benefits from electric vehicles.50
As with electric vehicles, any greenhouse gas reduction benefits from hydrogen fuel cell vehicles would
depend on how hydrogen fuel is produced. The US Department of Energy’s findings suggest that hydrogen
fuel produced by the most common method (natural gas reforming) would result in lower greenhouse gas
emissions relative to petrol vehicles.51
50 Pond, S, 2015, Low carbon transport on the move, The United States Studies Centre, Sydney
51 United States Department of Energy, 2016, Office of Energy Efficiency & Renewable Energy, Hydrogen production: natural gas reforming,
Washington
18 > Department of Infrastructure and Regional DevelopmentTrends > Transport and Australia’s Development to 2040 and Beyond
TRANSPORT AS A SERVICE
Services for people
Transport services connect people to jobs, their communities and essential services. In 2009–10, average
weekly household expenditure on transport related goods and services was $226.13, which accounted
for approximately 18.3 per cent of total household expenditure nationally. Average household expenditure
on transport has decreased from 16.3 per cent of total goods and services expenditure in 1984 to
15.6 per cent in 2009–10.52
In Australia, driving remains by far the preferred means of transport within capital cities accounting for
80 per cent of travel.53 Light passenger vehicles account for approximately 75 per cent of the vehicles
on our roads.54 The morning travel peak has increased in duration and sharpened in impact in the last
30 years, greatly increasing the pressure on urban transport networks. This appears to be driven in part by
an increase in discretionary travel in the morning peak period.55 The avoidable social costs of congestion
in the eight Australian capitals was estimated to be approximately $16.5 billion in the 2015 financial year
(in 2010 dollars), rising from about $12.8 billion in 2010. These costs are projected to rise further to about
$30 billion by 2030 in the absence of measures to cut congestion.56
One in eight people in Australian capital cities use public transport for daily commuting.57 After two
decades of decline, public transport patronage has increased since 1996. The largest increases in
mode share over this period were in Perth and Melbourne (both 2.2 percentage points) and Sydney
(2.1 percentage points).58
The increase in public transport patronage has occurred mainly on rail systems. In Australian capital cities,
65 per cent of kilometres travelled on public transport occur on heavy rail and 30 per cent on buses.
Light rail and ferries make up the remaining five per cent.59
Increases in public transport use are thought to be primarily the result of population growth rather than
modal shifts from the use of private vehicles. Light vehicle ownership and use will go through a series
of disruptions over the coming decades: the combination of autonomous vehicles and shared economy
models will likely change light vehicle usage patterns as well as ownership and service access models.
The impacts will also likely disrupt (positively or negatively) public transport service provision.
52 Australian Bureau of Statistics (ABS), 2010, Household Expenditure Survey, Catalogue number 6530.0, ABS, Canberra and ABS, 1984, Household
Expenditure Survey, Catalogue number 6530.0, ABS, Canberra. Note 2009–10 expenditure levels are based on transport related goods and services
within the transport and recreation groups, whereas the change in expenditure is based on the transport group.
53 Bureau of Infrastructure, Transport and Regional Economics (BITRE), 2015, Australian Infrastructure Statistics Yearbook 2015, Australian
Government, Canberra
54 ABS, 2015, Motor Vehicle Census, Australia, 31 Jan 2015, Catalogue number 9309.0, ABS, Canberra
55 Department of Infrastructure and Regional Development, 2012, State of Australian Cities 2012, Australian Government, Canberra
56 BITRE, 2015, Traffic and congestion cost trends for Australian capital cities, Information Sheet 74, BITRE, Australian Government, Canberra
57 BITRE, 2015, Australia’s commuting distance: cities and regions, Information Sheet 73, BITRE, Australian Government, Canberra
58 Mees, P and Groenhart 2012, Transport policy at the crossroads: travel to work in Australian capital cities 1976–2011, School of Global, Urban
and Social Studies, RMIT, Melbourne
59 BITRE, 2014, Urban public transport: updated trends, Information Sheet 59, Australian Government, Canberra
Department of Infrastructure and Regional Development > 19Trends > Transport and Australia’s Development to 2040 and Beyond Globally, passenger air transport has recorded unprecedented growth rates each year since 2010.60 In Australia, high levels of domestic and international passenger growth at major airports are already testing the capacity of airport infrastructure during peak periods. International air travel will grow strongly to 2030, with both domestic and international passenger movements through capital cities almost doubling. The largest growth at major airports is expected to occur on the Gold Coast (139 per cent), followed by Perth (135 per cent) and Darwin (127 per cent).61 In regional areas, the aviation sector is adjusting to the mining industry’s transition from a construction phase to the operational phase of production, which has seen a decline in the demand for fly-in fly-out services. In contrast, the lower Australian dollar has seen an increase in demand for services to tourism destinations. Most of the infrastructure that Australians will use in 2031 has already been built.62 Looking ahead, addressing service gaps and capacity constraints in transport services for people will remain a challenge in the face of growing and ageing populations and the corresponding pressures on government budgets. Australia must be smarter and open to new ways of providing transport services if we are to gain the greatest return on our existing investments, and ensure transport infrastructure is positioned to adapt to changing demands. Balancing public expectations with an increasing need for efficiency is also a growing challenge. This is particularly the case with the safety and security of transport services – both being fundamental concerns of governments and industry. While transport fatality rates have continued to decline due to improvements in infrastructure regulation, technology and industry practices, regulation is also becoming increasingly complex as business models and technology change rapidly. Security threats will remain for the foreseeable future, and like safety, the range of compliance activity and the tools required to ensure the system is secure has grown. Maintaining the balance between protecting the travellers from the impacts of security threats and responding to growth in demand for services will remain a major challenge for regulators and industry. 60 Organisation for Economic Co-operation and Development/International Transport Forum, 2015, ITF Transport Outlook 2015, OECD/ITF, Paris 61 Based on Bureau of Infrastructure, Transport and Regional Economics data, analysis and projections. 62 Infrastructure Australia, 2015, Australian infrastructure audit: our infrastructure challenges executive summary, Australian Government, Canberra 20 > Department of Infrastructure and Regional Development
Trends > Transport and Australia’s Development to 2040 and Beyond
Services for freight
Effective and competitive transport services are critical to Australia’s access to markets and to our
prosperity. World road freight volumes are growing strongly, driven by major manufacturing economies and
growing consumer markets such as China and India.63 Australia relies on its freight transport services to
connect us to world trade – from the farm gate through to our major ports and airports.
Australia’s national land freight task is expected to grow by around 75 per cent between 2011 and 2031.64
Over three quarters of Australia’s non-bulk freight is carried on roads,65 dominating freight movements
between Sydney, Melbourne, Brisbane and Adelaide.
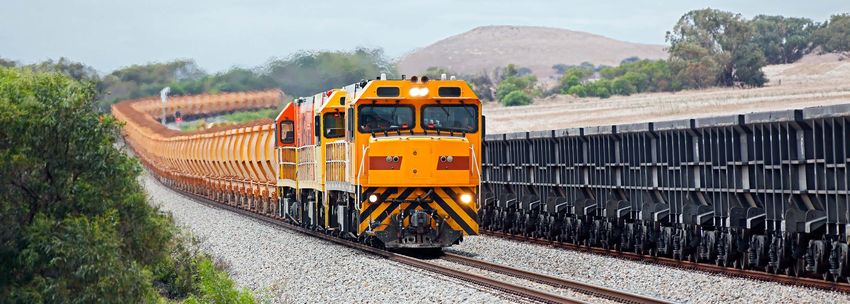
Australia’s rail networks also play a key role in meeting the national freight task and supporting the
economy. In 2013–14 freight rail carried 1.3 billion tonnes of freight and contributed approximately
$5.1 billion to the Australian economy.66 Of this volume, around 98 per cent was bulk freight (predominately
resource and agricultural export products to ports) and two per cent was intermodal freight (containerised
traffic). Rail dominates non-bulk freight movements between Perth and the eastern states.67
By 2040, rail freight is expected to increase above its 2010 level by 130 per cent, mainly due to continuing
expected (although somewhat subdued) growth in mineral exports.68 Automation such as driverless trains
will continue to extend into the rail sector, particularly rail freight.
Maritime transport plays an important role in Australia’s freight task through the movement of low cost,
bulk goods between ports. In 2011–12 domestic coastal shipping accounted for 17 per cent of Australia’s
total freight task (measured as billion tonnes per kilometre).69
Maritime transport also underpins Australia’s international trade. Over the past two decades port
throughput, as measured by containerised cargo, increased by between 159 to 453 per cent across the
five major Australian port terminals: Brisbane, Sydney, Melbourne, Adelaide and Fremantle.
The efficiency of ports and the transport infrastructure that links them to various markets is vital in
reducing import and export costs. Port productivity and efficiency has been driven by capital improvements,
including the expansion of existing terminals, new cranes and automation of stevedoring operations.
Wharf‑side and land-side indicators suggest little improvement in the productivity and efficiency
across Australia’s five major container ports since 2014. However, the historical trend has been regular
improvements in these indicators.70
Capacity expansions and asset maintenance are key challenges due to the dominance of maritime in
transporting Australia’s commodity exports. The sector will remain crucial to Australia seizing economic
opportunities in the decades ahead.
By value, air freight is a critical component of Australian international trade. Air freight will continue
to grow as demand for just-in-time delivery increases for items such as high value manufacturing and
mining products, perishables such as food, time urgent medical products and market flowers. Air freight
processing centres covering security, quarantine, customs and quality control will need to remain flexible to
keep pace with demand. Remotely piloted aircraft systems (or drones) are also likely to play an increasing
role in remote freight delivery, particularly for small items.
63 Organisation for Economic Co-operation and Development/International Transport Forum, 2015, ‘ITF transport outlook 2015’, OECD/ITF, Paris
64 Based on Bureau of Infrastructure, Transport and Regional Economics (BITRE) data, analysis and projections.
65 BITRE, 2015, Yearbook 2015: Australian infrastructure statistical report, Australian Government, Canberra
66 BITRE and Australasian Railway Association, 2015, Trainline 3: statistical report, Australian Government, Canberra
67 BITRE and Australasian Railway Association, 2014, Trainline 2: statistical report, Australian Government, Canberra
68 Based on modelling in BITRE, 2014, Freightline 1 – Australian freight transport overview, Australian Government, Canberra
69 BITRE, 2015, Yearbook 2015: Australian infrastructure statistical report, Australian Government, Canberra
70 BITRE, 2015, Waterline 57, Statistical Report, Australian Government, Canberra
Department of Infrastructure and Regional Development > 21You can also read