Foundation Report 2021 - Wellington Regional Growth ...
←
→
Page content transcription
If your browser does not render page correctly, please read the page content below
Foundation Report 2021

                  This is a joint local government, central government and Iwi project and will deliver a
                  30 year spatial plan for the region with a list of projects and investment requirements.

Wellington Regional Growth Framework |   1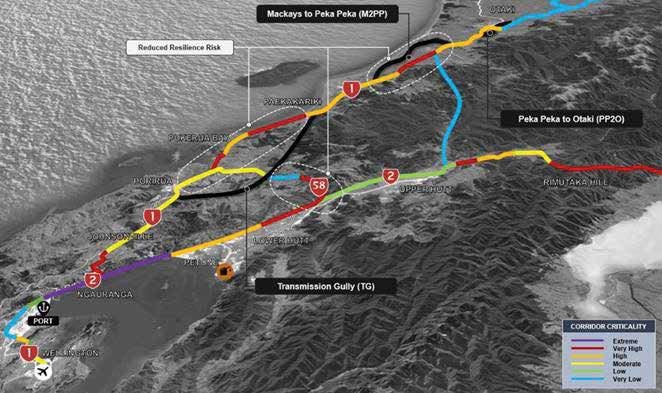
Introduction
Ka ora te wai            If the water is healthy            The process for developing the Framework included             Significant investment in housing, urban development,
Ka ora te whenua         the land will be nourished         developing and testing possible future scenarios for          transport and three waters infrastructure and services
                                                            the region over the next 30 to 100 years. It tested           as well as regional and district planning and policy
Ka ora te whenua         If the land is nourished
                                                            the need for significant infrastructure and other             changes will be needed to support future growth
Ka ora te tangata        the people will be provided for    investments and recommends a prioritised regional
                                                            programme of work, reflected in a regional spatial            Whilst the Framework is primarily a spatial plan that
Mo te iti - mo te rahi   For the little - for the large                                                                   describes a long-term vision for how the region will
                                                            plan, that will require joint action and investment.
                                                            This Foundation Report provides background for the            grow, change and respond to key urban development
                                                            Framework and outlines the challenges that need to be         challenges and opportunities, all of the above
                                                            addressed regionally.                                         challenges will need to be resolved for the future, not
This is the Foundation Report for the Wellington
                                                                                                                          just where and how to develop more housing.
Regional Growth Framework (the Framework). The
                                                            The region has an immediate issue relating to a lack
document outlines the context for the development of                                                                      These are regional issues that are best dealt with
                                                            of housing supply, a limited range of housing options
the Framework (a regional spatial plan) and identifies                                                                    together and not individually. Many of these issues
                                                            and declining housing affordability, particularly for first
the key challenges for growth in the region.                                                                              cross local council boundaries (e.g. investment in
                                                            home buyers.
                                                                                                                          water or transport), and maximum benefit can be
For the purpose of the Framework and this Foundation
                                                            Increasing numbers of vehicles on the roads, capacity         had from planning and investing in these together
Report the region includes the territorial authorities of
                                                            and reliability issues associated with buses and trains       and not individually and with central government
Masterton, Carterton, South Wairarapa, Upper Hutt,
                                                            and network resilience issues are straining the regional      and mana whenua. This work on the Framework
Lower Hutt, Wellington, Porirua, Kāpiti Coast and
                                                            transport system and may not result in the necessary          provides an opportunity to further build on established
Horowhenua. This project is a collaboration between
                                                            transport system shifts that we are seeking such as           relationships and partnerships with mana whenua of
these councils, the Greater Wellington Regional Council,
                                                            improving safety and access, reducing emissions and           the region.
central government and mana whenua of the region.
                                                            reducing reliance on private vehicle travel.
                                                                                                                          This Foundation Report is a key milestone in the
This report has been developed based on readily
                                                            Other issues facing the region include projected sea          Framework project. The project partners will continue
available data. Some parts of this report do not have
                                                            level rise, severity of weather events, environmental         to work collectively and with other stakeholders on
complete or consolidated information that extends
                                                            stewardship pressure and natural hazards. All of which        developing the Framework.
to Horowhenua (as it may be based on the Greater
                                                            are creating challenges as well as uncertainty.
Wellington Regional Council area).
                                                            Community infrastructure will also need more
                                                            coordinated investment to accommodate growth
                                                            including open spaces, community facilities, schools
                                                            and health care facilities.

                                                                  Wellington Regional Growth Framework |       2
Contents
Introduction........................................................................................................................... 2       Challenge 2: Impacts of natural hazards and climate change, improving
                                                                                                                                                resilience and enhancing the natural environment                                                                                      29
The Wellington Regional Growth Framework............................................................ 4                                          Natural Hazards and Climate Change                                                                                                    29
What is the Wellington Regional Growth Framework?                                                                                         4     Assets at Risk                                                                                                                        30
Why are we developing a Wellington Regional Growth Framework?                                                                             5     Natural Environment                                                                                                                   32
Who is developing the Wellington Regional Growth Framework?                                                                               6     Challenge 3: Inequitable access                                                                                                       34
Building on the Wellington Regional Investment Plan and links to current projects 7                                                             Inequitable Access                                                                                                                    34
Context.................................................................................................................................... 8   Access to Social Infrastructure                                                                                                       38
Tangata Whenua                                                                                                                            8     Access to educational opportunities                                                                                                   39
Development of the Region                                                                                                               10      Challenge 4: Mana whenua and Māori access to affordable housing                                                                       40
The Region Today                                                                                                                        11      Regional Profile                                                                                                                      40
Our People                                                                                                                              12      Why is poor access to housing a problem?                                                                                              41
Our Housing                                                                                                                             13      Housing development                                                                                                                   41
Our Economy                                                                                                                             15      Next Steps                                                                                                                            42
Our Transport System                                                                                                                    17      This Foundation Report                                                                                                                42
The Three Waters Infrastructure                                                                                                         20      Scenario Development                                                                                                                  44
Our Environment, Natural Hazards and Climate Change                                                                                     21      Shared Evidence Base – Technical Reports.............................................................. 45
Our Challenges. . .................................................................................................................. 23         Glossary................................................................................................................................ 47
Challenge 1: Lack of sufficient and affordable housing supply and choice,
investment needed in infrastructure                                                                                                     24
Housing – Affordability, Supply and Choice                                                                                              24
Enabling Three Waters Infrastructure                                                                                                    27
Enabling Transport Infrastructure                                                                                                       28

                                                                                                               Wellington Regional Growth Framework |                     3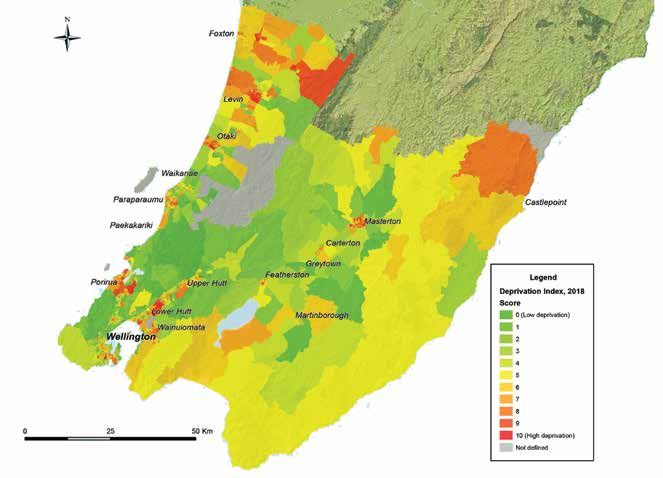
The Wellington Regional Growth Framework
What is the Wellington Regional Growth Framework?
The Wellington Regional Growth Framework (the              resilience and natural hazards. It seeks to reflect the   The phases of the Framework are shown below.
Framework) is a spatial plan that describes a long-        housing and urban development aspirations of mana
term vision for how the region will grow, change and       whenua in the region.                                     This Foundation Report completes the end of Phase
respond to key urban development challenges and                                                                      1 of the project. It sets out our regional context, our
opportunities in a way that gets the best outcomes and     It draws on and incorporates the local and regional       initial evidence base using existing data sources, our
maximises the benefits across the region.                  planning and engagement work on growth that has been      regional challenges, and presents the case for change.
                                                           undertaken already and is aligned with the Transport
It develops and tests possible future scenarios for the    Outcomes Framework and Government Policy Statement        Treaty of Waitangi obligations are upheld by the
region over the next 30 to 100 years. It tests the need    on Land Transport Funding, the National Policy            Framework. Active engagement and collaboration between
for significant infrastructure and other investments and   Statements on Urban Development and Freshwater            project partners has been central to the development
recommends a prioritised regional programme of work        Management, the proposed National Policy Statements       of the Framework. This includes a commitment to
that will require joint action and investment.             on Highly Productive Land and Biodiversity and the        actively engage with mana whenua in good faith and
                                                           Governments’ Urban Growth Agenda.                         with a commonality of purpose. The Framework seeks
The Framework identifies where areas for housing,                                                                    to reflect mana whenua perspectives and recognises
public transport and roads, three waters infrastructure     Central Government, councils from the region and mana    the special relationship that tangata whenua have with
(stormwater, wastewater and drinking water),                whenua have worked together to develop the Framework     the environment and their role as kaitiaki.
     Diagram
businesses  and1:  Phases
                 jobs,       of Wellington
                       are recommended         Regional
                                          in the context Growth
                                                            and build an enduring regional growth partnership.
     Framework
of issues such as housing affordability, climate change,

Diagram 1: Phases of Wellington Regional Growth Framework

                                                                                               PHASE 4
         PHASE 1                      PHASE 2                    PHASE 3
                                                                                              Finalise
        Develop                      Develop                    Develop
                                                                                              Growth
       Foundation                    Options                  draft Growth
                                                                                           Framework for
         Report                      Report                    Framework
                                                                                            consultation

                                                                 Wellington Regional Growth Framework
                                                                                             PHASE 4  |      4
         PHASE 1                      PHASE 2                    PHASE 3
                                                                                               Finalise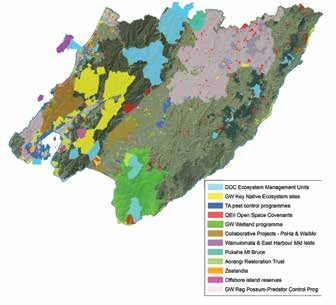
Why are We Developing a Wellington Regional Growth Framework?
The region is growing faster than it has done for many       Community infrastructure will also need more              the regional outcomes of Māori as Treaty partners. The
decades and is facing immediate and longer-term              coordinated investment to accommodate growth              Framework is committed to working with hapū and iwi
housing supply and affordability, urban development          including in open spaces, community facilities, schools   on the development of the spatial plan, following an
and infrastructure challenges.                               and health care facilities.                               established kaupapa and recognising tangata whenua
                                                                                                                       aspirations within the region.
The immediate issues relate to a lack of housing             All these challenges collectively will need to be
supply, a limited range of housing options and declining     resolved for the future, not just where and how to
housing affordability, particularly for first home buyers.   develop more housing. These are regional issues that                         PROJECT OBJECTIVES
Over the next 30 years between 52,000 and 66,000
                                                                                                                             1
                                                             are best dealt with together and not individually. Many                 Increase housing supply, and improve
new homes may be needed for between 91,000 and               of these challenges cross local council boundaries and                  housing affordability and choice
151,000 additional people across the region1. This is the    maximum benefit can be had from investing in these
equivalent of accommodating more than another Hutt           together and not individually. It is important that we                  Enable growth that protects and enhances
Valley of people and housing into the region.                have a region-wide approach and develop a partnership
                                                             between central government, local government and
                                                                                                                             2       the quality of the natural environment
                                                                                                                                     and accounts for a transition to a low/no
Significant investment in housing, urban development,        mana whenua to respond to our regional challenges so                    carbon future
transport and three waters infrastructure and services       that we can address community expectations.
                                                                                                                                     Improve multi-modal access to and
as well as regional and district planning and policy
changes will be needed to support future growth.             Central Government’s Urban Growth Agenda (UGA)
                                                                                                                             3       between housing, employment, education
                                                                                                                                     and services
                                                             requirements and its long-term outcomes for transport
Beyond the forecast population and dwelling growth           will also be met.                                                       Encourage sustainable, resilient and
there are a number of other challenges facing the region.
Projected sea level rise, severity of weather events,        Whilst local planning will continue to focus on local           4       affordable settlement patterns/urban
                                                                                                                                     form that make efficient use of existing
environmental stewardship pressures, barriers to mana        issues, regional collaboration on regional issues will                  infrastructure and resources
whenua in fulfilling their role as kaitiaki and natural      lead to a more effective and efficient result than each
hazards are creating challenges as well as uncertainty.      party planning separately. Mana whenua may want to                      Build climate change resilience and avoid
                                                             work across local and regional boundaries and this work         5       increasing the impacts and risks from
Increasing numbers of vehicles on the roads, capacity        provides an opportunity for leadership in this space.                   natural hazards
and reliability issues associated with buses and trains
and network resilience issues are straining the regional     The objectives sought from the Framework are to the             6       Create employment opportunities.
transport system and may not result in the necessary         side. These have been developed jointly by the project
transport system shifts that we are seeking such as          partners and reflect the particular needs for change
improving safety and access, reducing emissions and          in the region. These objectives are not intended to       1
                                                                                                                           A range of growth figures is provided based on ranges from
reducing reliance on private vehicle travel.                 override the Framework’s commitment to providing for          Statistics NZ data and the recently completed Housing and
                                                                                                                           Business Development Capacity Assessments

                                                                    Wellington Regional Growth Framework |   5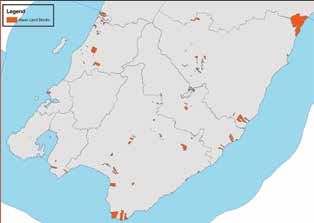
Who is Developing the Wellington Regional Growth Framework?
This project is a collaboration between central                     This project is an important opportunity for regional           (guardianship), Tō Mātou whakapono (judgement
government, the councils of the region and mana                     spatial planning to incorporate Te Ao Māori, and seeks          based on knowledge) and Mahitahi (partnership).
whenua as shown in the table below.                                 to create a Framework which is reflective of its Treaty
                                                                    partners. The project partners already work together, with      Through the development of this Framework we
We have worked with a range of central and local                    Ara Tahi, Te Upoko Taiao and the Whaitua committees an          operated, as we already do, by recognising the
government stakeholders during the development of                   example of this. The Framework seeks to build upon and          principles of the Treaty of Waitangi, supporting the
this Foundation Report.                                             strengthen these existing partnerships.                         role of mana whenua as kaitiaki, providing for the
                                                                                                                                    relationship of Māori with their ancestral lands, water
We continue to work with mana whenua during the                     A kaupapa informs the Framework to give life                    sites, waahi tapu and other taonga.
development of the Framework to enable mana                         to the project. The kaupapa reflects that already
whenua participation in the process and ensure mana                 adopted by Te Upoko Taiao; including Ki uta ki Tai
whenua views are incorporated in the Framework.                     (connectedness), Wairuatanga (identity), Kaitiakitanga

                    Local government                                     Central government lead partners2                                           Mana Whenua

                   Carterton District Council                            Ministry of Housing and Urban Development                      Ātiawa ki Whakarongotai Charitable Trust
            Greater Wellington Regional Council                         Waka Kotahi – New Zealand Transport Agency                              Muaūpoko Tribal Authority
                 Horowhenua District Council                                                                                                         Ngā Hapū o Ōtaki
                        Hutt City Council                                                                                            Ngāti Kahungunu ki Wairarapa Charitable Trust
                 Kāpiti Coast District Council                                                                                                 Ngāti Raukawa (Horowhenua)
                  Masterton District Council                                                                                              Port Nicholson Block Settlement Trust
                      Porirua City Council                                                                                                      Rangitāne Tū Mai Rā Trust
              South Wairarapa District Council                                                                                                 Te Runanga o Toa Rangātira
                    Upper Hutt City Council
                    Wellington City Council

2
    Other key central government agencies we have been working with on the Framework are Department of Internal Affairs, Ministry
    of Transport, Ministry for the Environment, Treasury, Kainga Ora and Ministry of Business, Innovation and Employment

                                                                           Wellington Regional Growth Framework |        6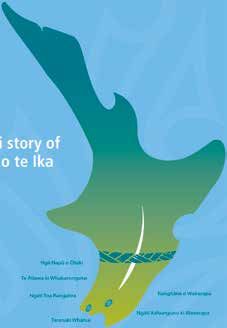
Building on the Wellington Regional Investment Plan and Links to
Current Projects
The Framework is the next stage in collaborative regional strategic planning        Diagram 2: Key Work Being Undertaken Relevant for this Framework
following the completion of the Wellington Regional Investment Plan (WRIP).
It is also developed in the context of other major urban development planning
and regional scale projects currently underway across the region.                       National      National Policy Statement on Urban Development,
                                                                                         policy       Freshwater Management, National Planning
The WRIP has been endorsed by the councils of the Wellington region3 and                planning      Standards, Urban Growth Agenda
identifies four areas for investment and partnership:

•     building a contemporary economy                                                    Local
                                                                                                      Planning for Growth, SWDC Spatial Planning, PCC District
                                                                                      government
•     developing new housing supply and urban form                                                    Plan Review, KCDC Review of Development Management
                                                                                        growth
                                                                                                      Strategy, UHCC residential and rural zone review
•     accessing opportunities through transport, and                                   planning

•     strengthening our resilience and reducing environmental impact.

It outlined investments already occurring and those that could be required             Transport      Regional Land Transport Plan, Regional Rail Plan,
over the next 30 years. The Framework builds on this and tests the                       work         Mode Shift Plan, Regional Public Transport Plan
investments identified in the WRIP.

In addition to the WRIP and existing mana whenua partnerships, a range
                                                                                       Significant    Let's Get Wellington Moving, RiverLink, Porirua East
of activities are currently being undertaken by the project partners that are                         Regeneration, Peka Peka to Ōtaki, Te Aru Tupua
                                                                                      Investments
relevant to the development of this Framework. This includes major region                             (Wellington to Hutt Valley Cycleway)
shaping housing, urban development and transport projects which are being
planned and/or delivered. Some examples are provided in the diagram below.
                                                                                          Iwi
                                                                                        housing       Ngāti Toa project with the Crown in Western Porirua,
                                                                                        projects      PNBST housing project in Wainuiomata

                                                                                         Other        Three Waters Review, council
                                                                                                      Long Term Plans, Wairarapa Housing Plan
3
    This work did not include the Horowhenua District Council

                                                                   Wellington Regional Growth Framework |   7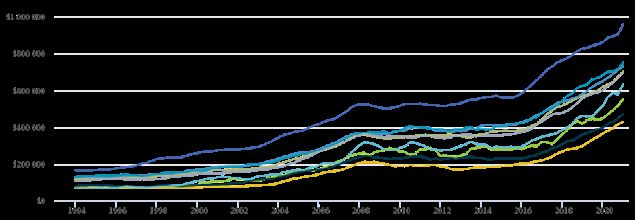
Context
This section of the report provides regional context for the Foundation Report, providing an overview of the characteristics of the region.

Tangata Whenua
Long before European settlers reached New Zealand’s          Diagram 3 Iwi ki Te Upoko o te Ika –                         Further north, before the 1820s the principal tribes of
shores, the region had been the ancestral home to            Iwi of the region                                            the Manawatu and Horowhenua region were Rangitāne,
generations of Māori tribes, with areas such as the                                                                       Muaūpoko and Ngāti Apa. Rangitāne were found
Wellington Harbour being the centre of local Māori life.                                                                  particularly in Manawatu, Muaūpoko in Horowhenua
                                                                                                                          and Ngāti Apa along the Rangitikei River.
Wellington’s earliest name, Te Upoko o Te Ika a Māui,
goes back to the Māori story of how Aotearoa New                                                                          By 1864, European settlement had resulted in the
Zealand was created. According to Māori, the legendary                                                                    alienation of the majority of Māori land in the region. Only
navigator Maui hooked a giant fish that, when pulled to                                                                   a small proportion of the region comprises Māori freehold
                                                                                                                          land today, and this this land predominantly located in rural
the surface, turned into the landform now known as the
                                                                                                                          areas. According to the Māori Land Court there are 12,529
North Island or Te Ika a Maui.
                                                                                                                          hectares of Māori Freehold Land, across 526 property
Wellington Harbour and Lake Wairarapa are referred                                                                        titles, in the Wellington region (not including Horowhenua).
to as the eyes of the fish (Ngā Whatu o te Ika a Maui).                                                                   This represents just 1.56% of land in the Wellington region.
Palliser Bay, on the south coast of the Wairarapa, is the                                                                 The Māori Land Court states that Māori Freehold Land
mouth of the fish (Te Waha o te Ika a Maui) and Cape                                                                      is land that has been investigated by the Māori Land
Palliser and Turakirae Head at either extreme of the                                                                      Court and a freehold order has been issued or was set
bay are the jaws. The Remutaka, Tararua and Ruahine                Muaūpoko Tribal                                        aside by the Crown as Māori freehold land and awarded
mountains make up the spine of the fish, as shown in                  Authority                                           by Crown Grants to specific individuals or has had the
the diagram.                                                                                                              status determined as Māori Freehold Land by order of
                                                                   Ngāti Raukawa                     Rangitāne o
                                                                                                                          the Māori Land Court. The first diagram overleaf shows
Modern archaeology has confirmed that sites found                                                     Wairarapa
                                                                  Ngā Hapū o Ōtaki                                        the Māori Freehold land blocks in the Wellington region.
in the Palliser Bay area of south Wairarapa, along the                                           Ngāti Kahungunu ki
                                                             Te Ātiawa ki Whakarongotai
southern Wellington coastline and on Kāpiti Island                                                   Wairarapa            Historical claims for breaches of the Treaty of Waitangi
are some of the oldest recorded sites in New Zealand,            Ngāti Toa Rangatira                                      by the Crown are addressed through the Treaty
dating back some 650 years.                                                                                               Settlement Process. Treaty settlements have provided
                                                                                 Taranaki Whānui                          financial, commercial and cultural redress to four of
                                                                                                                          the region’s Iwi:

                                                                   Wellington Regional Growth Framework |     8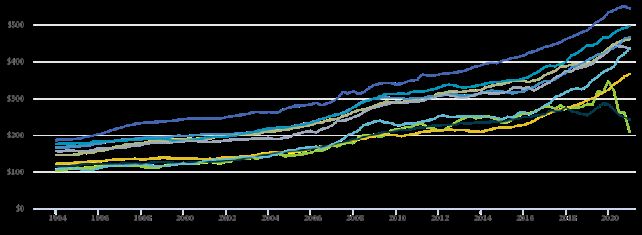
•   Taranaki Whānui ki Te Upoko o Te Ika in 2008,          Marae are a key feature of local Māori society being         Diagram 4 Map of Māori Freehold Land
•   Ngāti Raukawa in 2012,                                 a place where the Māori language is spoken, where            Blocks in the Wellington Region
                                                           customs are explored and debated, and where
•   Ngāti Toa Rangātira in 2012, and
                                                           important ceremonies, such as welcoming visitors,
•   Rangitāne o Wairarapa and Rangitāne o Tamaki           meeting inter-tribal obligations, or farewelling the dead
    Nui-ā-Rua in 2016.                                     are performed. The marae is a wāhi tapu, a 'sacred
                                                           place' which carries great cultural significance.
Ngāti Kahungunu ki Wairarapa initialled a Deed of
Settlement with the Crown in 2018. This was ratified       Within the region there are tribal marae (those that
by Iwi members in 2019 and is awaiting the conclusion      are linked to iwi/hapū/whānau through whakapapa),
of Waitangi Tribunal hearings before it can be signed.     urban marae (typically pan-tribal and serving the wider
Muaūpoko Tribal Authority, Te Ātiawa ki Whakarongotai      community) and institutional marae (those associated
Charitable Trust and Ngāti Raukawa ki te Tonga (Ngā Hapū   with places like education facilities, churches and
o Ōtaki) have not yet reached settlement with the Crown.   social service providers).

In 2018, 72,252 people or 16% of the population in the     Marae staff and others also undertake activity such as
Wellington region identified as being of Māori descent.    health and social services, training and education, assist
This was up from 13.9% in 2013.                            in public policy development and many provide civil
                                                           defence support.
                                                                                                                        Diagram 5: Mana Whenua and Mātāwaka
In 2018, 80,844 people or 16% of the population in
                                                           The second diagram to the right shows where mana             Marae in the Region
the Wellington region identified as being of Māori
descent. This was up from 25.8% in 2013.                   whenua marae and mātāwaka marae are located                                                                                 5 Marae Locations

                                                           through the region.
40.9%% of Māori adults in the region can speak
some te reo Māori. There are 44 Kōhanga Reo, Puna          The values of tangata whenua are important and
Reo, Māori immersion early education facilities and        include Whakapapa, Mauri, Kawa and Tikanga,
four Te Kura Kaupapa Tongarewa Māori schools in            Kaitiakitanga, Cultural Landscape, Mahinga Kai and
the region. While there has been an increase in the        Māori Customary Use.
proportion of the regional population able to speak te
                                                           The Framework is cognisant of Treaty partner iwi
reo since 2013, only 3.5% of census respondents for
                                                           management plans and recognises that mana whenua
the Wellington Region and 5.2% of census respondents
                                                           have their own aspirations; including for housing,
for Horowhenua identified as being able to hold an
                                                           education, protection of land, water and other taonga                                            Lower Hutt City
everyday conversation in te reo in 2018.                                                                                                                    Upper Hutt City
                                                           and economic opportunities.                                                                      Wellington City
                                                                                                                                                            Porirua City
                                                                                                                                                            Kāpiti Coast District
                                                                                                                         Mana whenua Marae                  Horowhenua District
                                                                                                                         Matāwaka Marae                     Masterton District
                                                                                                                         Land outside study area            Carterton District
                                                                                                                         Territorial authority boundaries   South Wairarapa District

                                                                  Wellington Regional Growth Framework |   9
Development of the Region
People have lived and prospered in this region since the The wider region has gone through a series of was a major commercial centre, with the headquarters
Polynesian explorer Kupe first discovered the area and stages of economic and urban development, over the of many of New Zealand’s largest companies, including
named many of its most prominent places including hundreds of years that people have lived and worked most banks, insurance companies, and oil companies.
Te Whanganui-a-Tara, and Mana, Matiu and Mākaro here. Much of the early development of the region From the 1960’s urban development to house workers
islands. For hundreds of years the region’s coastal was focused on or near the coast, major lakes and in these growing sectors, was primarily low density,
areas have played an important role as a link between rivers, with papakāinga, pā, and much later, whaling private vehicle oriented suburban housing, supported
Te Ika a Maui (the North Island) and Te Waipounamu settlements, and Wellington City in its first decades, all by investment in new motorways. Extensive new areas
(the South Island). Key coastal landmarks were used relying on water-based transport. of urban development opened up in the Hutt Valley and
by Māori to navigate across Cook Strait. This role at on its surrounding hills, on the Kāpiti Coast, around
the centre of New Zealand, continues through to today Later, the decision to move the capital to Wellington the Porirua Harbour and in the northern areas of
with the Cook Strait ferries providing important freight in 1865 provided the region with a significant urban Wellington City.
links between the two islands, and critical national and economic development boost. In the decades
telecommunications and electricity infrastructure following, railways were built from Wellington to the Following the economic reforms of the 1980s, the region’s
coming ashore on the region’s coast. Manawatu and Wairarapa, and settlements grew up economy changed dramatically. Almost all the region’s
along the railway lines in places such as Johnsonville, large-scale manufacturing closed down, and a significant
Since people first settled here, they have been aware Plimmerton, Paekakariki, Levin, Petone, Featherston number of corporate head offices left the region.
of the challenges and opportunities that its rugged and Masterton. A second wave of rail-focused urban
topography and complex geology and seismology development occurred following World War II, when
present to urban and economic development. Easily major state housing development occurred in Lower
developable flat land is limited in the southern, more Hutt and Tawa/Porirua.
urbanised parts of the region. And like many city-
regions on the rim of the Pacific (e.g. Santiago, San Throughout much of the 20th century the region was
Francisco, Vancouver, Portland, Tokyo, Osaka) this a major manufacturing centre, with textile/footwear
region is subject to seismic events (earthquakes and manufacturing focused in Levin, motor vehicle and
tsunami), requiring careful management and mitigation consumer products manufacturing in the Hutt Valley
as urban and economic development occurs. and Porirua, and food and beverage production in
Masterton. As well as being the capital, Wellington City
Wellington Regional Growth Framework | 10The Region Today
Today the region is an interdependent network of cities, towns and rural areas. It is Horowhenua District
Palmerston North
the seat of Government with an upbeat image, and an emerging centre for economic Kāpiti Coast District
enterprise, knowledge and skills, creative and cultural pursuits and lifestyle. It has a Porirua City
Wellington City
modern urban economy paired with a quality natural and social environment.
Hutt City
Upper Hutt City
Overall residents in the region enjoy a high quality of life relative to other parts South Wairarapa District
Levin
of New Zealand. In the 2018 Quality of Life survey, 88% reported that they had a Carterton District
good quality of life, while 3% expressed dissatisfaction. Masterton District
Otaki
Following a long period of transition, and concerted efforts to increase vibrancy,
the region is now growing strongly off the back of new industries. All parts of
Waikanae
the region are experiencing significant population growth, including regional
towns, many of which experienced long periods with little growth, following the Paraparaumu
Masterton
economic reforms.
Carterton
Much of the region has a constrained and challenging topography. This has to a large Greytown
Porirua
extent dictated urban development patterns and resulted in two main, north-south Featherston
Upper Hutt
urban development and movement corridors – with limited west-east connections. Tawa
Lower Hutt Martinborough
There are a number of statutory acknowledgement areas within the region, and a Johnsonville Petone
number of sites which have been vested to Iwi as part of their settlement redress; Wellington
including the Parangarahu Lakes, the Wellington harbour islands (Mātiu/Somes,
Makāro and Mokopuna) and Kāpiti Island. Some areas of the region are covered
by co-management arrangements between mana whenua and government
agencies; such as Whitireia Park and the Wairarapa Moana and Ruamāhanga
River catchment.
Large areas of the region are protected in Department of Conservation and
Regional Council parkland. These provide opportunities for recreation and in
many parts of the region they also contain and frame the region’s housing and As the home of the Capital the region is important to New Zealand as a whole,
urban development current and future footprint. The Wairarapa and Horowhenua and as an international partner and connector. There are other significant
also contain important areas of highly productive land, where the balance challenges emerging as regional growth accelerates, that will require joint local
between primary production and urban development will need to be determined government, central government and mana whenua leadership.
into the future.
Wellington Regional Growth Framework | 11Our People
The population of the region has grown steadily over This growth is being driven by national migration consistent across the region (between 21% and 24% within
the last 20 plus years. The current population of the trends into New Zealand and movement of people from all areas), compared to the current spread of 21% to 30%.
region is 578,1004 compared to 457,6905 in 1996. other parts of New Zealand into the region. This is
contributing to serious housing supply and affordability The diagram below shows ethnicity demographic
In recent years the population of the region has challenges for the region. information about people currently living in the region and
grown at a faster rate (1.4% pa since 2013). After a the projected change through to 2038. This projection
long period where population growth was primarily Demographic projections show that the population in shows that 20% of people in the region will identify as
concentrated in Wellington City and the Kāpiti Coast, the region is aging as illustrated in the diagram below. more than one ethnicity by 2038, an increase of 8% from
most parts of the region are now experiencing The aging demographic change is more pronounced in 2018. The 2018 Quality of Life survey revealed that 63% of
population growth significantly higher than long the districts. respondents in the Wellington region think that increasing
term averages. Levin, Carterton and Porirua have cultural and lifestyle diversity makes their local area a better
experienced growth rates of 2% or more over the last Wellington City is projected to continue to have the largest place to live. Ethnicity and age projections for 2038 show
3 years with growth rates in the Hutt Valley and Kāpiti proportion of the ‘working age’ demographic. The spread that 53% of Māori will be under 30 years old, while for the
from 2018-2019 being 1.18% and 1.27% respectively. of ages 0-9 and 10-19 is projected to become more rest of the population only 31% will be under 30 years old.
Diagram Projected regional demographic change 2018-2038
Diagram 6: Projected Regional Age Demographic Change 2018-2038 Diagram
Diag 4 7: Projected Regional Ethnicity Demographic
Change 2018-2038
2018 2038
2018 8% 10%
13%
19%
15% 76% 73%
2038
19 %
0 100000 200000 300000 400000 500000 600000
Population
European and other
Maori
Asian
Pacific
4
As at June 2020, includes Horowhenua
Age 0–9 Age 10–19 Age 20–39 Age 40–69 Age 70 plus
Key
5
An average increase of 0.9% pa
Wellington Regional Growth Framework | 12Our Housing
Until recently housing growth in the region has been The most significant changes in dwelling price over While dwelling rents in Carterton and Masterton
steady but more recently housing construction rates this period (March 1994 to Dec 2020) has been in the Districts fell in 2020, this is assumed to be a response
have been increasing as shown in the diagram below. Wairarapa; with the 2020 average house price in South to COVID-19, as both districts previously seen
Wairarapa 8.3 times the average dwelling price in 1994. sustained growth in dwelling rents generally in line with
Despite a more than 77.2% increase in new building This difference is 7.6 times in the Carterton district. those experienced in the rest of the region.
consents from 2012 to 2020 as seen in the diagram
Dwelling prices rapidly increased across all parts of
below, construction has not been able to keep pace On a dollar ($) basis, Wellington has the highest
the region, with average house price in December
with the increased housing demand on the back of the median house price in the region at $960,039 in
2020 being 88.3% higher than in March 2016. The
increase in population. December 2020, as well as the highest average weekly
largest increase over this period was seen in the
rent (by Geometric Mean) at $544 per week as of
Horowhenua and South Wairarapa districts; with a
This is being evidenced by increasingly high rents, December 2020.
112% and a 99% increase respectively.
increasing house prices and growing issues with
housing affordability. As evidenced in the diagrams Over the same period, the average dwelling rent in This is reflected in the 2018 Quality of Life survey which
overleaf, between March 1994 and December 2020 December 2020 was 33.9% higher than in March 2016. revealed that 29% of respondents in the Wellington
the average regional dwelling price increased by a As with dwelling prices, the largest increases over this region think that housing is unaffordable. Housing
factor of 6.5, while dwelling rents over the same period period have been in Horowhenua and South Wairarapa quality was also identified as an issue for the region,
increased by a factor of 2.9. (with increases of 61% and 65% respectively). with 24% of respondents having problems with damp or
mould and 16% of respondents unable to afford to heat
Diagram 8: New Regional Residential Building Consents their home properly during winter. Damp housing is a
particular issue for Māori and Pacific households, larger
3500
households, renters and young families.
In addition to the current housing issues, population
3000
projections show the region expecting an increase of
between 91,000 and 151,000 people in the next 30
2500
years which will require between 52,000 and 66,000
homes. This is the equivalent of accommodating more
2000 than the population of another Hutt Valley within the
geographical and other constraints the region has.
1500
In planning for this growth, it will be important to
1000
ensure availability of a range of housing options, in the
right places and at the right prices.
1991
1992
1993
1994
1995
1996
1997
1998
1999
2000
2001
2002
2003
2004
2005
2006
2007
2008
2009
2010
2011
2012
2013
2014
2015
2016
2017
2018
2019
2020
Wellington Regional Growth Framework | 13Diagrams 9: Twelve Month Rolling Median Dwelling Sales Prices (actual)
Wellington City
Porirua City
Kāpiti Coast District
Hutt City
Upper Hutt City
South Wairarapa District
Carterton District
Masterton District
Horowhenua District
Diagrams 10: Twelve Month Rolling Mean Dwelling Rents (actual)
Wellington City
Porirua City
Kāpiti Coast District
Hutt City
Upper Hutt City
South Wairarapa District
Carterton District
Masterton District
Horowhenua District
Wellington Regional Growth Framework | 14Our Economy
The region has a strong foundation to build off with its high Diagram 11: Top 5 Employment Sectors • The industry mixes for the Wairarapa districts
knowledge-based industries as well as being the Capital (Wellington region only) are reasonably typical for rural-based districts in
and the centre of Government. We have a competitive New Zealand. The high importance of health in
14%
advantage in the areas of film and technology, finance, Masterton reflects the location of the hospital there.
professional services, arts and government services. • The industry mixes for Lower Hutt, Upper Hutt,
These weightless industries provide a strong starting point Porirua, and Kāpiti Coast are quite typical for
PROFESSIONAL, SCIENTIFIC,
to achieve a low-carbon economy. Technology will play TECHNICAL ADMINISTRATIVE & urban centres in New Zealand. They all include
an ever-increasing role in this. SUPPORT SERVICES amongst others, Manufacturing and Construction
As well as this the regional economy is diversified
through the strength of the food bowls of the
11.4% industries. The report noted that the importance
of health services to the Kāpiti Coast is unusual
CENTRAL GOVERNMENT, given its lack of a hospital, and probably reflects
Wairarapa and Horowhenua. ADMIN, DEFENCE its higher age structure.
& SAFETY
Māori and Iwi increasingly play an important role in the • The high importance of government, professional
local economy. There is a strong presence of Māori
in business in film, technology and business services
9 .4% services, finance and ICT for Wellington City is
singular for a territorial authority area in New Zealand.
and Māori owned entities play a key role in commercial HEALTHCARE
& SOCIAL Central Wellington is the largest employment centre
property, housing and social developments.
ASSISTANCE in the region. There are a number of other major
The top industries, by number of employees, in the
Wellington region in 2020 are shown in the diagram to 8.3% employment centres in the western and eastern
corridors and a number of smaller regional service
the right. EDUCATION towns in Kāpiti, Horowhenua and the Wairarapa.
& TRAINING All of these are serviced by the rail and State
The top employment industries in Horowhenua (by Highway networks and have significant numbers of
number of employees) in 2020 were Health Care and
Social Assistance (11%), Education and Training (7.9%), 8.3% commuters traveling to central Wellington regularly for
employment (with the exception of Martinborough).
Construction Services (5.8%), Accommodation and ACCOMMDATION
Food Services (5.5%) and Supermarket and Specialised & FOOD SERVICES
Food Retailing (5.2%).
Analysis undertaken as part of the ‘Wellington Regional
Investment Plan - 2019’ with regards to the industries
within the Wellington region (excluding Horowhenua)
identified that:
Wellington Regional Growth Framework | 15Diag 9 Diagram 9 Employment growth by sector 2018-2050
Diagram 12: Share of Employment Going forward, the region is expecting over 100,000 persons reporting zero income or a loss) and 11.6%
Growth by Sector 2018-2050 additional jobs over the next 30 years6. The diagram of people reported a personal income of $100,000
to the left shows the projected share of employment or more. In the same census, in Horowhenua, 53.8%
growth by sector. of people reported a personal income between $1
1.7% 1.9% 0.3% 0.5% A business land assessment undertaken as part of
and $30,000, and 2.8% of people reported a personal
income above $100,000.
the ‘Housing and Business Development Capacity
4.1% Assessment – 2019’ for the metropolitan councils
project a future business land demand over the 2017-
A PWC report ‘Competitive Cities: A Decade of Shifting
Fortunes – Spotlight on Wellington - 2019’ reported that
5.4% 2047 period of 1,340,472 square metres of new floor Wellington experienced a sizeable rise in discretionary
area across all business sectors. The report concluded income over the decade 2008-2018, extending
that there is sufficient capacity within the region to its advantage over other cities. They estimated
meet projected demand for business land over the next that discretionary income for a median household
30 years. increased by $137 per week.
52%
34.1% The region has 11.3% of national employment, 14.9%
of the nation’s professionals and 16.3% of the nation’s
knowledge workers.
The Wellington region has the highest GDP per capita
in the country at $74,251, generating 12.8% of national
value added (GDP) whilst being home to 10.6% of New
Public Services
Zealand’s population. Per capita GDP in the region is
Other Private Services
17.7% greater than the national average.
Accommodation
Wholesale and Retail Trade
In line with high GDP per capita, the mean annual
Construction
household incomes across the Wellington region are
Utilities
also the highest in the country being $119,000 in 2019,
Manufacturing
10.9% above the national average of $106,000. The
Primary
mean annual household income in Horowhenua in
2019 was significantly lower at $74,300.
There are also other variations in household incomes
in the region. At the time of the 2018 census within the
Wellington region, 37.6% of people reported having a
personal income between $1 and $30,000 (excluding 6
According to the Greater Wellington Regional Council
economic forecast model
Wellington Regional Growth Framework | 16Our Transport System
State HighwayDiag 10the
1 and Morning PeakRailway
Main Trunk Transport Diagram
by area of origin
provide 13:2016
by mode Morning Peak Transport by Area of Origin by Mode 2016
connections along the western corridor from
Wellington through Porirua, Kāpiti and Horowhenua to NORTH
WEST NORTH
Palmerston North and the Upper North Island. State & REST OF REGION
Highway 2 and the Wairarapa Railway Line provide
connections between Wellington through the Hutt
39 %
51% Car
Occupants
Valley to the towns and rural areas of the Wairarapa.
Both Masterton in the Wairarapa and Levin in 21 %
10% Bus
Passengers
Horowhenua are nearly 100km from central Wellington.
0 %
36% Rail
Passengers
2%
The topography and key transport links have helped to
deliver a relatively compact urban form across most 36% Pedestrians
of the region, a focused and dynamic Wellington city
centre, and relatively high public transport use when
compared to other urban areas in New Zealand.
4% WEST 1% Cyclists
SOUTH EAST
Major natural barriers including the Remutaka Hill
(between the Hutt Valley and the Wairarapa), and
hilly topography between Porirua and the Hutt Valley,
48% Wellington CBD 58% Car
Occupants
and Porirua and the Kāpiti Coast have presented
limits to urban development and limited easy access
22% EAST
23% Bus
Passengers
between the residential and employment areas (east-
west connections).
0% SOUTH 0% Rail
Passengers
The concentration of regional employment in central 26% 15% Pedestrians
4% 4%
Wellington, and the dominance of the knowledge-based
sector working conventional hours means that a large Cyclists
number of people want to travel into and out of central
Wellington at the same time, as can be seen in the
diagram for the morning travel peak. This creates a The significant commuter peak, limited west-east The large number of vehicles travelling into central
significant and concentrated peak demand on the two connectivity across the region, and capacity constraints Wellington also creates conflict and safety issues with
north-south road and rail corridors as well as from other on both the state highway, local roads and public transport, people walking, cycling and using other active travel
key west, south and east routes within Wellington City. create significant travel time delays and unreliable journey options. A significant proportion of central city streets are
times for freight, private vehicles and bus services. currently used for moving or parking private vehicles.
Wellington Regional Growth Framework | 17The diagram below illustrates travel time variability School travel makes a significant contribution to trip
on key car journeys and illustrates how travel time numbers, particularly in the morning peak when those
increases significantly during the morning peak. travelling to school are travelling at the same time
as commuters.
Diagram 14: Travel Time Variability
Tawa Pukerua Bay to Lower Hutt Silverstream
Pukerua Bay to Lower Hutt 90 90 90
Silverstream 80 80 80
Travel Time (min)
Travel Time (min)
Travel Time (min)
70 70 70
60 60 60
50 50 50
40 40 40
Titahi Bay 30 30 30
20 20 20
Tairangi School 10
0
10
0
10
0
Takapuwahia 0 1 2 3 4 5 6 7 8 9 10 11 12 13 14 15 16 17 18 19 20 21 22 23 0 1 2 3 4 5 6 7 8 9 10 11 12 13 14 15 16 17 18 19 20 21 22 23 0 1 2 3 4 5 6 7 8 9 10 11 12 13 14 15 16 17 18 19 20 21 22 23
Hours of the Day Hours of the Day Hours of the Day
5th Percentile Average (Median) 95th Percentile 5th Percentile Average (Median) 95th Percentile 5th Percentile Average (Median) 95th Percentile
Tawa
Newlands Waterloo
Churton Park Churton Park Titahi Bay Tairangi School
90 90 90
80 80 80
Travel Time (min)
Travel Time (min)
Travel Time (min)
70 70 70
60 60 60
50 50 50
40 40 40
30 30 30
20 20 20
10 10 10
0 0 0
0 1 2 3 4 5 6 7 8 9 10 11 12 13 14 15 16 17 18 19 20 21 22 23 0 1 2 3 4 5 6 7 8 9 10 11 12 13 14 15 16 17 18 19 20 21 22 23 0 1 2 3 4 5 6 7 8 9 10 11 12 13 14 15 16 17 18 19 20 21 22 23
WELLINGTON Hours of the Day Hours of the Day Hours of the Day
5th Percentile Average (Median) 95th Percentile 5th Percentile Average (Median) 95th Percentile 5th Percentile Average (Median) 95th Percentile
Newlands Takapuwahia Waterloo
90 90 90
80 80 80
Travel Time (min)
Travel Time (min)
Travel Time (min)
70 70 70
60 60 60
50 50 50
40 40 40
30 30 30
20 20 20
10 10 10
0 0 0
0 1 2 3 4 5 6 7 8 9 10 11 12 13 14 15 16 17 18 19 20 21 22 23 0 1 2 3 4 5 6 7 8 9 10 11 12 13 14 15 16 17 18 19 20 21 22 23 0 1 2 3 4 5 6 7 8 9 10 11 12 13 14 15 16 17 18 19 20 21 22 23
Hours of the Day Hours of the Day Hours of the Day
5th Percentile Average (Median) 95th Percentile 5th Percentile Average (Median) 95th Percentile 5th Percentile Average (Median) 95th Percentile
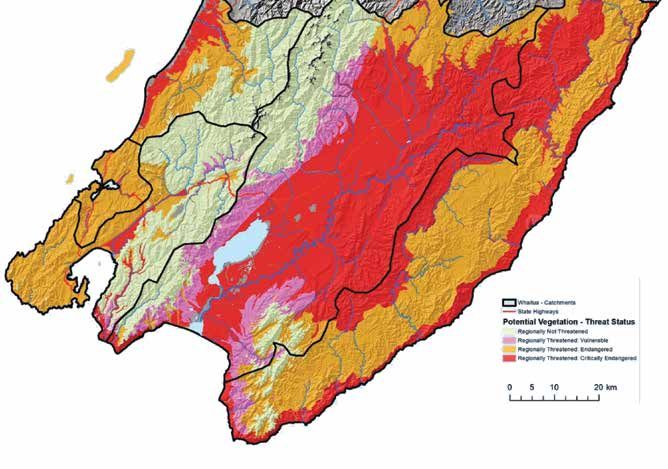
Wellington Regional Growth Framework | 18During the weekends, congestion is increasing Space constraints on road corridors and limited
particularly in central Wellington and town centres alternative routes means that the transport system has
as people travel for sport, shopping, or other poor resilience to unplanned events (whether they are
lifestyle reasons. caused by natural events such as storms, or network
incidents such as crashes).
The region provides the northern port for road and
rail trips between the North and South Islands, via the Whilst much of the land in the region is bordered by the
Cook Strait ferries. The region has a number of existing sea, beyond the Cook Strait ferries and visiting cruise
key freight hubs and destinations including Waingawa, ships, there is limited use of the sea as a transport
Seaview/Gracefield, Porirua/Tawa, CentrePort and the option between different areas within the region, with
Wellington City CBD. Access to CentrePort, and the the primary service being one between Queens Wharf
safety and reliability of road and rail corridors north of and Days Bay.
Wellington, are critical to supporting journeys between
these destinations.
Businesses are reliant on an efficient and reliable
transport system for their economic growth and
prosperity. Network improvements have the ability to
impact the extent to which economic growth occurs
in different parts of the region, and the time and cost
associated with moving freight and/or travelling to
deliver services.
Wellington Regional Growth Framework | 19The Three Waters Infrastructure
There are a number of increasing pressures on the Diagram 15: Strategic three waters assets and networks (not all of the region included)
three waters infrastructure in the region including:
• The region growing faster than anticipated putting
pressure on current aging infrastructure.
• Funding challenges for current and new
infrastructure.
• Managing urban growth within &
,
U p p e r H u t t C i t y
environmental limits. 3
Q
&
,
&
,
&
,
• Managing existing infrastructure and designing new P o r i r u a C i t y 3
Q 3
Q
&
,
infrastructure for the impacts of climate change. &
, ,
& &
,
,
& &,
,& , &
, &
,
&
, & &
,
• The vulnerability of the three waters assets to the
&
, &
, &
,
, ,
& &
&
, &
,
&
,
impacts of extreme natural hazards.
&
,
&
,
&
, %
! &,
,&
• Expected changes to legislation that will impact &
,
&
,
&
,
&,
,&
& &
,
&
, ,
S o u t h W a i r a r a p a
on the requirements of the network.
,
&
&
,
&
,&
, &
, & ,
, & D i s t r i c t
& ,
, &&
, & ,
, &
&
,
The diagram to the right provides a current state view &
, &
,
&
, &
, & &
,
&
, ,
&
, &
, &
,
of the strategic three waters assets and networks 3
Q
&
,
&
, &
, 3
Q &
,
&
, &&
,,
&
, &
,
%
!
W e l l i n g t o n
within some parts of the region. It illustrates the C i t y &
,
&
,
&
,,&
&
,
3
Q &
,
H u t t C i t y
number of assets within the region.
&
,
&&
, &
, &
,
,
&
, &
,
&
&
,
&
, ,
&
,
3
Q
&,
,&
The ‘Housing and Business Development Capacity &
,
&
,
&,
& ,
,
&,
& %
! %
!
&
,
Assessment – 2019’ report highlighted the need for
,
& &
,
,
&
&
, &
,
&&
, , ,& &
, ,
&
LEGEND
ongoing investment for the renewal and upgrading &
,
,
&
&
,
%
! Wastewater Storage Area
,
& &
,
of infrastructure in the region in order to ensure
&
, ,
& Reservoir
&
,
3
Q Water Treatment Plants
that development capacity is not constrained by
Wastewater Tunnel
3
Q Wastewater Treatment Plants
infrastructure. In some instances there are existing Wastewater Outfall Pipe
WCC Wastewater Sludge Pipe
constraints that are having an immediate impact on Trunk Sewer
GWRC Bulk Water Pipe
the ability of areas to accommodate growth. Stormwater Pipe > 1,000mm
SWDC Stormwater Pipe > 300mm
Water Pipe
Transmission Gully Motorway Designation
City Council Boundaries
Esri, Garmin, GEBCO, NOAA NGDC, and other contributors, Wellington Water
Wellington Regional Growth Framework | 20Our Environment, Natural Hazards and Climate Change
The region has a wide range of natural environmental Diagram 16: Wellington Region • Air quality is generally good, however the
features with many interconnected parts including Conservation Sites and Activity Wairarapa Airshed is polluted. Elevated PM10
the coastal environment, waterbodies, mountains and in winter due to domestic fires are a concern
hills, wetlands, terrestrial habitats and landscapes and for several areas including the Wairarapa,
urban and rural environments. Wainuiomata, Upper Hutt and Raumati South.
• Lakes Wairarapa, Onoke and Waitawa are
The natural environmental is highly valued and enjoyed
degraded due to discharges from agricultural
by communities for ecological amenity and recreation
and municipal wastewater discharges. By
value. However, opinions vary on how, and the extent
contrast, regional lakes located amongst forest
to which, the natural environment should be protected,
cover have recorded high ecological value.
particularly on private land. There are 33,000 hectares
of regional parks, and as of July 2009 150,500 • Contaminants, including heavy metals, polycyclic
hectares of the Wellington region was legally protected aromatic hydrocarbons and DDT are present in
by the Department of Conservation, regional councils, both Porirua Harbour and Wellington Harbour at
QEII Trust or Ngā Whenua Rāhui. In addition to the concentrations above ‘early warning’ guidelines.
areas of land with formal protection, there are a wide • 55% of monitored shellfish gathering locations did
range of conservation initiatives being undertaken in not comply with faecal coliform thresholds.
the region, as can be seen in the diagram to the right.
The region is exposed to a wide range of natural
The ‘Quality of Life Survey 2018’ provides information hazards including earthquakes, landslides/slips,
on the extent to which residents in the region perceive tsunamis, flooding and liquefaction. With over 12,300
certain environmental issues are of concern. The kms of rivers and streams in the region and more
results show that 58% of residents surveyed in the The following represents a a range of environmental than 500km of coastline the region is also exposed
Wellington region felt that water pollution had been a reporting from the region: to climate change impacts. Some of these such as
problem in their local area. 34% also felt noise pollution storm surges and increased flooding are being seen at
• 15% of the region is prone to erosion and requires
had been a problem and 18% felt that air pollution present and are expected to increase in the region.
re-vegetation to retain soils, particularly in the
had been a problem. Overall 88% of respondents in eastern Wairarapa hill country.
the Wellington region rated their overall quality of life Any development will need to be undertaken within the
• Soil quality is generally “reasonable”, however context of protecting the environment including taking
positively (responding with either good, very good or
vegetable growing and dairy farming activities are account of emerging national policy direction such as
extremely good).
having a negative impact; particularly around Ōtaki. the National Policy Statements on Highly Productive
• Coastal environments are generally in good Land and Biodiversity.
condition, however some beaches regularly record
high levels of faecal pollution.
Wellington Regional Growth Framework | 21Key messages from reports by NIWA on the Wellington region, ‘Wellington region climate Diagram 17: Wellington Region Gross Greenhouse
change extremes and implications – December 2019’ and ‘Report Summary: Wellington region Gas Emissions 2019 by Source
climate change projections and impacts - June 2017’, predict that if global carbon emissions
are not significantly reduced by 2090 the region will experience: Agriculture 34.2%
Land transport 27.9%
• Annual temperature increases of at least 2°C, and up to 3.5°C in Masterton. Electricity Consumption 7.5%
• Annually more hot days (above 25°C) - to increase by 20 for the west of the region, 29 Aviation 6.5%
for Wellington and 70 for the Wairarapa. Extremely hot days (above 30°C) will increase Natural Gas 5.1%
by 20 for Masterton. Solid Waste Disposal 4.3% LPG Stationary Energy 0.9%
Marine Diesel 4.3% Light Fuel Oil Transport 0.8%
• Rainfall in the east of the region reducing by 10% in spring, summer and autumn7. Natural Gas Transmission and
Industrial Emissions 3.8%
Increased drought risk in the Wairarapa. Rainfall in the west increasing in all seasons Distribution loss 0.8%
Petrol and Diesel Stationary Energy 2.2%
and by up to 15% in winter8. Waste Water 0.6%
Other 4.2%
• More frequent extreme rainfall events, particularly in coastal locations. Electricity Transmission
and Distribution loss 0.6%
• Frosts declining in the Tararua Ranges from 30 per annum to near zero. Coal 0.2%
• Sea levels rise between 0.28 and 0.98m9, however this could significantly increase Biofuel/Wood 0.2%
depending on the future of the Antarctic ice sheets. LPG Transport 0.1%
Impacts of a changing regional climate will include increased coastal erosion and
inundation, landslides, drought, water shortages, more frequent and intense storms, new
0.1%
pests and diseases and impacts on biodiversity and ocean acidification. Some of these, 0.2% .2%
such as storm surges and increased flooding, are being seen at present and are expected 0.9% 0
to increase in the region. Large areas of central Wellington, Kilbirnie, Miramar, Petone, Ōtaki, 4.2%.2%
Waikanae and east of Lake Wairarapa, are at risk from inundation.
34.2% 2 .8% 0.6%
3
This is having an impact on insurance discussions and premiums, with for instance, IAG
4.3% 0.8%
which covers more than half of the Wellington insurance market deciding to limit its home 0.6%
and contents policies in Wellington following the Christchurch and Kaikōura earthquakes. 4.3%
The 2020 Insurance Retreat Report for the Deep South National Science Challenge 0.8%
estimates that partial insurance retreat will affect properties by 2030, and by 2050 full
5 .1%
insurance will be unlikely for 1,740 coastal residential properties in Wellington City alone.
6.5%
The gross greenhouse gas emissions for the Wellington region in 2019 were 2.55 Mt CO2-e. 27 .9%
7.5%
Most of our emissions are from the transport (39.5%) and agriculture (34.2%) sectors as can
be seen in the diagram to the right.
Total gross emissions in Horowhenua in 2018/2019 were 0.82 MtCO2-e. This is the 7
Compared to 1995
third largest emissions profile in the region. The largest sources of GHG emissions in 8
Compared to 1995
Horowhenua are Agriculture and Transportation. 9
Note this statistic is for 2100 compared with 1986-2005 average
Wellington Regional Growth Framework | 22You can also read