Draft Wellington Regional Growth Framework - 30-year spatial plan for the Wellington-Horowhenua region
←
→
Page content transcription
If your browser does not render page correctly, please read the page content below
Draft Wellington
                                                   Regional Growth
                                                   Framework
                                                   FEBRUARY 2021

                                                   30-year spatial plan for the
                                                   Wellington-Horowhenua region

Draft Wellington Regional Growth Framework |   1
Table of Contents
Executive summary.. ..................................................................................................3   This draft document presents a summary of a large amount of work undertaken by
                                                                                                                          partners and stakeholders in the Wellington Regional Growth Framework.
The Framework and the Urban Growth Agenda.................................................. 10
                                                                                                                          Further information on the Framework, including background documents such as the
Part 1 – The current state and our challenges..................................................... 13                     Framework’s Foundation Report, can be found at www.wrgf.co.nz.

Part 2 – Iwi in the region......................................................................................... 19    This draft Framework will be subject to partner sign-off, continued stakeholder
                                                                                                                          engagement and public consultation before it is finalised in the first half of 2021.
Part 3 – Key moves...................................................................................................24

Part 4– Going forward. . ...........................................................................................28

Part 5 – The spatial plan. . ........................................................................................35

Part 6 – The implementation plan.........................................................................65

Glossary and References.. ........................................................................................69

Appendix 1: Projects list.. .........................................................................................70

Photo credit:
Carterton District Council, Horowhenua District Council, Kāpiti Coast District Council, Hutt City
Council, Masterton District Council, Porirua City Council, South Wairarapa District Council, Upper
Hutt City Council, Neil Price and Justine Hall, Wellington City Council and Waka Kotahi (NZTA).

                                                                                        Draft Wellington Regional Growth Framework |           2
Executive summary
        Ka ora te wai               If the water is healthy             In developing the Framework we have taken into                  While there is no certainty about when, how or at what
     Ka ora te whenua             the land will be nourished            account and included planning and analysis already              rate the region’s population might reach this size, the
                                                                        undertaken in work such as city- and district-scale             Framework has been developed based on this scenario
     Ka ora te whenua               If the land is nourished
                                                                        spatial plans (including Wellington City’s Planning for         to give a good understanding of what would be
     Ka ora te tangata         the people will be provided for          Growth), district plan changes (for instance in Porirua         required to support this level of growth. It is important
                                                                        City and Hutt City), iwi management plans and central           to note that this is not a policy target.
    Mo te iti – mo te rahi       For the little – for the large
                                                                        government policies such as those in the Climate
                                                                        Change Response (Zero Carbon) Amendment Act 2019.               The proposed changes to urban form for the region
The Wellington Regional Growth Framework (the                                                                                           are a mix of development in both Urban Renewal Areas
Framework) is a spatial plan that has been developed by                 The Framework identifies how the Wellington-                    (brownfield) and Future Urban Areas (greenfield)2. Both
local government, central government and iwi partners                   Horowhenua region could accommodate a future                    are expected to have higher density development than
in the Wellington-Horowhenua region1 to provide                         population of 760,000 and an additional 100,000 jobs            we see at present, throughout the region, and include
councils and iwi in the region with an agreed regional                  in the next 30 years. This would represent an additional        improved access to bus and rail services, which are
direction for growth and investment, and deliver on the                 200,000 people living in the region.                            expected to increase in frequency, capacity and reach
Urban Growth Agenda objectives of the Government.                                                                                       over time.
                                                                        The scenario of 200,000 people has been developed to
It is one of several spatial plans being developed                      understand what would be required to accommodate                Approximately two-thirds of the housing growth
across the country, with other plans being completed                    this level of growth, and consider potential                    shown in the Framework is expected to occur in Urban
for the Hamilton to Auckland corridor, metropolitan                     infrastructure needs beyond the 30-year growth                  Renewal Areas, in existing urban areas through infill,
Hamilton-Waikato, Tauranga/Western Bay of Plenty                        scenario. Population projections for the region suggest         urban renewal and intensification. Approximately
and Queenstown.                                                         new homes may be needed for 91,000 to 151,000                   one-third of the growth will be in Future Urban Areas,
                                                                        additional people, over 30 years.                               extending the current urban footprint of the region.
The region is facing a number of housing and urban
development, transport and resilience challenges for                    To put this potential growth in a regional context,             Our current understanding is that, regionally, 88% of
the future. These challenges are regional issues that                   151,000 is more additional people than currently reside         housing growth in the Framework is expected to come
are best dealt with together and not individually. Many                 in the Hutt Valley and 200,000 is slightly less than the        from areas we have identified in the Framework and
of these challenges cross local council boundaries                      current population of Wellington City.                          12% is expected to be through ‘business as usual’ infill
and the maximum benefits can be had from tackling                                                                                       throughout the region, with just over half of this infill
these together.                                                                                                                         being in Wellington City.

1
     For the purpose of the Framework the region includes the territorial authorities of Masterton, Carterton, South Wairarapa, Upper
     Hutt, Lower Hutt, Wellington, Porirua, Kāpiti Coast and Horowhenua.
2
     For definitions of Urban Renewal Areas and Future Urban Areas, see the Glossary and Reference section of this report.

                                                                             Draft Wellington Regional Growth Framework |        3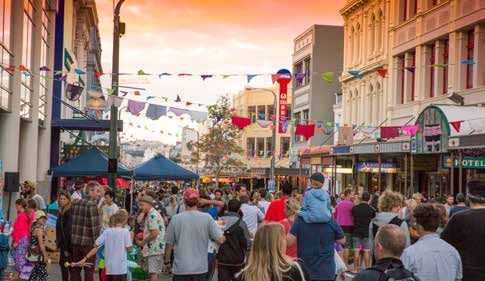
Of the 88% housing growth from areas identified in the Diagram 1: A growth corridor view of the Future Urban Development Areas
Framework:
Western Growth Corridor – Eastern Growth Corridor –
• One-quarter is expected to be accommodated in Tawa to Levin Hutt to Masterton
Wellington City (excluding Tawa in the western
corridor), including the Let’s Get Wellington Levin Masterton
Moving corridor.
central Masterton
area (central area
to Renall
Taraika Street Station)
• Nearly one-third is expected to be accommodated in Ōtaki North
the eastern corridor from Lower Hutt to Masterton.
Carterton
Ōtaki East
Te Horo/ Waikanae
Peka Peka North
• The remainder (just over 40%) is expected to be Growth Area
Waikanae
Featherston
accommodated in the western corridor from Tawa Paraparaumu
North
Gillespies
to Levin. Paraparaumu
central area
Road Block
Porirua Upper Hutt to
The Framework identifies improving west-east North
Growth
Heretaunga
railway
Possible New stations
connections as an opportunity to unlock growth,
Area
West-East Growth Eastern
improve resilience and improve regional accessibility
Tītahi Upper Hutt
Corridor – Porirua Bay Porirua Southern
Growth Area
to economic and social opportunities. The potential to Heretaunga Judgeford
Hills
Porirua
housing and urban development capacity of any
to
Takapū
Road
Taita
future west-east multi-modal corridor(s) has yet to railway
stations
be determined and will need consideration alongside Central Hutt
triangle,
Woburn to
potential transport interventions. Naenae
Station
Upper
Steppings
The following diagrams and maps identify the key
elements of the Framework, being:
Possible New
West-East Growth Lincolnshire
• A growth corridors view – outlines a corridor Corridor – Farm
Petone North Wainuiomata
North
approach to growth. Johnsonville to
Wainuiomata Johnsonville
• An Objectives to Initiatives diagram – outlines the
objectives, challenges, key moves and initiatives in Urban Renewal Areas
Future Urban Areas
the Framework. Further Study Areas
Potential new business areas
• Key spatial plan maps – a series of maps is Growth corridors
Central
Wellington
provided here and in later parts of this document. Corridor Study Areas
Existing railways Let’s Get
These key elements of the Framework are outlined in State Highways
Wellington Newtown
Moving
more detail in this report. All aspects of the Framework Possible new railway stations
Growth
Hospital Kilbirnie
have been developed collectively with partners and Airport
Corridor
stakeholders during an extensive series of workshops Port 26%
and meetings. Potential papakāinga/iwi development
Draft Wellington Regional Growth Framework | 4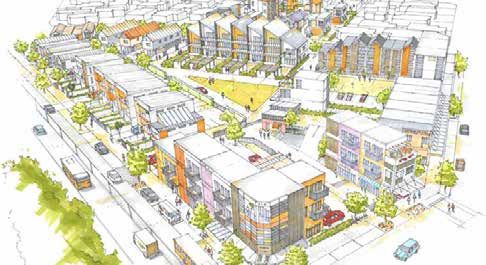
Diagram 2: Objectives to Initiatives diagram

Objectives       •   Increase housing supply, and improve housing affordability and choice
                 •   Enable growth that protects and enhances the quality of the natural environment and accounts for a transition
                     to a low/no carbon future
                 •   Improve multi modal access to and between housing, employment, education and services
                 •   Encourage sustainable, resilient and affordable settlement patterns/urban forms that make efficient use of
                     existing infrastructure and resources
                 •   Build climate change resilience and avoid increasing the impacts and risks from natural hazards
                 •   Create employment opportunities.

Challenges       •   The region lacks sufficient and affordable housing supply and choice, housing affordability is declining and a
                     significant investment in infrastructure is needed to enable enough housing and quality urban environments
                 •   Many of the urban areas in the region are vulnerable to the impacts of natural hazards and climate change,
                     and as the region grows and becomes more densely settled, it will become increasingly important to improve
                     resilience and protect and enhance the region’s natural environment
                 •   There is inequitable access to social, educational and economic opportunities across the region
                 •   Mana whenua and Māori in the region have poor access to affordable housing choices

Key Moves        •   Harness growth to make the region’s housing and urban areas more affordable and liveable and provide more
                     housing choice – 'walkable neighbourhoods'
                 •   Make better use of the region’s limited supply of well-located greenfield land
                 •   Fully unlock the urban development potential of current and future rapid transit orientated corridors particularly
                     the Let’s Get Wellington Moving corridor
                 •   Unlock new areas for housing and urban development and deliver greater regional resilience with a major west-
                     east multi-modal corridor
                 •   Deliver transformational housing and development outcomes for iwi/Māori
                 •   Address the urban development challenges of climate change and transitioning to a zero-carbon economy at a
                     regional scale

Key Initiative   •   Transport – multi modal
Areas            •   Urban planning
                 •   Iwi – housing, spatial planning, capacity building
                 •   Three waters infrastructure
                 •   Social Infrastructure
                 •   Employment,education/training
                 •   8 key spatial initiatives

                                                                     Draft Wellington Regional Growth Framework |    5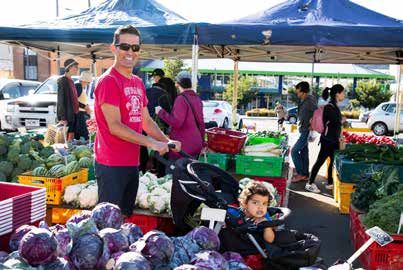
Diagram 3: Key spatial maps
                                                                                                                         15 Current Urban Areas                                                                         13 Nodes - Resid

                                                    Levin                                                                                                                           Levin
                                                                                                                                                                                                5/57 Fernleigh Street

                        Paraparaumu                                                                                                                     Paraparaumu

                                                                                      Masterton                                                                                                  Masterton

                                                                          Carterton

                                                            Featherston

              Porirua                                                                                                                         Porirua

                                                   Upper Hutt                                                                                                                      Upper Hutt

                                      Lower Hutt                                                                                                                      Lower Hutt

     Wellington                                                                                                                      Wellington

                                                                                                                             Lower density         Higher density
   Current Urban Area                                                                                                            Rail network
   Rail network                                                                                                                  State Highways
   State Highways                                                                                                                Future Highways

                                                                                                  Draft Wellington Regional Growth Framework |                 6
Blue Green Network                        38 Combine W

                                               Levin

                   Paraparaumu

                                                                                 Masterton

                                                                     Carterton

                                                       Featherston

         Porirua

                                              Upper Hutt

                                 Lower Hutt

Wellington

                                                                                                                           Combined Wāhi Toitū Areas
 Awa and marine reserves
                                                                                                                           Rail network
 Green areas                                                                                                               State Highways
                                                                                                                           Future Highways
 Whaitua boundaries                                                                                                        Territorial authority boundaries

                                                                                             Draft Wellington Regional Growth Framework |             7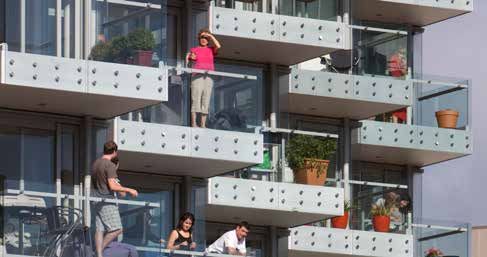
Porirua
Kenepuru
Levin Levin
Linden
Ōtaki Upper Hutt
Tawa
Wallaceville
Waikanae
Paraparaumu
Masterton
Paraparaumu Trentham
Masterton
Paekākāriki
Heretaunga
Carterton
Pukerua Bay
Carterton
Featherston
Lower Hutt Greytown
Porirua
Porirua
Featherston
Upper Hutt Upper Hutt
Taitā
Johnsonville
Lower Hutt
Lower Hutt Petone Martinborough Naenae
Wellington Melling Epuni
Wellington
Employees Working in the area
0–1000
Wellington Waterloo
1001–2000 Rapid transit network*
2001–5000
5001–10,000
Passenger rail network, Woburn
10,001–20,000 High frequency bus routes
20,000+
Potential new business areas
Future mass rapid transit (LGWM)
Rail network Airport *current service frequencies are 20
State Highways minutes on average. Frequency
Future Highways Hospital improvements are scheduled for 2025
Draft Wellington Regional Growth Framework | 8
The Framework is presented in six parts:

•   Part 1 outlines the current state of and identifies the key
    challenges facing the region.
•   Part 2 outlines information about iwi in the region.
•   Part 3 outlines the key moves that will individually and
    collectively make a difference in the region.
•   Part 4 outlines the region’s future growth scenario as well as
    outcomes and indicators to take advantage of the region’s
    opportunities and address its challenges.
•   Part 5 describes the spatial plan for the region for the 30-year
    period. It includes sections on:
    -   Urban form.
    -   Transport.
    -   The blue-green network.
    -   Constraints.
    -   Employment.
    -   The three waters infrastructure.
    -   Community infrastructure.
•   Part 6 outlines the key initiatives, projects and governance
    required to implement the Framework.

                                                                   Draft Wellington Regional Growth Framework |   9
The Wellington Regional Growth Framework
and the Urban Growth Agenda
Why are we developing the Wellington Regional Growth Framework?
The region is growing faster than it has done for many     An increasing number of vehicles on the roads, capacity
decades, and is facing immediate and longer-term           and reliability issues associated with buses and trains,
housing supply and affordability, urban development        and network resilience issues are straining the regional
and infrastructure challenges.                             transport system and may not result in the necessary
                                                           transport system shifts that we are seeking, such as
The immediate issues relate to a lack of housing           improving safety and access, reducing emissions and
supply, a limited range of housing options and             reducing reliance on private vehicle travel.
declining housing affordability, particularly for first-
home buyers. In the next 30 years, up to 66,000            Community infrastructure will also need more
new homes may be needed for up to 151,000                  coordinated investment to accommodate growth,
additional people in the region. This is equivalent to     including in open spaces, community facilities, schools
accommodating more than another Hutt Valley of             and health care facilities.
people and housing in the region.
                                                           All these challenges will need to be resolved for the
A significant investment in housing, urban                 future and are regional issues best dealt with together
development, transport and the three waters3               and not individually. Many also cross local council and
infrastructure and services, as well as regional and       iwi boundaries, and maximum benefits can be had
district planning and policy changes, will be needed to    from tackling them together.
support future growth.
                                                           It is important that we take a region-wide approach and
Beyond the forecast population and dwelling growth         develop a partnership between central government,
there are a number of other challenges facing the          local government and mana whenua (and the private
region. Projected sea-level rises, the severity of         sector) to respond to our regional challenges so that
weather events, environmental stewardship pressures,       we can address community expectations.
barriers to mana whenua in fulfilling their role as
kaitiaki, and natural hazards are creating challenges as
well as uncertainty.

                                                                                                                      3
                                                                                                                          Drinking water, wastewater and stormwater.

                                                             Draft Wellington Regional Growth Framework |    10
Urban Growth Agenda
The Wellington Regional Growth Framework (the The benefits of spatial planning include: This document is not a Future Development Strategy
Framework) has been developed by local government, as required under the National Policy Statement on
central government and iwi partners to deliver on the • Better coordination between planning and Urban Development (NPS-UD). However, it has been
Urban Growth Agenda objectives of the Government4, funding agencies to identify and respond to the developed with this in mind and with the expectation
which adjusts the approach to urban development planning challenges affecting the Wellington- that the next iteration of the Framework will meet the
and infrastructure planning and introduces new Horowhenua region. NPS-UD requirements.
instruments and levers. • Identifying the regional investment pipeline
for infrastructure and services and providing Diagram 4 shows the relationship between the
Cabinet has recently endorsed the Māori and Iwi Housing increased certainty for all levels of government Framework and other statutory and non-statutory
Innovation Framework for Action, which will deliver, at and the private sector. documents. It demonstrates that we have taken
pace, a system-wide response to Māori housing stress. current growth strategies and plans into account when
• Providing an easy-to-understand story to the outside
This direction will also be important for this partnership developing the Framework and that the Framework will
world to optimise external investment and jobs.
given the challenges identified in the Framework. set the direction for plans going forward.
• Creating a long-term and agreed approach to
Spatial planning is one pillar of the Urban Growth growth to avoid changes in policy from one For example, a key initiative covered later in this
Agenda and is focused on successful growth electoral cycle to another, which could deter document is to ‘Review council zoning and other
management. Its core proposition is that well planned private investment. levers to enable higher densities within existing and
and managed urban growth should result in improved This Framework is one of several spatial plans being new urban areas in appropriate locations identified
environmental, employment, transport and housing developed across the country, with other plans being in the Framework’. This initiative will see changes to
outcomes for communities. completed for the Hamilton to Auckland corridor, district plans, which being 10-year planning documents
metropolitan Hamilton-Waikato, Tauranga/Western Bay should support the longer-term strategy outlined in the
of Plenty and Queenstown. Framework in their objectives and policies, noting that
the district plans in the region differ in their timing.
4
https://www.hud.govt.nz/urban-development/urban-growth-agenda/
Draft Wellington Regional Growth Framework | 11Diagram 4: Relationship between the Framework and other documents
Wellington Regional Growth Framework
A 30+ year regional spatial plan – a high level directional
document developed collectively. Developed as part of the Future Development Strategy
government Urban Growth Agenda. A requirement under the National Policy Statement on
Urban Development (2020) which needs to demonstrate
that there will be sufficient, feasible development capacity
Council Growth Strategies in the medium and long term within a council area.
Individual council long term strategy documents developed Must be reviewed every 6 years.
from time to time to outline the growth expectations in
the council areas. Often undertaken prior to District Plan
changes being considered.
Regional Policy Statement and Regional Plan District Plan
The Regional Policy Statement sets out the framework and A requirement under the Resource Management Act
priorities for resource management in the region. It is a which helps each council manage development in its city,
requirement under the Resource Management Act. Regional town or region. It contains policies and rules related to
plans, district plans and the Regional Land Transport Strategy development.
are required to give effect to the Regional Policy Statement. Must be reviewed every 10 years.
The purpose of regional plans is to assist a regional council
to carry out its functions in order to achieve the sustainable
management purpose. Both must be reviewed every 10 years.
Regional Land Transport Plan Long Term Plan & Infrastructure Strategy
A requirement under Land Transport Management Act. A requirement under the Local Government Act. The LTP sets
Prepared by Regional Transport Committee’s every 6 years out the priorities for 10 years, including what the council will
(reviewed every 3 years). They describe the region's long do, how much it will cost and how it will be funded. It must be
term vision for land transport and identify short-medium reviewed every 3 years. The Infrastructure Strategy covers a
term investment priorities to move toward this vision. They period of at least 30 consecutive financial years. The purpose
also include a regional programme of transport activities is to identify significant infrastructure issues and options for
proposed for funding over the next 3 to 6 years. managing them over the period.
Draft Wellington Regional Growth Framework | 12Part 1 – The current state and our challenges
Part 1 of the Framework outlines what we are as a region, including the current state,
and explains the key challenges identified during the development of the Framework.
Draft Wellington Regional Growth Framework | 131.1 What we are as a region
Regional context
The Wellington-Horowhenua region has an important Today the region increasingly functions as an contain and frame the housing and urban development
role in the prosperity and governance of New Zealand. integrated employment and housing market. It is an footprint – current and future. The ability to move
It is home to the capital, is the country’s second-largest interdependent network of cities, towns and rural easily from the urban areas where people live and work
metropolitan economy, and links the North Island areas, with a modern urban economy paired with a to the natural ‘blue-green’ environment is one of the
and South Island for most freight movements and quality natural and built environment. As the home of things that people who live in this region value highly.
high-voltage electricity transmission. It includes the the capital the region is important to New Zealand as a
core metropolitan areas of the Hutt Valley, Wellington, whole and as an international partner and connector. Wairarapa and Horowhenua also contain important
Porirua and the Kāpiti Coast, and the less urbanised areas of highly productive land, where rural values
regions of Horowhenua and Wairarapa. Large areas of the region are protected in Department such as soil protection, food production and water
of Conservation (DoC) and Greater Wellington quality have to be provided for and balanced against
Regional Council parkland. They provide opportunities urban development. This will need to be carefully
for recreation, and in many parts of the region also considered into the future.
Draft Wellington Regional Growth Framework | 14Current urban area Map 1: Current urban area
Map 1 shows the current urban footprint in the region. 15 Current
It highlights the concentration of the footprint in the
southern part of the region and the concentration of
towns and cities around the two north-south transport
corridors, with limited west-east development and
connections. Levin
This urban footprint has been well established for
many decades and growth has generally followed this
pattern. The population of the region has continued to
grow in the past 20+ years, and in the past five years it
has grown more quickly. The current population of the
Wellington-Horowhenua region is 562,790, compared
with 457,690 in 1996. Paraparaumu
Masterton
After a long period when population growth was Carterton
primarily concentrated in Wellington City and on
Featherston
the Kāpiti Coast, most parts of the region are now
experiencing population growth significantly higher Porirua
than long-term averages. Levin, Carterton and Porirua, Upper Hutt
for instance, have experienced growth rates of 2% or
more in the past three years. Lower Hutt
The current-day urban footprint extends over many sites of Wellington
significance to mana whenua (including pā and kāinga).
The area in the middle of the region where there is
no development tends to be constrained by hills,
mountains, hazards and natural resources such as
rivers and lakes (as can be seen in the maps in Section Current Urban Area
5.4) and also by the limited west-east transport Rail network
connections and access. State Highways
Draft Wellington Regional Growth Framework | 15The region today
Diagrams 5 and 6 provide information on the Wellington-Horowhenua region that is
relevant to this Framework. For a more comprehensive understanding of the region,
see the Framework’s Foundation Report at https://wrgf.co.nz/reports.
Diagram 5: Urban growth context Diagram 6: Growth management performance
3 Urban growth context 4
Size (hectares) 911,300 GDP/capita (2018) $71,622 Housing affordability
Mean dwelling price/
Mean household income 5.5
Deprivation index
(10 highest)
4.9
Population (2018)
WELLINGTON AND HOROWHENUA
562,790
Median dwelling price (2019) $646,000
Housing choice % 1- and 2-bedroom dwellings 30%
Combined public transport and
28%
Population growth
(average last 5 years) 1.4% Transport choice active mode share of trips (2018,
Percentage Māori (2013) 14.25% Wellington region only)
Population growth
0.9%
75%
(average last 20 years) Estimated % of households
Access to opportunities1.2 The region’s challenges
The Framework is a response to the Wellington-Horowhenua region’s current state – Many of the urban areas in the region are vulnerable to the
2
its existing transport network and urban form, environmental impacts, natural hazards, impacts of natural hazards and climate change, and as the region
social and economic inequities, and growth pressures. All these have been identified as grows and becomes more densely settled, it will become
increasingly important to improve resilience and protect and
critical challenges for the region to address if it is to position itself for success in the
enhance the region’s natural environment
second half of this century and realise the direction set by the Framework.
Most of the region, including its existing urban areas, has a significant exposure to
The region lacks sufficient and affordable housing supply and
1
multiple natural hazards, and there is continuing demand to build in coastal and/or
choice, housing affordability is declining and a significant
natural hazard-prone areas.
investment in infrastructure is needed to enable enough housing
and quality urban environments
Sea-level-rise impacts are expected to be felt most significantly in the highly populated
areas along the region’s coastline, including key commercial and industrial areas.
In more and more areas of the region, housing is unaffordable for many people. For
instance, across the region the average rent per week increased by 90.3% between Striking the balance between accommodating urban development and avoiding and
2000 and 2018 and the average house price increased by 74.8% between 2006 reducing current and future risks from hazards, including the impacts of sea-level
and 2018. A lack of supply and a limited choice of housing types and locations are rise and earthquake building resilience, is a key challenge.
limiting options.
Although the region has many large areas of green open space (including regional
The lack of affordability for renters and homeowners has become much more of an parks, the DoC estate and water catchment areas), many of its urban waterways are
issue in the past five years. In 2019 the average house price in Wellington City was significantly degraded.
nine times the average wage.
The natural environment of the region is increasingly under pressure from
This is increasingly contributing to homelessness, overcrowding and poor health and urban development. With high community and regulatory expectations of better
educational outcomes; for example, the percentage of people in the region in severe environmental outcomes (including moving to net zero emissions by 2050), greater
housing deprivation increased by 31.2% between 2001 and 2013. At September 2019 protection of highly productive land and lower greenhouse gas emissions, the region
more than 1600 people had registered for social housing in the region compared with will need to make significantly faster progress, especially in emission reductions.
300 people five years prior – a five-fold increase.
The lack of affordability is also changing the distribution of demand for housing
across the region, pushing more residential growth to outer areas such as Levin and
Wairarapa, and causing the displacement of communities.A major investment in
infrastructure, particularly for three waters and transport, will be required to enable
large-scale housing development in the region.
Draft Wellington Regional Growth Framework | 173 4
There is inequitable access to social,
Mana Whenua and Māori in the region have
educational and economic
poor access to affordable housing choices.
opportunities across the region
While the region overall has a highly productive workforce with high average Māori home ownership rates are lower than those of the overall population of the
household incomes (when compared to the rest of New Zealand), there are Wellington-Horowhenua region. In 2013, 28% of Māori owned their own homes
communities across the region where this is not the case. In these places poor compared to 50% of the overall population of the region.
access to employment and social opportunities imposes additional transport costs
on households experiencing some of the region’s highest levels of deprivation. Data from 2013 also shows that severe housing deprivation was being experienced
by 15 people per 1000 for Māori compared to four people per 1000 for Pākehā.
The ability to access social and economic opportunities is constrained by many
factors. These include the affordability of travel, the lack of well developed, multi- When the analysis of the 2018 Census is completed it is expected to show that rates
modal west-east transport connections, the lack of significant concentrations of jobs of home ownership among Māori have continued to decline as housing has become
outside central Wellington, the jobs that are difficult to access by public transport (such less affordable in the region, and that the rate of Māori experiencing severe housing
as shift work or where people work in multiple locations), and the location of social deprivation has increased since 2013.
infrastructure such as hospitals in places with limited public transport services.
Opportunities to improve Māori housing outcomes are being developed in a range of
emerging partnerships between iwi, the Crown and councils in the region, but a much
greater focus will be needed if housing disparities are to be addressed.
Draft Wellington Regional Growth Framework | 18Part 2 – Iwi in the region
Part 2 of the Framework outlines information about iwi in the
Wellington-Horowhenua region.
Draft Wellington Regional Growth Framework | 19Tuakiri Tāhuhu korero Te taiao
The entire region is a cultural landscape, with the The region is the ancestral home of generations of Te Ao Māori recognises the holistic and interconnected
rohe of mana whenua overlapping to cover the whole Māori tribes, with archaeological sites dating back 650 relationships between people and te taiao (the
region. There are eight project partner iwi, as indicated years. Kupe is generally considered to have been the environment). Whakapapa connects the people to
in the diagram. The rohe of two other iwi, Ngāti Apa first Polynesian explorer to come to this area, followed maunga, moana, awa and marae. These connections
and Rangitāne o Manawatū, also extend over parts of by the Kurahaupō waka (ancestors of Ngāi Tara, to ancestral lands create tribal identities and rohe.
Horowhenua. Rangitāne, Muaupoko, Ngāti Apa and Ngāti Ira) and the
Tākitimu waka (Ngāti Kahungunu). Migrations of Tainui Māori relationships with the environment are governed
Wellington’s earliest name, Te Upoko o Te Ika a Māui and Taranaki tribes to the region followed. by the direct identification of the physical world as
(the head of the fish of Māui) comes from the story of being fundamental to and synonymous with human
how Aotearoa was created. Legendary navigator Māui The arrival of Europeans saw increasing conflict and identity and wellbeing. Physical and natural elements,
hooked a giant fish, which turned into the landform resulted in the alienation of the majority of Māori such as the central mountainous spine and key
now known as Te Ika a Māui. land in the region by 1864. The current-day urban lakes, islands and harbours, also play a strong part in
footprint extends over many sites of significance to wairuatanga. Some of these can be seen in Map 2.
mana whenua (including pā and kāinga). As a result,
many mana whenua sites are now inaccessible for Four partner iwi, plus Ngāti Apa and Rangitāne o
or unusable by iwi for their traditional purposes. Manawatū, have reached Treaty settlements with the
Identified Māori heritage and archaeological sites are Crown. These iwi are:
represented on Map 2.
• Taranaki Whānui ki Te Upoko o Te Ika in 2008.
• Ngāti Raukawa in 2012.
• Ngāti Toa Rangatira in 2012.
• Rangitāne o Wairarapa and Rangitāne o Tamaki
Nui-ā-Rua in 2016.
However, there are a number of outstanding Waitangi
Muaūpoko Tribal
Authority Tribunal claims that relate to public land in the region.
Ngāti Raukawa The distribution of statutory acknowledgements is
Rangitāne o
Ngā Hapū o Ōtaki Wairarapa represented on Map 2.
Te Ātiawa ki Whakarongotai Ngāti Kahungunu ki
Wairarapa The Framework recognises the special relationship
Ngāti Toa Rangatira
that tangata whenua have with the environment and
Taranaki Whānui
their role as kaitiaki.
Draft Wellington Regional Growth Framework | 20Map 2: Sites of significance for mana whenua, co-management areas and Māori land in the region
NZAA Archsites (Māori)
Heritage NZ List (Māori)
Co-Management Areas Foxton
Māori Sites and Areas in District Plans
PNRP Schedule B - Ngā Taonga Nui a Kiwa
Ngā Whenua Rāhui Levin
Māori Land Parcels
Statutory Acknowledgement Areas*
Land outside of study area
Rail network
Ōtaki
State Highways
Territorial authority
boundaries
Paraparaumu
Masterton
Porirua
Upper Hutt
Lower Hutt Martinborough
Wellington
*Additional statutory
acknowledgements
include sea and river
locations
Draft Wellington Regional Growth Framework | 21Te tangata Mahitahi
Iwi, hapū and whānau have distinctive histories and It is recognised that each iwi has its own priorities The Framework has built on established relationships
values that contribute to our region’s rich cultural and perspectives, and that ongoing work is needed to and partnerships in the region. The Framework
heritage. The region is home to a thriving Māori reflect the perspectives of all mana whenua. partnership team is actively including mana whenua
economy and mana whenua, as kaitiaki, work in in regional spatial planning, reflecting mana whenua
partnership with local and central government to co- A key initiative identified in the Framework is the perspectives and giving life to the aspirations of iwi.
manage several areas in the region. development of an iwi spatial plan, to bring together Some of these aspirations are presented in Diagram 7.
mana whenua values and knowledge to determine their
Māori communities in the region are relatively young collective aspirations in relation to the spatial form of Active engagement and collaboration with project
and face a number of challenges. These include the region. This will directly inform future updates of partners has been central to the development of
lower rates of housing ownership, lower average the Framework. the Framework. However, further work is required
earnings and qualifications held, and higher levels of to ensure all mana whenua are represented as the
unemployment compared to the non-Māori population, Other key initiatives include: Framework evolves.
as well as less access to tertiary education facilities
and/or employment opportunities. More than half of • Supporting the implementation of the Ruruku Through the key initiatives and projects, the
Māori adults in the region do not speak te reo Māori. report ‘Te Matarau a Mauī: Collaborative Pathways Framework seeks to support new ways of doing things
to Prosperous Māori Futures’. and thinking that improve the outcomes for tangata
whenua, address the challenges facing the region’s
Ngā wawata me te mahitati • Establishing capacity-building training to strengthen
iwi involvement in regional and local planning. Māori communities and support the rich cultural
Kaupapa principles of ki uta ki tai, wairuatanga, identities in the region.
• Partnering to deliver improved housing, urban
kaitiakitanga, tō mātou whakapono and mahitahi have development and economic development
informed the development of the Framework. outcomes for iwi/Māori housing – including
papakāinga and affordable housing options.
Working in partnership with iwi across the region,
• Planning and undertaking projects regionally to
a number of mana whenua aspirations have been
address the urban development impacts of climate
highlighted. These are summarised in Diagram 7.
change, including the impacts on coastal heritage.
This dialogue has taken place alongside other work • Enabling marae to play a strong role in walkable
involving the project partners in the region, including neighbourhoods.
Ruruku (a partnership to develop a Māori economic
development plan for the region).
Draft Wellington Regional Growth Framework | 22Diagram 7: Mana whenua aspirations regarding this Framework
Bringing to life and reimagining regional partnerships and
governance, resourcing iwi capacity to participate
Development of an iwi-led spatial plan for the region,
sharing technical resources including GIS mapping and
planning expertise
Improve opportunities for Māori economic development
and prosperity, indigenous procurement
Marae based social, community and cultural hubs
Ngā
Wawata Improving access to affordable housing in urban and rural
areas, papakāinga, developing Māori land
o te Iwi
Better reflect cultural identities through urban renewal and
decolonising places
Revitalisation of traditional cultural practices, and ability
to exercise customary rights.
Skilled and educated whānau, revitalisation of te reo
Protection of taonga, cultural heritage and te taiao; and
ability to exercise kaitiakitanga
Improving health outcomes, spiritual, physical, cultural,
wellbeing centred around whanaungatanga
Climate change mitigation and protecting
coastal heritage at risk
Draft Wellington Regional Growth Framework | 23Part 3 – Key moves
Part 3 of the Framework outlines the key moves that will individually and collectively
make a difference in this region.
Draft Wellington Regional Growth Framework | 243.1 The region’s key moves
32a Walkable Neighbourhood
The Wellington-Horowhenua region’s key urban Green
development opportunities in the next 30 years are to: spaces, Community
community gathering
gardens and access spaces, marae,
Local
to the natural cultural centres,
• Increase housing supply and improve environment libraries
health
Local Connections services and
housing affordability and choice in walkable shops, food
spaces
with cultural Māori health
neighbourhoods. stores, cafes, identity and providers
entertainment sites
• Increase housing density in high-quality urban opportunities
Walkable Walkable,
environments to support community wellbeing. Well-
neighbourhood safe and
connected Broadband pleasant streets
• Partner with iwi and Māori across the region to safe cycling and mobile that ensure Well-
networks connectivity connectivity and connected
deliver improved housing and economic outcomes. mobility for all local public
ages and transport
• Enable growth that protects and enhances the abilities
Multi-purpose
quality of the natural environment and accounts spaces which
can accommodate
for a transition to a zero-carbon future. activities for different Local
age groups and employment
• Improve multi-modal access to and between abilities. opportunities
Ability to
housing, employment, education and services, age in
place Parks and
with a particular focus on a significant step Waiora, clean playgrounds, Schools,
and healthy swimming early education,
change in mode share for public transport and environment; pools, sports Māori
Affordable immersion and
active modes. air, water and housing and and recreation
childcare
soil quality, housing spaces
effective waste centres
• Encourage a more sustainable, resilient and disposal
diversity,
papakāinga
affordable urban form that makes efficient use of
existing infrastructure and resources.
• Build climate change resilience and avoid
What is ….a walkable neighbourhood? Not every walkable neighbourhood in the
increasing the risks and impacts of natural hazards.
region will be the same or have all the
• Create more easily accessible employment This is also sometimes referred to as a same services but they will be high quality
opportunities. 10-20-minute village or neighbourhood. The environments.
concept is about “living locally” – where
people can access most of their daily needs Examples of services people might be able to
within a walkable distance from their home. access within a walkable neighbourhood are
Walkable distances can also be accessed by – your local primary school, a local park, some
other transport modes such as safe cycling health services, some community facilities and
routes and local public transport options. retail that is more than a dairy.
Draft Wellington Regional Growth Framework | 25What is.. multi modal? What is … housing density?
You may see this term used in this and other reports such as the Wellington This refers to the number of houses or dwellings in or on a certain area, often
Regional Mode Shift Plan. ‘Multi-modal’ refers to the transport system expressed as the number of dwellings per hectare or a density related to m2.
addressing the needs of all roads users, including pedestrians, cyclists, people The higher the number of dwellings per hectare, the higher the density.
using public transport (bus or train), freight vehicles and private passenger
vehicles. The term ‘active modes’ generally refers to walking and cycling, but Medium-density housing for instance is defined by the Ministry for the
can also include scootering, skateboarding etc. Environment as a density of less than 350 m2 per unit. It can include
standalone dwellings, semidetached or duplex dwellings, terraced housing
or apartments. For more on this see the National Policy Statement on Urban
Development 2020.
What is.. zero carbon?
The Wellington City Council “Te Atakura- First to Zero” plan defines zero carbon
as - that we can balance the activities that do produce carbon emissions
What is … typology?
against the activities that capture carbon. This effectively means our overall
impact on the climate is zero. The classification of building, space usage and design features. Housing
typology is the classification of house designs, sizes and styles. This
application could be general (e.g., ranches, split levels, colonials, etc.) or
specific to an area/city/town (e.g., in this city, the majority of houses are in
one acre plots and built as one storey).
What is… ‘rapid transit?’
The National Policy Statement on Urban Development defines a ‘rapid transit
service’ as any existing or planned frequent, quick, reliable and high-capacity
public transport service that operates on a permanent route (road or rail) that is
largely separated from other traffic.
Draft Wellington Regional Growth Framework | 26The region can capitalise on these opportunities by implementing the following key moves:
1 Harness growth to make the region’s housing and urban areas more
affordable and liveable and provide more housing choice – ‘walkable
neighbourhoods’
4 Unlock new areas for housing and urban development and
deliver greater regional resilience with a major west-east
multi-modal corridor
By providing for, and when appropriate actively partnering (Urban Explore the potential for a major multi-modal west-east corridor (or
Development Authority powers) to deliver quality and more intensive vibrant corridors) that unlocks new areas for housing and urban development,
mixed use urban development – where people can get a large percentage of improves access to social and economic opportunities across the
their daily needs met locally (walkable neighbourhoods), in locations with region (including employment and freight movement) and significantly
good access to rapid transit or high frequency public transport in both Future improves resilience.
Urban Areas (greenfield) and urban renewal areas (brownfield).
2 Make better use of the region’s limited supply of well-located
greenfield land
5 Deliver transformational housing and development outcomes
for iwi/Māori
By undertaking future urban area development differently we can ensure that By partnering with iwi, the Crown and councils to deliver
more housing is delivered at medium and higher densities (such as terraced transformational housing, urban development and economic
housing or apartments), and that new development is built to support development outcomes for iwi/Māori.
multi-modal transport options for residents, with an emphasis on being rapid
transit orientated where it is easy to access rapid transport services.
3 Fully unlock the urban development potential of current and future
rapid transit orientated corridors particularly the Let’s Get Wellington 6 Address the urban development challenges of climate change and
transitioning to a zero-carbon economy at a regional scale
Moving corridor. By planning and undertaking projects regionally to address the urban
By leveraging our existing rail network and new investment in rapid transit, development impacts of climate change, particularly impacts on
particularly on the Let’s Get Wellington Moving corridor, to deliver infrastructure and where people live and work and work to transition to a
transformational urban development including density changes and more zero-carbon economy.
affordable housing choices.
Draft Wellington Regional Growth Framework | 27Part 4 – Going forward
Part 4 of the Framework outlines the region’s future
growth scenario as well as outcomes and indicators in
order to take advantage of the region’s opportunities
and address its challenges.
Draft Wellington Regional Growth Framework | 284.1 The growth scenario
Wellington-Horowhenua is growing Map 3: Conceptual illustration of residential density
and development
The Wellington-Horowhenua region is growing faster than it has done for many decades,
and is facing immediate and longer-term housing supply and affordability, urban 13 Nodes - Resi
development and infrastructure challenges.
The Framework has been developed by considering:
Levin
5/57 Fernleigh Street
• The population projections for the region, which suggest a population increase
of 91,000-151,000 6 in the next 30 years.
• A growth scenario where there is a future regional population of 760,000. This is
200,000 people on top of the current population.
• An increase of 100,000 jobs in the 30-year period. Paraparaumu
Masterton
While there is uncertainty as to when, how and at what rate the region could reach
this population figure, the Framework is intended to provide for an urban structure for
this population size. It is important to note this is not a growth target for the region. Porirua
Upper Hutt
Map 3 is a conceptual view illustrating the gradual transition of residential development
and density across the region under this scenario over time. The higher-density Lower Hutt
development is clustered around development locations supported by passenger rail Wellington
and/or future rapid transit, with intensification occurring along existing and planned
transport corridors.
The map shows the envisaged growth scenario across the region, with greater Lower density Higher density
density (more dwellings per hectare) represented by a darker blue and areas with Rail network
State Highways
lower density shown in a paler red. Future Highways
6
These numbers have been derived from a combination of Stats NZ forecasts and Housing and
Business Development Capacity Assessments – see https://planningforgrowth.wellington.govt.
nz/__data/assets/pdf_file/0020/3287/Wellington-Regional-HBA-Chpt-1-Regional-Summary.pdf
for more information on the Housing and Business Development Capacity Assessments.
Draft Wellington Regional Growth Framework | 29Elements of the growth scenario
The proposed urban form for the region is a mix of both Of the 88% of housing growth coming from areas
high-density growth in and around key centres and in identified in the Framework:
the walkable catchments of future rapid transit stops
and other railway stations and bus hubs across the • One-quarter is expected to be accommodated in
region, and increased densities in Future Urban Areas. Wellington City (excluding Tawa), including the
Let’s Get Wellington Moving (LGWM) corridor 8.
Approximately two-thirds of the growth is expected • Nearly one-third is expected to be accommodated
to occur in Urban Renewal Areas in existing urban in the eastern corridor from Lower Hutt to
areas through infill, urban renewal and intensification. Masterton. Just over one third of the growth in this
Approximately one-third of the growth will be in Future corridor is expected to be in the Wairarapa.
Urban Areas, extending the current urban footprint of
• The remainder (just over 40%) is expected to be
the region. While Future Urban Areas can be expected
accommodated in the western corridor from Tawa
across the whole region, a large proportion of this type
to Levin.
of growth will be in the western corridor in areas from
Porirua to Levin. The potential housing and urban development capacity
of any future west-east multi-modal corridor(s) has yet
Our current understanding is that, regionally, 88% to be fully determined.
of housing growth will come from areas we have
identified in the Framework, and 12% will come through The Framework outlines spatially where growth might
business-as-usual infill (including incremental, smaller- occur, but also focuses on the type of growth envisaged,
scale Future Urban Areas – greenfield developments) for instance the density and urban design aspects.
throughout the region, with just over half of this infill
being in Wellington City.
8
See https://lgwm.nz.
Draft Wellington Regional Growth Framework | 304.2 Building communities and neighbourhoods
The Framework sets out critical spatial elements that Placemaking applies as much to enhancing existing Housing affordability and choice
will help to create well-functioning and ‘liveable’ urban communities as it does to new ones. This is important
environments – places where people want to live, work in the context of this Framework given that we are Providing housing for all people will be critical to
and play, and where people have easy and affordable expecting approximately two-thirds of growth to occur creating a liveable region. This includes meeting
access to housing, services, amenities, open space and in existing urban areas. people’s housing needs, including through affordable
jobs. We describe these as walkable neighbourhoods. housing choices and avoiding the negative impacts of
The Framework seeks to ensure that developments gentrification and displacement.
contribute to liveability and placemaking through
Liveability and placemaking The Framework has a strong focus on improving
spatial elements such as:
housing outcomes. Enabling increased urban densities
Liveable urban areas can make a major contribution
• Providing for a high-quality public realm and in existing communities is not intended to displace
to people’s quality of life. A well-planned urban
open spaces as core spatial features – including existing residents.
development can meet housing needs, provide
the blue-green network that supports local and
affordable housing choices, improve access to
regional sustainability and wellbeing e.g. water- At present there is a lack of sufficient housing choice
employment, education and services, and support
sensitive urban design elements. and diversity in the right locations. Demographic
healthy, connected and cohesive communities.
changes, such as projected increases in the number of
Liveable areas are resilient and can adapt to changes • Planning for a future where all new developments
single-person households, mean that housing needs
over time. are focused on active mobility and access to
will change over time. It is important to consider
public transport, so there is easier access to jobs,
aspects such as ensuring young people can afford to
Placemaking contributes to liveability by creating great services and amenity.
live in the neighbourhoods in which they grow up.
places that strengthen local character and diversity • Ensuring Wāhi Toitū areas 9 are considered in all
and develop a sense of place for each area. Prioritising new developments as a way of creating resilient Enabling a range of locations for housing, at a range
a people-friendly public realm, open spaces and communities where the risk of hazards is reduced of densities and providing for different types, will
walkable neighbourhoods can support major centres and where the local context, such as culturally and increase the diversity of the housing stock, enabling
and nodes, improve access to social infrastructure and historically important features, is respected. more people to access the homes they need in existing
amenities and result in improved health outcomes.
neighbourhoods. Enabling papakāinga housing and
other housing options through which Māori can
Placemaking includes creating communities that are
express their cultural traditions and norms is another
easy to navigate on foot and by cycle (or other micro-
key element in providing for housing choice.
mobility means). This helps to create neighbourhoods
that are safe, comfortable and interesting. Walkable
neighbourhoods support more prosperous local
businesses and healthier communities by making it
9
For information on this, see the Constraints – Wāhi Toitū and
Wāhi Toiora section of the report.
easy and safe to be active.
Draft Wellington Regional Growth Framework | 314.3 The benefits of urban development and a denser urban form
Benefits of urban development Benefits of a denser urban form
Doing Density well
The majority of New Zealanders and those in the Government policy supports increased density in
Wellington-Horowhenua region live in towns and cities. urban areas in certain locations. The NPS-UD requires Providing for density is not just about providing
As growth in urban areas is expected to continue, it is councils to provide for more intensive developments for more housing but also ensuring this is done
important to get our towns and cities to look and feel around urban centres and in locations where well and with people and communities at the
right. Ensuring that this long-term growth produces forefront of planning. For the Framework this
accessibility by public or active transport is high and is about providing places where people want to
benefits for existing and future residents is critical to the
where there is demand for housing and business use. live and be part of a community. This requires
prosperity, sustainability and liveability of this region.
thought about how to connect people to the
The Framework has been prepared taking these
A 2019 report prepared for the Ministry for the places they live and work through good design of
requirements into account. The benefits of a denser
Environment investigated the costs and benefits of both housing and the open and urban spaces.
urban form can be maximised if it is located where
urban development. It found that urban development there is demand for housing and good accessibility to If all the benefits above to the transport system,
generates significant agglomeration benefits that public and active transport and jobs and services. business and the environment are achieved but
support higher productivity and incomes and a greater we don’t build density well for people who live in
variety of consumption opportunities. it, then this is not a great outcome.
Apart from some locations in Wellington City,
The Framework is a tool to help facilitate these positive
the region does not currently have many areas
urban growth benefits in the long term. It identifies a
of significant medium or higher-density housing.
range of opportunities to enhance competitive land
There are some great examples, but not at scale.
markets. Future Urban Renewal Areas are located
in places where the current and future transport
infrastructure will provide a high-quality public transport
network with a compact urban form that accommodates
long-term growth and provides high-quality social,
cultural, economic and environmental outcomes.
Draft Wellington Regional Growth Framework | 32You can also read