CONNECTING THE TOP OF THE SOUTH - TASMAN REGIONAL LAND TRANSPORT PLAN 2015-2021
←
→
Page content transcription
If your browser does not render page correctly, please read the page content below
CONNECTING THE TOP
OF THE SOUTH
TASMAN REGIONAL LAND
TRANSPORT PLAN

2015-2021
Record of amendment

Amendment Description of change                                                      Effective       Updated by
number                                                                               date

1          Minor editorial amendments following consultation and a Joint Regional    23 February     Sarah Downs
           Transport Committee workshop held on 17 February 2015.                    2015

2          Update to the forward works programme                                     3 March 2015    Jenna
                                                                                                     Voigt/Sarah
                                                                                                     Downs

3          Final approved plan                                                       1 July 2015     Robyn Scherer

4          2018 Mid-Term Review

5          Mid-term review – for community consultation                              20 January      Drew Bryant
                                                                                     2018

6          Mid Term Review changes made following consultation and release of 2018   24 April 2018   Drew Bryant
           Draft GPS

7          Mid Term Review – Changes made following RTC recommendations              14 May 2018     Drew Bryant

                                                          Tasman Regional Land Transport Plan                Page i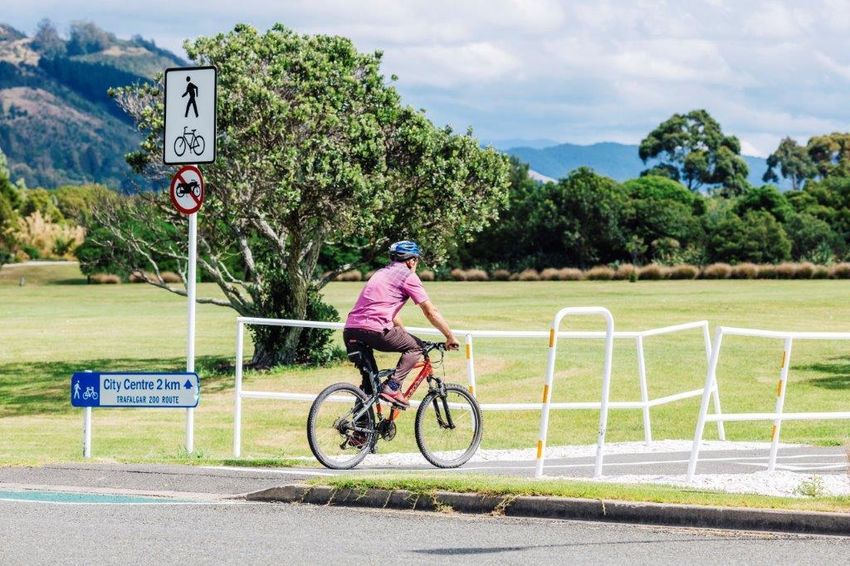
Executive Summary
This document is a mid-term review of the six year plan that was developed initially for the
New Zealand Transport Agency’s National Land Transport Programme 2015–18. This Plan is
also current for the 2018-2021 National Land Transport Programme.

The main purpose of the Regional Land Transport Plan is to set out the region’s land
transport objectives, policies and measures for the next 10 financial years using national
funding. In developing this plan the Top of the South aspirations have been aligned with the
national outcomes as outlined in the Draft 2018 Government Policy Statement on Land
Transport, however it may be necessary to vary the plan when the second stage GPS is
released in 2019.

The Top of the South councils, in partnership with the New Zealand Transport Agency, have
collaborated to develop a joint Regional Land Transport Plan that aims to provide the
community with an efficient, safe and resilient road network. This Regional Land Transport
Plan considers the economic drivers for the Top of the South with horticulture, viticulture,
forestry, seafood, farming and tourism being the main areas driving our economic growth.
All three areas are experiencing significant growth. Nelson City continues to be the largest
urban area within the region for employment, the State Highway 1 route through
Marlborough District is the highest use freight route in the South Island and Tasman District
is experiencing significant residential and commercial growth.

The key problems and benefits from solving those problems for land transport in the Top of
the South have been determined collaboratively using Treasury’s Better Business Case
principles. Four key problems are summarised below along with how they map to the draft
2018 GPS:

        Problem Statement                               GPS Alignment

    Constraints on the transport network
    are leading to delays affecting freight,     Access (provides increased access to
      tourism, business and residential          economic and social opportunities)*
                    growth.

   Lack of redundancy, and susceptibility of
    the network to the impacts of climate
   change and high impact natural hazards
    increases the risk of losing community                Access (is resilient)*
        connectivity and impacting the
                   economy.

    Driver behaviour and unforgiving roads     Safety (is a safe system free of death and
   lead to unacceptable levels of death and                  serious injury)*
               serious injuries.

    Roads and footpaths do not currently
        meet all the needs of our ageing         Access (enables transport choice and
   population, walkers and cyclists thereby                    access)*
     creating barriers to those wishing to
    ultilise alternative modes of transport.

                                                             Tasman Regional Land Transport Plan, Page ii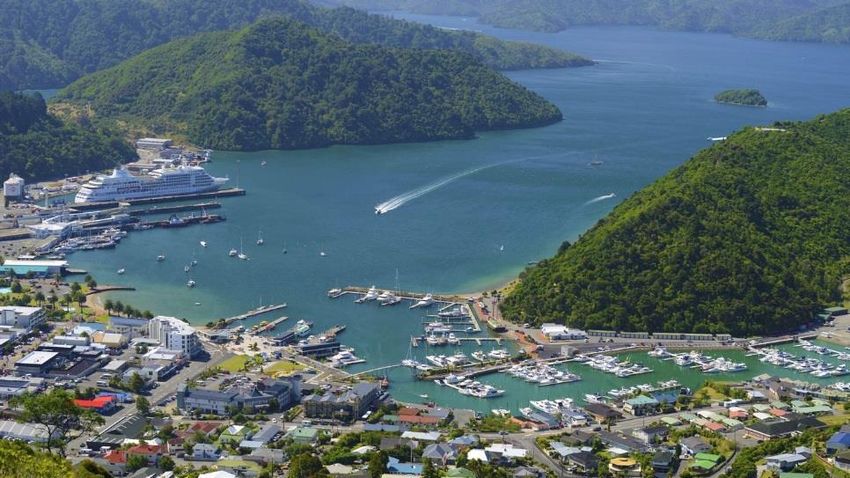
* The daft GPS 2018 supporting priorities of ‘value for money’ and ‘environment’ support
each of these problem statements.

Further detail on the key transport issues and challenges are presented in Part C of this
plan.

All three councils recognise that we are highly interdependent on each other for our
economic and social welfare. The Top of the South economy is highly dependent on its
transport network as there is no rail alternative for Nelson and Tasman so the need for
resilience, reliability and safety along key journey routes is vital.

Evidence and discussion on the key problems and issues is discussed in Part C and the
strategic response and projects that respond to the identified problems are listed in Part E.

Part F outlines the specific land transport issues that Tasman District faces and how we
intend to deal with these issues. Part F also includes a programme of forward works for the
next ten years for both local roads and the State Highway network to provide the complete
picture of the works planned over the next ten years in Tasman District.

In the Tasman District, Connecting Tasman 2010 is our main strategy document on land
transport. The aim is to have a ‘land transport system that will support a sustainable and
prosperous economy that is accessible by and serves the whole community contributing to
the better health, safety and wellbeing of those living in and visiting the Tasman region’.

There is a continued focus on the journey, enabling people and freight to travel safely and
efficiently. Safety remains at the forefront, with our commitment to Safer Journeys, New
Zealand’s Road Safety Strategy 2010–2020, making our state highways and local networks
increasingly free of death and serious injury.

Part G contains the Tasman Regional Public Transport Plan. It details the public transport
services that are integral to the public transport network, the policies and procedures and
the information and infrastructure that support public transport.

The Tasman Regional Land Transport Plan was published on 1 July 2015 and this mid-term
review was published on 1 August 2018.

Copies can be found at any Council office or library.

                                                        Tasman Regional Land Transport Plan, Page iii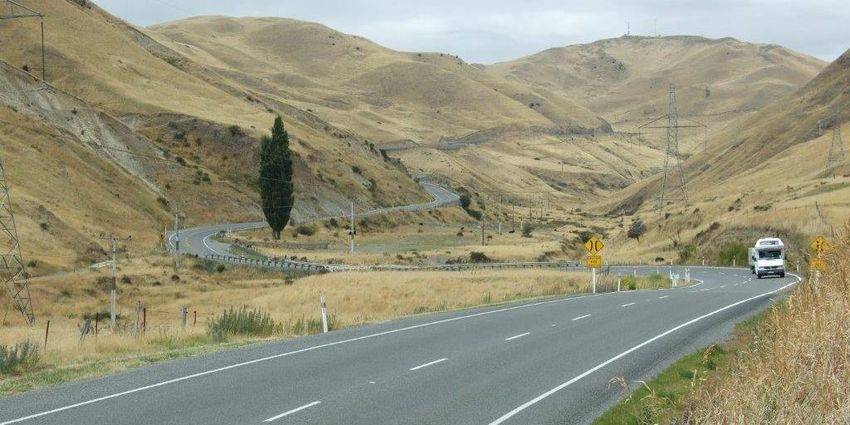
Foreword- South Island Chairs Working Group
The top of the south Regional Transport Committee Chairs from Marlborough, Nelson and
Tasman have been involved in a South Island wide working group.
South Island Regional Transport Committee Chairs recognise that South Island regional
economies and communities are interconnected, with critical freight and visitor journeys
crossing regions, and extending along and across the South Island, and connecting to both
Stewart Island and the North Island.
The South Island has a relatively small and dispersed population of around one million.
Christchurch is the largest urban area and is centrally located, and there are several other
main centres located throughout the island. Small communities are often at a significant
distance from main centres, and depend on the products transported to their locality every
day, as well as the ability to move products to be processed, distributed and exported. This
makes the resilience of transport linkages between South Island communities of critical
importance.
The efficient movement of both goods and people is essential to the South Island’s
economy, as well as the social and economic wellbeing of its residents. The majority of
freight is moved by road, with substantial freight growth being projected. Freight demand in
the South Island is currently driven by a mix of primary sector and export growth, as well
as population change. There has also been significant growth in the tourism sector, with the
South Island recognised as a tourism destination in its own right. These critical freight and
tourism journeys do not stop at regional boundaries – they extend across the South Island.
In this context, the South Island Regional Transport Committee Chairs Group was
established with the purpose of significantly improving transport outcomes in the South
Island, to help drive our economy and better serve our communities, through collaboration
and integration. Chairs agree that they can make greater progress toward realising common
goals if they work together.
The three key collaborative priorities for the Group are to:
1. Identify and facilitate integrated multi-modal freight and visitor journey
improvements (including walking and cycling journeys) across the South Island.
2. Advocate for a funding approach which enables innovative and integrated multi-
modal (road, rail, air, sea) solutions to transport problems, and small communities with
a low ratepayer base to maintain and enhance their local transport network.
3. Identify and assess options for improving the resilience and security of the transport
network across the South Island, as well as vital linkages to the North Island.
South Island Chairs Regional Transport Committee Working Group
Tasman Regional Land Transport Plan, Page iv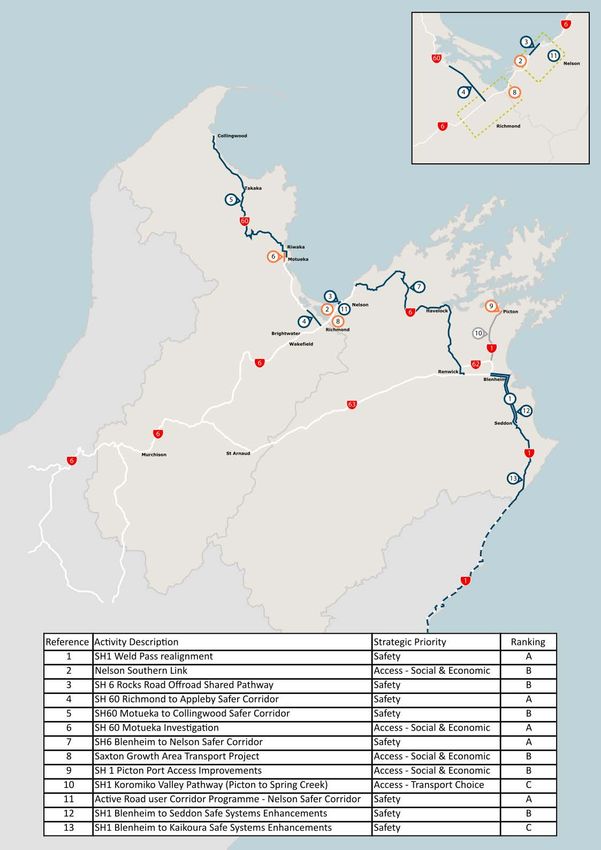
Foreword-                Tasman Regional Transport Committee Chair

Land transport plays a critical role in connecting our community by providing access to
employment, education, recreation and services, as well as enabling the movement of
freight in support of business and industry.

The Regional Land Transport Plan (RLTP) is a critical document for the Tasman District as it
underpins all of the District’s road network and transportation planning and investment
priorities over the next three years on both the State Highway and local road networks.
This document is the 2018 mid-term review of the original 2015 RLTP document. From a
statutory perspective, the RLTP meets the requirements of the Land Transport Management
Act 2003 and contributes to the overall aim of the Act.

A core requirement of the RLTP is that it must be consistent with the strategic priority and
objectives of the Government’s Policy Statement on Land Transport and the National Energy
Efficiency and Conservation Strategy.

Tasman District includes 333km of State Highways and 1,680 km of local roads through
diverse and often challenging topography from the mountains to the sea. There are
currently no viable alternatives such as rail, thus the social and economic wellbeing of our
people is dependent on an efficient and effective road network. If the Tasman District is to
continue to grow and prosper it needs an efficient multi-modal transport system.

This 2018 mid-term review continues to take a “Top of the South” perspective looking at
issues, objectives and significant projects in partnership with our neighbours Marlborough
District and Nelson City, but also introduces the great work that the South Island Regional
Transport Committee Chairs group is doing to facilitate integrated multi-modal freight and
visitor journeys, advocate for funding approaches that work for the South Island context
and improve South Island transport resilience.

Tasman District Council has significant challenges around debt and affordability and some of
the hard decisions we made in 2015 on the local road network to reduce the level of
transport funding are proposed to continue through for the next three years of this plan. It
is certainly a challenge, however we have the systems and people in place to deliver our
core transportation requirements to provide you with a safe and efficient transport system.

In Richmond on Gladstone Road and the Richmond Deviation there is an issue of congestion
and this congestion is clearly evident at peak times and extends through Nelson. It is also
forecast to increase as our population and businesses activities continue to experience
strong growth. Thus there is a real need to increase access during peak periods on the key
regional corridor between Three Brothers Corner in Richmond and Queen Elizabeth Drive
adjacent to Port Nelson to enable efficient journeys within and through this high growth
area.

The recent change of Government has resulted in a change in national land transport
priorities. There is a greater focus on public transport, walking and cycling. Government
have also signalled that this aligns well with Council’s own priorities, but does add a level of
uncertainty until such a time as we see the second stage of the Government Policy
Statement on Land Transport.
And finally, thanks go to all those who have had input into the development of the RLTP,
specifically the community input that has helped refine this plan, our neighbouring Regional
Transport Committees of Nelson and Marlborough and the South Island Regional Chairs
Group.

                                                          Tasman Regional Land Transport Plan, Page v
Cr Stuart Bryant

Chairman
Tasman Regional Transport Committee

                                      Tasman Regional Land Transport Plan, Page vi
Contents
Record of amendment .......................................................................................................................... i

Executive Summary.............................................................................................................................. ii

Foreword- South Island Chairs Working Group ................................................................................. iv

Foreword- Tasman Regional Transport Committee Chair ................................................................. v

Part A – Introduction and Purpose ................................................................................................ 1

Part B – Government Policy Statement & the RLTP ................................................................ 2
        B1 Relationships between Land Transport Documents .............................................................. 2
        B2 The Government Policy Statement on Land Transport 2015/16-2024/25.............................. 3
        B3 The National Land Transport Programme ............................................................................... 5
        B4 Regional Land Transport Plan .................................................................................................. 5

Part C – Top of the South Key Issues and Context ................................................................. 6
        C1 Introduction ................................................................................................................................. 6
        C2 Regional Transport System Problems and Opportunities ..................................................... 7
        C3 Regional Context ........................................................................................................................ 8
        C4 Key Journey Routes ................................................................................................................. 13
        C4 Problem Statement Evidence .................................................................................................. 14
        C6 Inter-Regional Issues ............................................................................................................... 17

Part D – Agreed Top of the South Objectives .......................................................................... 18
        D1 Top of the South significant activities to be funded from sources other than the National
        Land Transport Fund ..................................................................................................................... 18
        Table 2 – Significant activities not funded by the NLTF ............................................................ 18
        D2 Objectives, Policies and Measures ......................................................................................... 18
        Table 3 – Draft GPS objectives and the agreed Top of the South objectives, policies and
        measures of success ..................................................................................................................... 19

Part E – Top of the South Significant Activities ...................................................................... 20
        Table 4 – Agreed Top of the South Significant Activities .......................................................... 21

Part F – Tasman District Council’s Regional Land Transport Plan .................................. 25
        Introduction .................................................................................................................................... 25
        Key Issues for Tasman District ..................................................................................................... 26
        Objectives, Policies and Measures .............................................................................................. 30
        Table 5 - Draft GPS objectives and the Tasman District Council objectives ........................... 30
        The 2018/19 to 2025/26 Programme ............................................................................................. 33
        Table 6 - Activities proposed within Tasman District (Refer Table 4 for significant Tasman
        and inter-regional activities) ......................................................................................................... 34
        Table 7 - Maintenance Operations and Renewal Activities proposed within Tasman District
        .......................................................................................................................................................... 36

                                                                                                 Tasman Regional Land Transport Plan, Page vii
Table 8 - Activities already approved ........................................................................................... 40
Part G – Regional Public Transport Plan ................................................................................... 41
G1 Executive Summary ................................................................................................................. 42
G2 Introduction ............................................................................................................................... 43
G3 Purpose ..................................................................................................................................... 43
G4 Objectives of the Public Transport Plan ................................................................................ 44
G5 Funding ..................................................................................................................................... 44
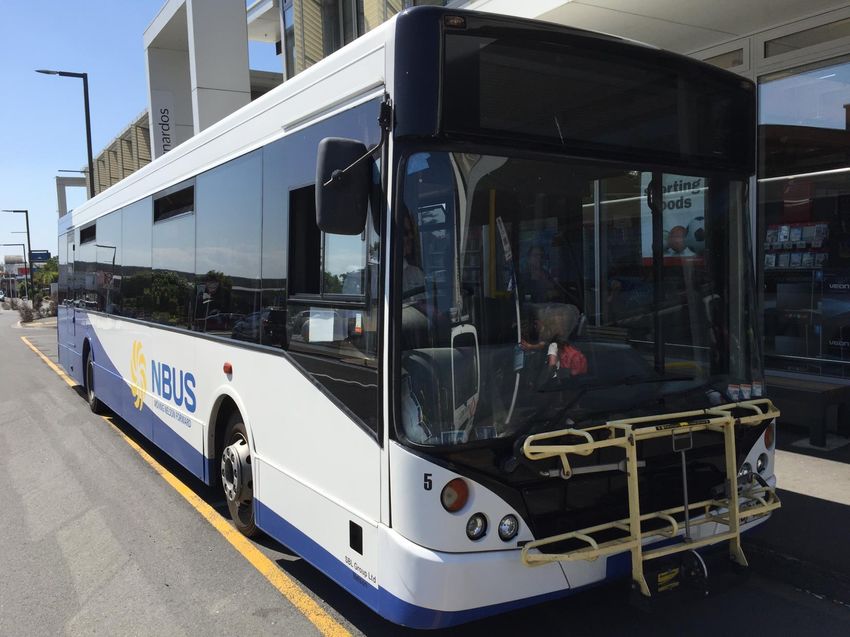
G6 New Public Transport Operating Model ................................................................................. 45
G7 Public Transport Services provided by Nelson City Council and available in the Tasman
District ............................................................................................................................................. 46
G8 Community Transport Services .............................................................................................. 47
G9 Future Improvements ............................................................................................................... 48
G10 Units ......................................................................................................................................... 48
G11 Value for Money ...................................................................................................................... 49
G12 Working with Contractors ..................................................................................................... 49
G13 Fares ........................................................................................................................................ 49
G14 Integration with other Transport Modes .............................................................................. 50
G15 Infrastructure .......................................................................................................................... 50
G16 Monitoring ............................................................................................................................... 50
G16 Significant Policy.................................................................................................................... 50
G17 Legislative Requirements ...................................................................................................... 52
Appendices ............................................................................................................................................ 54
Appendix 1 - Legislative Context .................................................................................................. 55
Appendix 2 - Significance Policy .................................................................................................. 57
Appendix 3 – Monitoring and Performance Measures ............................................................... 58
Table 8 - Regional Monitoring Indictors and Targets ................................................................. 58
Table 9 – Tasman Monitoring Indictors and Targets .................................................................. 59
Appendix 4 – Assessment and prioritisation .............................................................................. 61
Appendix 5 – Significant Projects Description ........................................................................... 63
Appendix 6 - Compliance with Section 14 of the Act – Alternative Objectives and National
Energy Efficiency and Conservation Strategy ............................................................................ 76
Appendix 7 - Relationship with Police Activities ........................................................................ 77
Appendix 8 - Consultation ............................................................................................................. 79
Appendix 9 – Glossary of Terms .................................................................................................. 80
Tasman Regional Land Transport Plan, Page viii
Part A – Introduction and Purpose
This document sets out the forward works programme, maintenance and operations and
other land transport activities that forms part of the funding submission to the New Zealand
Transport Agency (the Transport Agency) and the National Land Transport Fund.

The ‘Top of the South’ councils, being Marlborough District Council, Nelson City Council and
Tasman District Council are all unitary authorities. They undertake the functions of both a
regional council as well as a territorial authority. Each council is required under the Land
Transport Management Act 2003 (the Act) to prepare a Regional Land Transport Plan
(RLTP). This is required every six years with a review every three years. The purpose of this
document is to provide an integrated approach to land transport planning across the local
government boundaries in the Top of the South region.

Each RLTP must include a ten year forward works programme that sets the direction for the
transport system as part of the RLTP. It identifies what is needed to contribute to the aim
of an effective, efficient, safe and sustainable land transport system for the public interest.
This RLTP will help the Top of the South councils meet the objectives of the Act and
determine and secure investment for the entire transport system. The RLTP’s purpose (once
investment in the transport network has been secured) is to benefit the Top of the South
communities by providing a resilient and reliable network that will meet our current and
future needs.

Sections A to E of this RLTP have been prepared by the Regional Transport Committees
(committees) of the three councils together with the Transport Agency. Part F of this
document has been developed independently by each of the three independent committees
to reflect their individual transport needs. Importantly, this RLTP has been prepared in a
manner consistent with the Act (the legislative context of the RLTP can be viewed in
Appendix 1). The Act requires every RLTP to include activities relating to State Highways
proposed by the Transport Agency.

                                                         Tasman Regional Land Transport Plan, Page 1
Part B – Government Policy Statement &
the RLTP
B1 Relationships between Land Transport Documents
The Government Policy Statement (GPS) sets out national land transport objectives and the
results the Government wishes to achieve from allocation of the National Land Transport
Fund (the Fund). Whilst the RLTP must be consistent with the GPS, the National Land
Transport Programme (NLTP) must give effect to the GPS and must take account of the
RLTP. The relationship between the RLTP, the GPS and the NLTP is shown in Figure 1.
The Transport Agency’s ‘Statement of Intent’ gives effect to the Government’s direction for
transport. The Transport Agency therefore invests and operates with a ‘whole of system’
approach, with their immediate priority being the development and finalising of the 2018 to
2021 NLTP.
In 2017 the Transport Agency released the ‘Long Term Strategic View’ (LTSV) document.
The LTSV identifies long term pressures and priority issues and opportunities and is the link
between the Government Policy Statement and investment proposals. The LTSV is
informing the Transport Agencies’ investment proposal, but eventually the Agency wants to
develop it to take a shared system view.
Figure 1 – Statutory Relationship between the RLTP, the NLTP and the GPS.
Tasman Regional Land Transport Plan, Page 2B2 The Government Policy Statement on Land Transport
2015/16-2024/25
The GPS is the Government’s main document which sets priorities and funding levels for
land transport investment.
The Government released an ‘Engagement Draft’ of its GPS (the Draft GPS 2018) in April
2018 which includes:
national objectives for land transport;
the results the Government wishes to achieve from allocation of the National Land
Transport Fund;
the Government’s land transport investment strategy in a framework that will guide
investment over the next 10 years; and
the Government’s policy on borrowing for the purpose of managing the NLTP.
The GPS cannot determine which projects will be funded or how much funding any
particular project will receive. Rather, the GPS sets ranges of funding which the
Government will make available for different types of activities that best meet its objectives.
The Transport Agency then determines which projects receive funding and to what level,
within those overall funding ranges.
The strategic priorities in the draft 2018 GPS are shown below in Figure 2 below.
Figure 2 GPS 2018 Strategic Priorities
Draft GPS 2018 transforms the focus of investment for land transport. There are new
strategic priorities, and amended objectives and themes that focus on road safety, more
Tasman Regional Land Transport Plan, Page 3liveable cities, regional economic development, protecting the environment, mode
neutrality, and delivering the best possible value for money. Further details on the draft
2018 GPS can be found at:
http://www.transport.govt.nz/ourwork/keystrategiesandplans/gpsonlandtransportfunding/
A second stage GPS is likely to be required in order to fully realise Government direction for
transport investment. Inclusion of some things in the Draft 2018 has not been possible
given the time constraints. This is because they rely on other work such as a review of rail,
development of a new road safety strategy, and any future recommendations and targets
produced by the independent Climate Change Commission. The Ministry of Transport hope
to release this in 2019. Variation to this RLTP as a result of the second stage GPS could
occur and at that time, and during that variation the opportunity could be taken to refine
and more closely align this RLTP’s objectives and measures to the GPS.
Tasman Regional Land Transport Plan, Page 4B3 The National Land Transport Programme
The NLTP for 2018 to 2021 contains all of the land transport activities, such as public
transport services, road construction, maintenance and policing, that the Transport Agency
anticipates funding over the next three years. The NLTP is a planning and investment
partnership between the Transport Agency and local authorities which will deliver transport
solutions to help communities across New Zealand thrive. The NLTP will be published on 31
August 2018.
The Transport Agency now requires all activities seeking inclusion in the NLTP to be
developed in a manner consistent with the principles of the business case approach (BCA).
To support this, it is important that plans at national, regional and local levels are also
developed in a way that is consistent with the BCA principles. As this RLTP is a key statutory
document for the Top of the South this mid-term review has been undertaken using BCA
principles. The Investment Logic Map that shows the key problems, benefits and strategic
responses is located in the Key Issues section C2.
B4 Regional Land Transport Plan
Section 13 of the Act requires every regional council, through its Regional Transport
Committee, to prepare a RLTP every six financial years. The RLTP provides the strategic
context and direction for each region’s transport network. The first iteration of this
document was submitted to the Transport Agency prior to 30 April 2015 following approval
by the Council. This mid-term review will be submitted to the Transport Agency by 30 June
2018 once it is approved by the Council.
The Top of the South councils have agreed to work together and provide a coordinated
RLTP.
The RLTP 2015 to 2021 is available for the public to view on each council’s website and in
each council’s respective offices and service centres. Once this mid-term review is published
on 31 August 2018 it too will be available for the public to view on each council’s website
and in each council’s respective offices and service centres.
Tasman Regional Land Transport Plan, Page 5Part C – Top of the South Key Issues
and Context
C1 Introduction
The Top of the South RLTP includes Marlborough District, Nelson City and Tasman District
Councils, the Department of Conservation and their transport investment partner, the
Transport Agency, all collectively delivering a land transport system that enables economic
growth, accessibility and resilience to all road users. The Top of the South area, and the
hierarchy of the State Highway network, are shown in Map 1.
Map 1. Top of the South
The area covered by the Top of the South goes from the east coast to the west coast and
mainly consists of rural land and national parks. Nelson City, in comparison to Tasman and
Marlborough, is predominantly urban. Nelson and Tasman are economically interlinked and
dependent on each other. This is reflected in the way the two councils work together to
provide a safe and efficient land transport network.
Tasman Regional Land Transport Plan, Page 6C2 Regional Transport System Problems and Opportunities
In order to provide strategic direction to inform this mid-term review and update the 2015
RLTP, a stronger business case focus has been taken. The key issues and transport
objectives from the 2015 RLTP were tested and refined through collaborative workshops and
the resulting key problems that face land transport in the Top of the South have been
developed. The problems and the benefits of solving the problems and the strategic
responses, are shown in the Investment Logic Map below.
Figure 3 – Investment Logic Map - Top of the South Regional Transport Issues
Evidence to support the problem statements is located in section C4. Monitoring and
measurement against the benefits are listed in Tables 3 and 5 and presented in detail in
Appendix 3. The strategic responses presented above are mapped to the individual projects
in Tables 4 and 6 to show how the individual project responds to the identified key
problems.
Tasman Regional Land Transport Plan, Page 7C3 Regional Context
Marlborough
Marlborough is situated in the north-east corner of the South Island, accessible by ferry,
rail, air and road.
As of the March 2013 Census, the resident population was 43,416. The main population of
Marlborough is centred in the town of Blenheim (24,183), followed by Picton (4,056), which
is 25km north of Blenheim. As the ferry transit point from Wellington and entrance to the
Marlborough Sounds, Picton is a tourism gateway.
Port Marlborough, in the Marlborough Sounds, is the main portal for freight and tourists
travelling between the North and South Islands.
A fifth of Marlborough District’s workforce is employed in the primary sector. Over the last
decade the Marlborough District has successfully converted most of the land formerly
dedicated to cropping and stone fruit into viticulture so that it is now New Zealand’s largest
grape growing region, producing 67% of New Zealand’s total wine production.
Rail runs north/south through Marlborough generally parallel with SH1 and complements
the Top of the South’s land transport network. Key freight hubs are located at Port
Marlborough (Picton) and Spring Creek with passenger stations at Picton and Blenheim.
Nelson
Nelson City is the smallest region in New Zealand (by land area). It is bounded by
Champion Road to the south, the Bryant hill range to the east and Cape Soucis and Tasman
Bay to the north. Nelson’s resident population at the 2013 Census was 46,437.
The Nelson CBD is the main commercial centre within the Top of the South with just under
8000 employees and is critical to the wellbeing of the regions and their respective
economies. Nelson City has the Top of the South’s main airport, port, hospital and the
Nelson Marlborough Institute of Technology’s main campus.
Nelson provides services for the communities of Tasman and Marlborough and has particular
strengths in marine construction, aviation and manufacturing and is home to almost one-
third of New Zealand’s fishing and aquaculture. Like Tasman and Marlborough, Nelson has
opportunities to add value to primary products and for smaller-scale enterprises to work
together to grow and to export. The information communications technology cluster in
Nelson has continued to grow and drive change across all industries
Tourism in the Top of the South is driven by its natural beauty and great climate and
supported by premier food and beverage establishments, shopping opportunities and its
thriving local arts and crafts scene which see the city and the tourist areas swelling to
capacity during the summer months.
Tasman Regional Land Transport Plan, Page 8Tasman
The Tasman District is located in the north west of the
South Island. It covers the area from the boundary of
Nelson City in the east, to Murchison and the West
Coast in the south, Golden Bay in the north-west and
Marlborough to the east.
At the time of the March 2013 census Tasman District
had a total resident population of 47,157. The main
population of the Tasman District is centred in
Richmond which is the largest and fastest growing town
in the District with 14,916 residents. Motueka is the
next largest town with 7,593 residents in 2013.
The Tasman District is known for the natural beauty of its landscape. Fifty-eight percent of
the Tasman District is national park – Nelson Lakes, Kahurangi and Abel Tasman National
Parks. There are a range of other forests and reserves in the area, including the Mount
Richmond State Forest Park and Rabbit Island. Tasman District covers 14,812 square
kilometres of mountains, parks, waterways, territorial sea and includes 812km of coastline.
Like Marlborough the primary sector is the main economic driver for Tasman.
Economic Drivers
Our community regards the Top of the South as one region. Our local government
boundaries are not necessarily our economic boundaries. Many economic activities cut
across the regional boundaries. The Nelson, Tasman and Marlborough regional economies
are interlinked and dependent on each other through horticulture, forestry, seafood,
farming, tourism and aviation.
The Top of the South contributes close to three percent of New Zealand’s gross domestic
product (GDP) and has a high reliance on primary industry with concentrated exposure to
natural commodities and international commodity prices. The Tasman and Marlborough
districts are highly export focused and rely on factories and manufacturing in both Nelson
and Tasman for export. By weight the exports are predominantly distributed via Port Nelson
with lesser amounts via Port Marlborough, Nelson Airport and Marlborough Airport.
The unemployment rate for the Nelson/Tasman/Marlborough/West Coast region is the
lowest in the country at 2.2% down 0.6% when comparing the September 2017 quarter
against the September 2016 quarter.
Port Nelson is the biggest fishing port in Australasia and supplies all the fuel for the Top of
the South. Forestry is also important to the port whether it be raw logs or value added
timber products. Wine exports have grown significantly in the last five years particularly via
the road linkage to Marlborough which supports the new Quay Connect logistics facility at
Port Nelson.
The Top of the South’s economy is driven by five export based clusters:
horticulture;
forestry;
seafood;
pastoral farming; and
tourism.
Three other significant sectors contributing to the regional economy are
water, air and other (land) transport;
Tasman Regional Land Transport Plan, Page 9 chemical product manufacturing; and
professional and technical services.
Annual growth in Nelson-Tasman regional GDP per capita in 2016 was 2.0% compared with
the national average of 2.5%. In Marlborough, annual growth was 1.7% in 2016.
Horticulture and viticulture
Over the past 20 years, horticulture exports have grown from $200 million to $2.23 billion.
It is now New Zealand’s sixth largest export industry. Historically, horticulture and
viticulture has been one of the Top of the South’s key sectors. In 2016, horticulture alone
contributed more than 2.4% of the regional GDP in Nelson-Tasman. It provided over 5.3%
of the region’s employment. In Marlborough, this figure was 2.6% of the regions GDP and
6.1% of the regions employment. New Zealand’s largest grape producing region is Tasman-
Marlborough. In 2013, there were 158 wineries in Marlborough and 28 in Tasman out of a
total 2,005 in New Zealand. The movement of horticultural products and grapes contributes
significantly to the economies of Tasman and Marlborough with the produce being
predominantly transported around the Top of the South by road.
Neudorf Vineyard, Tasman
The main horticulture clusters include grapes, apples and pears, vegetables and kiwifruit.
Regional issues that the horticulture and viticulture industries face include an efficient route
to Port Nelson. In 2015, over 239,000 tonnes of fruit were exported from Port Nelson
making up 62% of the total tonnage of food exports. Transporting that amount of
horticultural products to both pack houses, cool stores and to the Port requires an efficient
and reliable road network. Seasonality of the industry is a major factor with peak
horticultural freight movements around the Top of the South occurring in autumn. It is
especially important at this time of the year that the network is at its most efficient and
resilient.
Forestry & Wood Products
In 2015/2016 there was a total of 169,783 hectares of plantation forestry in Nelson,
Tasman and Marlborough (10% of New Zealand’s forest plantations).
Tasman Regional Land Transport Plan, Page 10The Top of the South region is home to a mature but innovative forestry and logging cluster
that contributed $64 million to the region’s GDP in 2016. In the five years, forestry and
logging has steadily increased its GDP
contribution by 28%, as a result of increased
technology, consolidation and other productivity
improvements.
The wood harvested in the Top of the South
flows through to local sawmills, a laminated
veneer lumber plant, a medium density
fibreboard plant and the remainder for log
exports. The region is home to one of the
world’s most innovative wood processing plants,
Nelson Pine Industries, based in Richmond,
Tasman.
With the introduction of 50 MAX and the High Productivity Motor Vehicle (HPMV) scheme,
trucks are allowed to carry heavier weights on selected routes. This has resulted in fewer
trips to the ports to carry logs and processed wood products.
Export logs and wood products are transported by road to the closest port. In 2016 671,000
tonnes of logs were exported from Port Nelson and 751,000 tonnes from Port Marlborough.
The forestry industry is heavily reliant on the road network and the need for a network
across the Top of the South that is resilient, reliable and efficient.
Seafood
Seafood is a significant contributor to the New
Zealand economy. China, Australia and the USA
remain the top three countries to which New
Zealand seafood is exported. The Top of the
South’s contribution to the seafood industry is
significant. The seafood cluster includes
commercial offshore fishing and aquaculture
and processing and supporting sectors such as
marine engineering, boat building and seafood
scientific research.
Port Nelson is Australasia’s largest deep fishing port and the region is New Zealand’s leading
location for seafood activity, with approximately 25% of the national seafood industry
employment. Sealord and Talley’s Group Ltd are both based in the region. Sealord is based
at Port Nelson while Talley’s Group is based at Port Motueka, Tasman. Talley’s 4,500 tonne
cold-store facility is based at Port Nelson. Nelson is home to the Cawthron Institute and the
Cawthron Aquaculture Park, a world-class research institute and New Zealand’s largest
mussel and oyster hatchery.
In 2016, the Nelson-Tasman region had 339 fishing associated businesses and 21 seafood
processing business units. Mussel farming is an increasing business opportunity for the
region that will provide employment, capital investment and increased regional GDP. In
2016 Marlborough produced 50% of the total NZ greenshell mussels with the Nelson
Tasman region producing 9%.
Salmon farming is becoming increasingly significant for Marlborough as farms are
predominantly located in the Marlborough Sounds. New Zealand King Salmon produces 50%
of New Zealand’s salmon. New Zealand and Canada are the only locations where king
salmon are farmed in the world and as a result New Zealand King Salmon produces 50% of
the world’s farmed king salmon. There are four purpose-built processing facilities in Nelson.
Tasman Regional Land Transport Plan, Page 11Pastoral Farming
The pastoral farming cluster includes sheep, beef,
dairy, pig, deer and associated industries such as
processing, manufacturing and services, including
wool harvesting, road transport, farm equipment
sales and servicing.
In 2012 44% of farming GDP for the Top of the
South came from dairy production. The flow-on
effect to processing and manufacturing of dairy
products on the region’s road network is significant. The majority of milk produced on farms
in Tasman is processed at Fonterra’s milk powder plants in Takaka and Brightwater and
then exported via Port Nelson.
Alliance Group (meat producer and export co-operative) has a meat plant in Nelson that
takes sheep from the Top of the South as well as Amberley in Canterbury to the south, and
from the North Island when required.
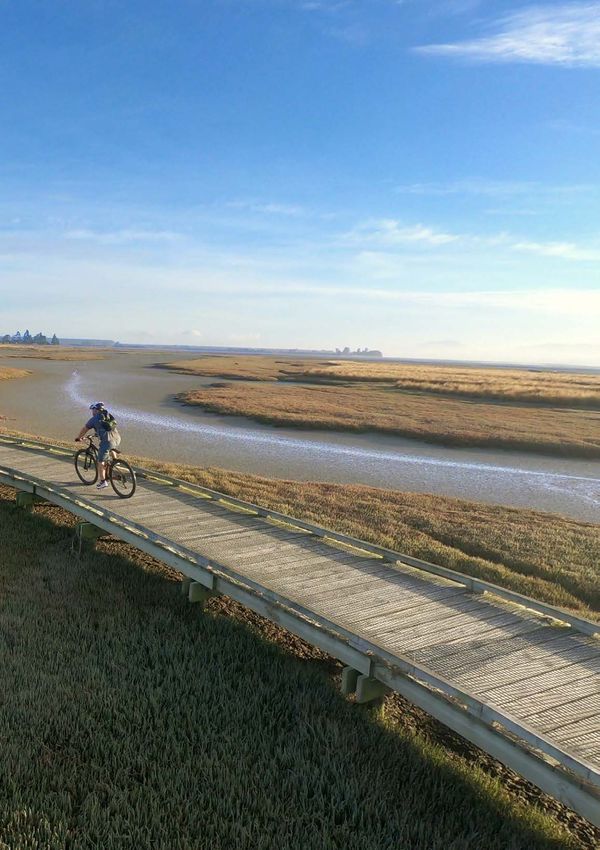
Tourism
Tourism activities in the Top of the South are
diverse, with a summer peak of tourists that are
typically ‘self-drive’.
Tasman provides access to three National Parks
and Marlborough is home of the Sounds with
Picton acting as a gateway to the South Island for
travellers arriving (or departing) by ferry. St
Arnaud and the Rainbow ski field are on the
boundary between Tasman and Marlborough.
The region is fast becoming known for its
cycleways and mountain biking. Nelson’s
Coppermine Trail, Tasman’s Great Taste Trail, the
Heaphy Track, Queen Charlotte Track, and the
planned Coastal Pacific Trail between Kaikoura and
Picton enhance the Top of the South’s reputation
as a premier cycling destination.
The Top of the South is a destination for both domestic and international tourism. Whilst
domestic tourist numbers have always been high especially in the ‘summer holiday’ period,
international tourist numbers have grown considerably in the last few years.
Aviation
The Top of the South is home to Air
Nelson, Helicopter New Zealand, the
Regional Maintenance Facility at
Nelson Airport and the Global
Defence facility at Marlborough
Airport. Aviation makes a
considerable contribution to the Top of the South’s economy with Nelson Airport being the
fourth busiest airport in New Zealand and the busiest regional airport in the country in
terms of scheduled flights. In the 2016/17 year Nelson Airport experienced significant
Tasman Regional Land Transport Plan, Page 12growth and record passenger numbers were up 16% on the 2015/16 year attaining the
milestone of one million passengers through the terminal.
The aviation industry supports the export based economic drivers as well as tourism. Both
airports are served by State Highway 6 and the adjoining local road network which are both
identified as key journey routes.
C4 Key Journey Routes
Throughout the Top of the South there are a number of key journey routes as listed below
and shown on map 1 in section C1:
SH1 Picton to Christchurch
One Network Road Classification (ONRC) National route providing critical connections
to port for both freight and tourists. The route is currently closed in some southern
sections due to extensive damage from the 2016 Kaikoura seismic events.
The route is winding with gradients vulnerable to natural events and has sections of
high crash risk KiwiRAP 2-Star sections, below the KiwiRAP 4-star target for a
National highway.
SH6/62/1 Nelson to Picton
ONRC Regional route is winding with gradients, vulnerable to natural events with
sections of high crash risk KiwiRAP 2-Star sections, below the KiwiRAP 3-Star target
for a regional highway.
SH6 Nelson to Richmond
ONRC Regional Urban route providing access between the growth centres of Nelson,
Richmond and Port Nelson and Nelson airport. The key issues along the route include
peak period congestion and poor multi-modal accessibility.
Waimea Road
ONRC Regional Urban route providing access between the growth centres of Nelson
and Richmond. The key issues along the route include peak period congestion and
poor multi-modal accessibility.
Lifeline route to Nelson Hospital.
SH6 Richmond to Canterbury/West Coast
ONRC Arterial route winding with gradients, vulnerable to natural events with
multiple sections of high crash risk KiwiRAP 2-Star sections.
The only route connecting Nelson/Tasman to the West Coast, subject to resilience
issues due to lack of alternate routes.
SH6, until its intersection with SH65, is currently acting as the primary corridor south
due to extensive damage on SH1 from recent seismic events.
SH60 Richmond to Golden Bay
Classified as an ONRC Regional route to Motueka and a primary collector to Golden
Bay. SH60 provides the only route to and from Golden Bay, the route is winding with
gradients, vulnerable to natural events and predominately rated as a high crash risk
KiwiRAP 2-star highway.
SH63 Blenheim to West Coast
Tasman Regional Land Transport Plan, Page 13 ONRC Secondary Collector route, winding and follows the river valley. SH 63
provides a detour route for SH1 and is currently catering for significant additional
traffic following the 2016 Kaikoura event.
Tourist connection to the West Coast, high number of drivers unfamiliar with the
route.
C5 Problem Statement Evidence
This section details key pieces of evidence supporting the four problem statements
introduced in the investment logic map in section C2.
Evidence in support of the problem statement ‘Constraints on the transport network
are leading to delays affecting freight, tourism, business and residential growth.’
is summarised below.
The total population of the Top of the South is
137,010 (2013) with Nelson/Richmond being the
largest urban and commercial centre. Regional
population growth has been moderate over the last
decade (2007 to 2016), increasing by approximately
1% per annum and in the longer term, the region’s
population is expected to slow to 0.4% growth per
annum to 2043. The exception is Nelson/Richmond,
which is currently forecast to increase by 15% by
2043 (an additional 9,500 people) and this combined
with strong tourism business and industry growth is
putting the transport network in Nelson and Richmond under pressure.
Constraints on the urban roading network in Nelson and Richmond result in it operating at
or near capacity causing peak hour delays at selected locations. These peak delays are
likely to increase as travel demand increases (with population and freight forecasts) and
demand for private vehicle use continues. To date, there has been limited coordination
between growth and infrastructure planning exacerbating the constraint issue.
A Transport Agency definition of congestion under their investment assessment framework
based on the 2015 GPS is “where the volume-to-capacity ratio exceeds 80% for five days
per week over at least a one hour time period that affects at least 1.5 km of a route”.
Bluetooth travel time data presented in the Nelson Southern Link Strategic and Programme
Business Case provides evidence for congestion ranging from 83% to 95%, confirming
current traffic congestion in the peak hours on Nelson’s two ONRC Regional routes between
Queen Elizabeth Drive and Annesbrook.
In Richmond a recent study on SH6 found that new and intensified commercial development
along Gladstone Road and its side streets is resulting in increased traffic generation and
congestion at afternoon peak periods. Severe southbound afternoon peak congestion is
occurring at the western end of Whakatu Drive, which is throttling back traffic through
Richmond and preventing further congestion between McGlashen Avenue and Oxford Street
in Richmond.
Increased transport capacity in the high growth areas of Nelson and Richmond will be
needed to meet the projected demand. The National Policy Statement on Urban
Development Capacity requires an additional 4542 residents in the short to medium term
and the transport system that is already constrained will need to respond to this demand.
Tasman Regional Land Transport Plan, Page 14Evidence in support of the problem statement ‘Lack of redundancy, and susceptibility
of the network to the impacts of climate change and high impact natural hazards
increases the risk of losing community connectivity and impacting the economy’ is
summarised below.
The Top of the South has experienced significant adverse natural hazard events recently.
The earthquakes at Seddon in 2013, St Arnaud in 2015 and Kaikoura in 2016 have been a
reminder that the Top of the South is vulnerable to major seismic events. The 2016
Kaikoura event had disrupted in excess of a million trips by the end of 2017. At the time of
preparing this plan there is a detour in place for all State Highway 1 traffic via SH62, 63, 6,
65, and 7 to re-join State Highway 1 at Waipara for all north and southbound trips between
Canterbury and the Top of the South. The close proximity to the Flaxmore and Alpine fault
systems presents considerable risk to the transport network especially in the areas of
reclaimed coastal margin and the steep hillsides. The transport assets most at risk are the
bridge and retaining wall stock.
Tasman, Nelson and Marlborough also regularly suffer from storm events which disrupt the
land transport network and affect the movement of people and goods around the region.
When combined with climate change and the resulting sea level rise, the storm events are
likely to become more frequent and more damaging over time. Because of the typically
steep topography and soils that become unstable during extreme rainfall events the
transport network is highly susceptible to slips. There has also been an increasing
occurrence of erosion in the coastal margin areas that will increase with increasing sea level
rise and northerly storm intensity.
Evidence in support of the problem statement ‘Driver behaviour and unforgiving roads
lead to unacceptable levels of death and serious injuries’ is summarised below.
The Government's Safer Journeys 2010 – 2020 strategy
highlights a safe road system that becomes increasingly
free of death and serious injury. The strategy
introduced the Safe System approach to New Zealand.
This approach recognises that people make mistakes
and are vulnerable in a crash. It aims to reduce the
price paid for a mistake so crashes don’t result in loss
of life or limb. Mistakes are inevitable – death and
injuries from road crashes are not.
Since 2002, the Top of the South has had a higher
serious injury or death rate caused by a motorcycle crashes than the rest of New Zealand as
shown in Graph 1. Although, the data for this issue is displaying a downward trend the
numbers of death and serious injuries are still higher than the national average.
Tasman Regional Land Transport Plan, Page 15Death or serious injuries in motor cyclist
crashes by 100,000 population
20.0
15.0
10.0
5.0
0.0
2002 2003 2004 2005 2006 2007 2008 2009 2010 2011 2012 2013 2014 2015 2016
New Zealand Nelson/Tasman/Marlborough
Graph 1. Death or serious injuries in motor cycle crashes.
Another key area of road safety concern for the Top of the South is our crash statistic for
rural roads as shown in Graph 2, where we are also above the national average.
Death or serious injuries in rural road crashes
by 100,000 population
60.0
50.0
40.0
30.0
20.0
10.0
0.0
2002 2003 2004 2005 2006 2007 2008 2009 2010 2011 2012 2013 2014 2015 2016
New Zealand Nelson/Tasman/Marlborough
Graph 2. Death or serious injury in rural road crashes.
A contributor to these rural road crashes is tourists, as shown in Graph 3, due to their
unfamiliarity with rural New Zealand road conditions especially to the remote tourist
destinations, such as the Kahurangi National Park, Totaranui and the Marlborough Sounds.
Tasman Regional Land Transport Plan, Page 16Death or serious injuries by overseas drivers by
100,000 population
10
8
6
4
2
0
2002 2003 2004 2005 2006 2007 2008 2009 2010 2011 2012 2013 2014 2015 2016
New Zealand Nelson/Tasman/Marlborough
Graph 3. Death or serious injurie crashes by overseas drivers.
Evidence in support of the problem statement ‘Roads and footpaths do not currently
meet the needs of our ageing population, walkers and cyclists thereby creating
barriers to those wishing to utilise alternative modes of transport’ is summarised
below.
Demographically, the Top of the South has an ageing population. Projections by Statistics
New Zealand (2013) reported that the population of the combined Marlborough-Nelson-
Tasman region is projected to grow (under the medium variant assumptions), from
approximately 142,200 in 2013 to 156,600 by 2043 (10 per cent). However, the growth will
be most uneven by age, with declines projected in the 0-14, 15-39, and 40-64 years age
groups, while the number of people aged 65 years and above will double in the next thirty
years, both numerically and as a percentage of the population (from 18 per cent in 2013 to
35 per cent in 2043).
Whilst private vehicles remain the most popular choice for journeys to work across the main
urban centres, in the 2013 census the Nelson/Richmond urban centre recorded the highest
number of commuter cyclists (journeys to work) of any centre in New Zealand (18%). The
cycle networks across the Top of the South in the urban areas does not provide a connected
network which is a barrier to less confident users. This is reflected in the annual customer
surveys of both Nelson and Tasman that feature high levels of dis-satisfaction in the urban
cycle networks.
The transport system will need to respond to the changing demographic, e.g. road
environments that accommodate increasing reaction times, safe pedestrian facilities
including for mobility scooters and convenient public transport and total mobility services.
C6 Inter-Regional Issues
The South Island Regional Transport Committee Chairs Group recognises that freight and
visitor journeys and concerns about resilience, do not stop at district or regional boundaries.
In light of this, the Group has committed to working collaboratively to advance planning
across the South Island in these key areas. It is likely that there will be some projects that
will be progressed over the next three year period (2018-2021). These projects are
currently being scoped to better understand issues and gather information, and it is
intended that they will be included in one or more RLTPs at a later stage.
Tasman Regional Land Transport Plan, Page 17You can also read