Our community our future 2012-22 - our - plan adopted 27 June 2012 - Matamata ...

Page created by Ray Leonard
 
CONTINUE READING
Our community our future 2012-22 - our - plan adopted 27 June 2012 - Matamata ...
matamata-piako district council

our community our future 2012-22
                                  plan adopted 27 June 2012

                                                       our       our
                                                     community
                                                                 ffuture
                                                                    t
Our community our future 2012-22 - our - plan adopted 27 June 2012 - Matamata ...
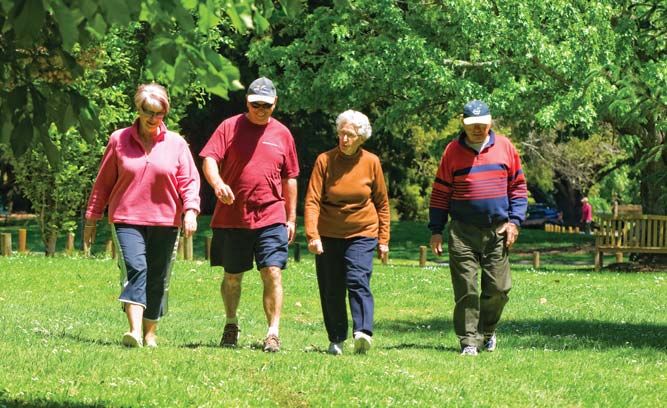
ISSN 1170-5779 (Print)
ISSN 1178-9735 (Online)

Part One – Introduction Our Community Our Future 2012-22
Our community our future 2012-22 - our - plan adopted 27 June 2012 - Matamata ...
Contents

                                                                                                                                                        Introduction
 Part one: Introduction                                Part two: What we do
 Foreword                                          1   Community Facilities                              57
 The process                                       2   Community Infrastructure                          84
 Audit opinion                                     3   Community Development                            131            Council has cut over two
 Introductions                                     6   Environmental Care                               154           million dollars of proposed
 Our Community Our Future – A guide                9                                                                    “choose to do” projects
                                                       Support Services                                 175
                                                                                                                        from the plan, including
 Financial strategy - The big picture             10
                                                                                                                      public toilet replacements
 Our district today                               21                                                                  in Matamata, Morrinsville
                                                       Part three: Forecasting assumptions, financial
 Growth trends                                    24                                                                  and Te Aroha Cemeteries
                                                       statements and policies                                          and at Waharoa. We are
 Our economy                                      27
                                                       Forecasting assumptions                          178            aware that the economic
 Community wellbeing                              29                                                                    climate is still not good,
                                                       Financial statements                             184
 Community outcomes                               31                                                                        many businesses
                                                       Funding impact statement                         204
 Maori participation in Council decision making   42                                                                      and individuals in our
                                                       Revenue and financing policy                     213           community are looking to
 Decisions for the future of our community        43
                                                       Rates remissions policy                          224             see where they can cut
 Plans for the next ten years                     54                                                                  back. We have recognised
                                                       Development contributions policy                 232
                                                                                                                        this and considered the
                                                       Investment policy                                256          feedback we have received
                                                       Liability management policy                      261            from the community, and
                                                       Significance policy                              267                  done the same.
                                                       Working with others                              272
                                                                                                                       Hugh Vercoe, Mayor

                                                                                             Our Community Our Future 2012-22 Part One – Introduction
Our community our future 2012-22 - our - plan adopted 27 June 2012 - Matamata ...
Foreword
         We are pleased to present the Our Community Our Future 2012-22 plan
                  Matamata-Piako District Council is required under the Local Government Act 2002         Under the current system each property pays the same amount for connection
                  to prepare a ten year plan, outlining any new projects/capital improvements and the     regardless of how many toilets they actually have. This means that in the current year
                  cost of all of our proposed services. The costs and impact on rates for each year of    a retired person living in a one bedroom flat paid $593.00 to connect to the sewer
                  the plan must be shown and presented to our community for comment. The plan             system. All other high users such as businesses and other organisations (such as
                  must be updated and reviewed every three years, 2012 is the third of such reviews.      schools) paid the same $593.00. We consider this to be unfair and we will change
                                                                                                          to a “pan charge” where ratepayers (excluding residential houses) will be charged
                  In developing the draft plan we were conscious of the need to keep any rate
                                                                                                          based on the number of “pans” they have. This will make wastewater more of a user
                  increases to a minimum. Any increased income from growth and development has
                                                                                                          pays service. We have also proposed a remission system (that is subject to further
                                             slowed from previous projections and any new projects
                                                                                                          consultation) whereby any non residential property owner can choose between
                                             will impact directly on our existing ratepayers.
                                                                                                          paying on a per pan basis, or electing to fit a water meter to accurately determine
                                            The plan does propose annual increases in rates,              their impact on our system. We would then remit the per pan charge back to reflect
             Council is required            assuming we continue to deliver our current services at       the number of house equivalent units actually occurring. Those businesses who on
                                            the current standard. These are in two separate areas and     general assessment do not impact more than an average house, would continue to
              under the Local               I will summarise them separately.                             pay only one connection fee. The increase to all our high users, schools, hospitals,
              Government Act                                                                              rest homes etc is significant and we will therefore phase in the per pan charge over
                                            General rates (including the uniform annual general           the next three years.
              2002 to prepare               charge)
                                                                                                          A contestable grant of $10,000 is available so that high users who are not for profit
                                            General rates predominantly pay for services and projects
             a Long Term Plan                                                                             organisations can apply for a partial remission.
                                            available to everyone in our community such as roads,
             every three years              parks, libraries, pools and democracy). General rates         We have recently undertaken major wastewater treatment upgrades, including
                                            revenue is predicted to increase by 4.64% in 2012/2013,       Morrinsville $17.5 million (budgeted), Waharoa $3.6 million (budgeted), Matamata
                                            5.50% in 2013/2014 and 3.58% in 2014/2015. The                $5.6 million (actual) and Te Aroha $4.8 million (actual). The additional cost of loan
                                            average predicted increase in general rate revenue over       repayments, depreciation, and extra operating costs will result in an increase to the
                                            the full ten years is 4.17% per year. These figures include   unit connection charge of $93.00
                                            provisions for inflation.
                                                                                                          Rubbish: the cost of kerbside rubbish collection, recycling and transfer to landfill
                               Targeted rates                                                             increases the cost of this service per property by $7.00.
                               The various targeted rates pay for services used or available to           New Projects
                               individuals, and include:
                                                                                                          The draft plan identified several new projects over the next 10 years. Many of these
                               Water: with Silver Fern Farms projected to be purchasing water again       were identified as “choose to dos” and following submissions, several of these
                               from Council the water rate reduces by $24.00 per property.                projects have been removed from the plan.

                               Stormwater: we have reduced the extent of projected stormwater             Power New Zealand investments
                               improvements and consequently the stormwater rate reduces by               Power New Zealand Investment is our largest investment. It is split into two separate
                               $35.00 per property.                                                       parts, being:
                               Wastewater: we have significantly changed the way we charge per            1.   Internal investment: as at 31 December 2011 a balance of $11.95 million had
                               property for wastewater from 1 July 2012.                                       been loaned by the investment account to separate Council projects. The

 1

Part One – Introduction Our Community Our Future 2012-22
Our community our future 2012-22 - our - plan adopted 27 June 2012 - Matamata ...
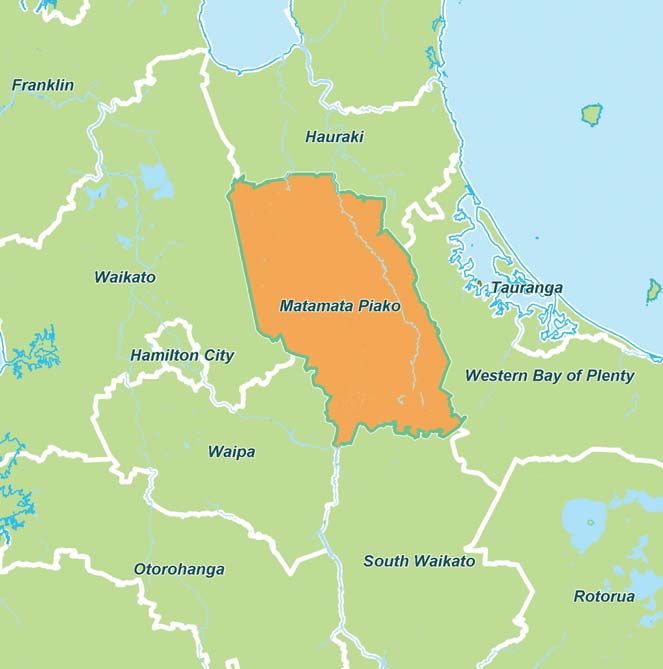
interest expected to be earned from this in 2012/2013 is $754,000.00 which is      The plan covers the first three years in detail and the following seven years in general
      rated for. The majority of which is credited to the general rate.                  predictions. The plan will be reviewed again in three years time.

                                                                                                                                                                                        Introduction
2.    Overseas Capital Investment: as at 31 December 2011 the balance in this
      investment was $9 million. We have budgeted for dividends earned on this fund
      to be returned to New Zealand and used to subsidise rates. We have budgeted
      to receive $390,000.00 in the 2012/2013 year.

Working together
We are conscious of the need to work together with our neighbouring councils to
become more efficient, minimise costs, and to have wider standardised policies. To
achieve this we currently have:                                                                                  Hugh Vercoe
     Building Control Consortium: we work formally on Building Control with                                    QSM, ED, JP
        Hamilton City Council, Waipa District Council, Waikato District Council and                              Mayor
        Otorohanga District Council.
     Civil Defence: we have a formal arrangement with Hauraki and Thames
        Coromandel District Councils.
     Human Resources recruitment: we have a formal agreement with Otorohanga

                                                                                         The process
        District Council, Waikato Regional Council, South Waikato District Council,
        Waipa District Council, Waitomo District Council and Waikato District Council.
     Valuation Database Services: we have a formal agreement with nine other
        Waikato Councils.                                                                The Our Community Our Future plan sets our direction for the next ten years;
We have budgeted $50,000.00 per year to look at further opportunities to work            and we asked you for your feedback before finalising the plan. The Local
together and make savings with all councils in the Waikato region. We are also           Government Act 2002 requires us to consult on this plan in a certain way - the
looking at specific opportunities to work together with the central and eastern          diagram below outlines this process and the key dates.
neighbouring councils. The current projected rates increases do not reflect any costs
savings that we could achieve by working together.
                                                                                                     18 April - Submissions open (draft plan and summary available)
Recent announcements of Local Government reform
Former Local Government Minister Nick Smith has very recently announced a
package to reform local government. The Government has advised that the first                                         18 May - Submissions close
stage of proposed reforms will be included in legislation by September 2012, and the
balance in 2013. Any changes required to our long term plan will be considered at
an appropriate time, once the implications of any legislative change have been fully
                                                                                           30 & 31 May - Hearing (Council listens to people who have chosen to present their
considered.
                                                                                                                      submissions in person)
I would like to thank the many people who submitted on our draft plan. We did listen
to your concerns and have made several changes before final adoption of this plan.
                                                                                                 27 June - Council adopts the 2012-22 Our Community Our Future plan

                                                                                                                                                                                    2

                                                                                                                       Our Community Our Future 2012-22 Part One – Introduction
Our community our future 2012-22 - our - plan adopted 27 June 2012 - Matamata ...
Audit opinion
                  Independent Auditor’s Report
                  To the readers of Matamata-Piako District Council’s Long-term Plan for the ten
                  years commencing 1 July 2012
                  The Auditor-General is the auditor of Matamata-Piako District Council (the District      Actual results are likely to be different from the forecast information since anticipated
                  Council). The Auditor-General has appointed me, F Caetano, using the staff and           events frequently do not occur as expected and the variation may be material.
                  resources of Audit New Zealand, to report on the Long Term Plan (LTP), on her            Accordingly, we express no opinion as to whether the forecasts will be achieved.
                  behalf. We have audited the District Council’s LTP incorporating parts one to three
                                                                                                           Our report was completed on 27 June 2012. This is the date at which our opinion is
                  dated 27 June 2012 for the ten years commencing 1 July 2012.
                                                                                                           expressed.
                  The Auditor-General is required by section 94(1) of the Local Government Act 2002
                                                                                                           The basis of the opinion is explained below. In addition, we outline the
                  (the Act) to report on:
                                                                                                           responsibilities of the Council and the Auditor, and explain our independence.
                  •    the extent to which the LTP complies with the requirements of the Act; and
                                                                                                           Basis of Opinion
                  •    the quality of information and assumptions underlying the forecast information
                                                                                                           We carried out the audit in accordance with the International Standard on Assurance
                       provided in the LTP.
                                                                                                           Engagements (New Zealand) 3000: Assurance Engagements Other Than Audits
                  Opinion                                                                                  or Reviews of Historical Financial Information and the Auditor-General’s Auditing
                                                                                                           Standards, which incorporate the International Standards on Auditing (New
                  Overall Opinion
                                                                                                           Zealand). We have examined the forecast financial information in accordance with
                  In our opinion the District Council’s LTP incorporating parts one to three dated         the International Standard on Assurance Engagements 3400: The Examination of
                  27 June 2012 provides a reasonable basis for long term integrated decision-              Prospective Financial Information.
                  making by the District Council and for participation in decision-making by the
                                                                                                           Those standards require that we comply with ethical requirements and plan and
                  public and subsequent accountability to the community about the activities of
                                                                                                           carry out our audit to obtain all the information and explanations we considered
                  the District Council.
                                                                                                           necessary to obtain reasonable assurance that the LTP does not contain material
                  In forming our overall opinion, we considered the specific matters outlined in section   misstatements. If we had found material misstatements that were not corrected, we
                  94(1) of the Act which we report on as follows.                                          would have referred to them in our opinion.

                  Opinion on Specific Matters Required by the Act                                          An audit involves performing procedures to obtain audit evidence about the forecast
                                                                                                           information and disclosures in the LTP. The procedures selected depend on our
                  In our view :                                                                            judgement, including the assessment of risks of material misstatement of the
                  •    the District Council has complied with the requirements of the Act in all           information in the LTP. In making those risk assessments we consider internal control
                       material respects demonstrating good practice for a council of its size and         relevant to the preparation of the District Council’s LTP. We consider internal control
                       scale within the context of its environment; and                                    in order to design audit procedures that are appropriate in the circumstances, but
                                                                                                           not for the purpose of expressing an opinion on the effectiveness of the District
                  •    the underlying information and assumptions used to prepare the LTP                  Council’s internal control.
                       provide a reasonable and supportable basis for the preparation of the
                       forecast information.

 3

Part One – Introduction Our Community Our Future 2012-22
Our community our future 2012-22 - our - plan adopted 27 June 2012 - Matamata ...
Introduction
Our audit procedures also include assessing whether:                                          performance; and
•   the LTP provides the community with sufficient and balanced information about        •    the relationship of the levels of service, performance measures and forecast
    the strategic and other key issues, and implications it faces and provides for            financial information has been adequately explained within the LTP.
    participation by the public in decision making processes;
                                                                                         We do not guarantee complete accuracy of the information in the LTP. Our
•   the District Council’s financial strategy, supported by financial policies is        procedures included examining on a test basis, evidence supporting assumptions,
    financially prudent, and has been clearly communicated to the community in the       amounts and other disclosures in the LTP and determining compliance with the
    LTP;                                                                                 requirements of the Act. We evaluated the overall adequacy of the presentation of
                                                                                         information. We obtained all the information and explanations we required to support
•   the presentation of the LTP complies with the legislative requirements of the Act;
                                                                                         our opinion above.
•   the decision-making and consultation processes underlying the development of
                                                                                         Responsibilities of the Council
    the LTP are compliant with the decision-making and consultation requirements
    of the Act;                                                                          The Council is responsible for preparing a LTP under the Act, by applying the
                                                                                         Council’s assumptions and presenting the financial information in accordance
•   the information in the LTP is based on materially complete and reliable asset or
                                                                                         with generally accepted accounting practice in New Zealand. The Council is also
    activity information;
                                                                                         responsible for such internal control as it determines is necessary to enable the
•   the agreed levels of service are fairly reflected throughout the LTP;                preparation of a LTP that is free from material misstatement

•   the District Council’s key plans and policies have been consistently applied in      The Council’s responsibilities arise from section 93 of the Act.
    the development of the forecast information;
                                                                                         Responsibilities of the Auditor
•   the assumptions set out within the LTP are based on best information currently
                                                                                         We are responsible for expressing an independent opinion on the LTP and reporting
    available to the District Council and provide a reasonable and supportable basis
                                                                                         that opinion to you based on our audit. This responsibility arises from section 15 of
    for the preparation of the forecast information;
                                                                                         the Public Audit Act 2001 and section 94(1) of the Act.
•   the forecast information has been properly prepared on the basis of the
                                                                                         It is not our responsibility to express an opinion on the merits of any policy content
    underlying information and the assumptions adopted and the financial
                                                                                         within the LTP.
    information complies with generally accepted accounting practice in New
    Zealand;
•   the rationale for the activities is clearly presented;
•   the levels of service and performance measures are reasonable estimates
    and reflect the key aspects of the District Council’s service delivery and

                                                                                                                                                                                  4

                                                                                                                        Our Community Our Future 2012-22 Part One – Introduction
Independence
                  When reporting on the LTP we followed the independence requirements of the                 Matters Relating to the Electronic Presentation of the Report
                  Auditor-General, which incorporate the independence requirements of the External           to readers of the Long-Term Plan
                  Reporting Board.                                                                           This audit report relates to the Long-Term Plan of Matamata-Piako District
                  Other than this report and in conducting the audit of the LTP Statement of Proposal        Council for the ten years commencing 1 July 2012 included on the Council's
                  and the annual audit, we have no relationship with or interests in the District Council.   website. Matamata-Piako District Council is responsible for the maintenance
                                                                                                             and integrity of its website. We have not been engaged to report on the
                                                                                                             integritiy of Matamata-Piako District Council's website. We accept no
                                                                                                             responsibility for any changes that may have occured to the Long-Term Plan
                                                                                                             since they were initially presented on the website.
                                                                                                             The audit report refers only to the Long-Term Plan named above. It does not
                  F Caetano                                                                                  provide an opinion on any other information which may have been hyperlinked
                                                                                                             to or from the Long-Term Plan. If readers of this report are concerned with the
                  Audit New Zealand                                                                          inherent risks arising from electronic data communication they should refer to
                  On behalf of the Auditor-General                                                           the published hard copy of the audited Long-Term Plan as well as the related
                                                                                                             audit report dated 27 June 2012 to confirm the information included in the
                  Auckland, New Zealand.                                                                     audited Long-Term Plan presented on this website.
                                                                                                             Legislation in New Zealand governing the preparation and dissemination of
                                                                                                             financial information may differ from legislation in other jurisdictions.

 5

Part One – Introduction Our Community Our Future 2012-22
Introductions
  Our Mayor and Councillors
      Mayor                   Deputy Mayor

                                                                                                                                                                       Introduction
  Hugh Vercoe,                Jan Barnes                Garry Stanley               Bob McGrail             Leonie Tisch             Neil Goodger
  QSM, ED, JP                 Matamata                  Matamata                    Matamata                Matamata                 Morrinsville

  Mike Gribble                Maurice Steffert          Carole Greenville, JP       Peter Jager             Teena Cornes             Ash Tanner
  Morrinsville                Morrinsville              Morrinsville                Te Aroha                Te Aroha                 Te Aroha

                                                                           Council                                           Morrinsville Community
        Council Staff
                                                                    Councillors and Mayor                                            Board
   Council employs the
                                                                        Hugh Vercoe                                               Chairperson
   Chief Executive Officer,
                                                                                                                                  Ann Linstrom
   Don McLeod, who in turn
   employs Council staff
                                                                                                                              Te Aroha Community
                                   Corporate and Operations        Te Manawhenua Forum            Hearings Commission                Board
                                         Committee                  Mo Matatmata-Piako                Chairperson                 Chairperson
                                         Chairperson                    Chairperson                   Leonie Tisch                Mary Massey
                                       Carole Greenville              Butch Tuhakaraina

                                                                                                                              Matamata Community
                                                                                                                                     Board
                                                                                                                                  Chairperson
                                                                                                                                 Daryl Anderson

                                                                                                                                                                 6

                                                                                                            Our Community Our Future 2012-22 Part One – Introduction
Our Council
                  Mayor and Councillors
                  The Matamata-Piako District is divided into three wards - Matamata, Morrinsville
                  and Te Aroha. Voters in each ward elect their representatives (11 in total), and the
                  Mayor represents the district as a whole. These people are elected to represent their
                  communities and make decisions for the wellbeing of the district.
                  Our activities and functions are governed by various committees of Council:

                  The Corporate and Operations Committee
                  This committee is made up of the Mayor and all 11 Councillors. Council has
                  delegated all of its responsibilities, duties and powers to the Corporate and
                  Operations Committee, except for the ones it can’t delegate under the Local
                  Government Act 2002.

                  The Hearings Commission                                                                   Our district is divided into three wards - Matamata, Morrinsville and Te Aroha
                  The Hearings Commission is responsible for:
                     hearing and determining applications for resource consents under the               Te Manawhenua Forum mo Matamata-Piako
                        Resource Management Act 1991                                                      Council and Iwi representatives formed the Te Manawhenua Forum mo Matamata-
                                                                                                          Piako (a standing committee of Council) to ensure Maori have the opportunity to
                     granting exemptions to fencing requirements under the Fencing of
                                                                                                          participate in decision making in our district.
                        Swimming Pools Act 1987
                                                                                                          The Te Manawhenua Forum mo Matamata-Piako considers any matters relating to
                     hearing and determining objections under the Dog Control Act 1996
                                                                                                          the social, economic, environmental and cultural wellbeing of Maori communities,
                                                                                                          both today and for the future. The Te Manawhenua Forum mo Matamata-Piako has
                                                                                                          input into developing policies, such as the Our Community Our Future plan, District
                                                                                                          Plan and other special projects.
                                        These are the committees                                          The Te Manawhenua Forum mo Matamata-Piako meets four times a year and is
                                                                                                          made up of representatives from Council, Ngati Haua, Ngati Tumutumu, Ngati
                                       that make recommendations                                          Raukawa, Ngati Maru, Ngati Whanaunga and Ngati Paoa. Ngati Rahiri-Tumutumu
                                                                                                          also have the ability to join the Te Manawhenua Forum mo Matamata-Piako.
                                            and decisions for our
                                                                                                          Community Boards
                                                  community                                               The district also has a Community Board in each ward with four members from that
                                                                                                          ward. Community Boards represent and act as advocates for the interests of their
                                                                                                          community, and act as a channel of communication between the community and
                                                                                                          Council.

 7

Part One – Introduction Our Community Our Future 2012-22
Our local residents
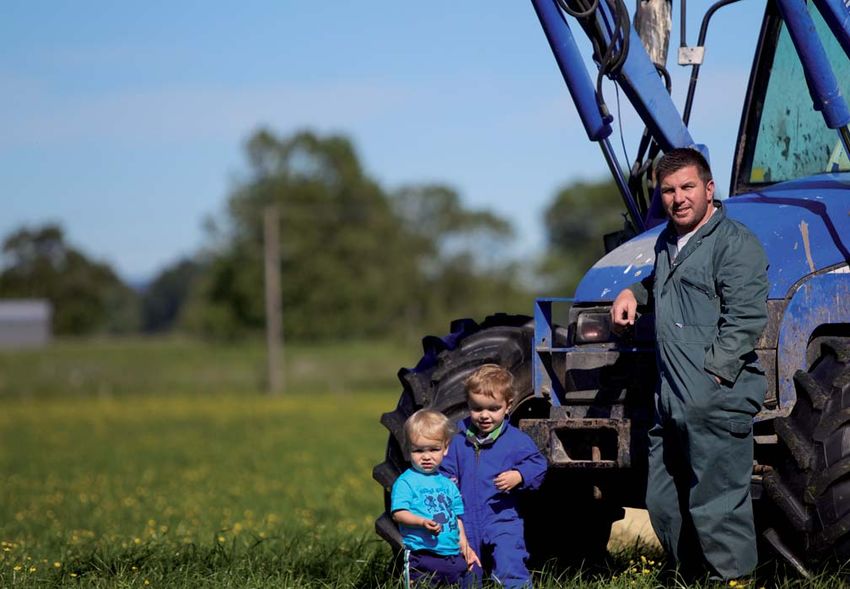
   Michelle, Doris and Tony, are ‘typical’ local residents. They all have their own stories and priorities, and their job is to help explain the Our
   Community Our Future plan.

                                                                                                                                                                                  Introduction
                                                            I own a 100 hectare farm in Manawaru, with a herd of
                   Hello, my name is Doris.                 300 cows. I live on the farm with my partner Sarah, and             Hi, I'm Michelle.
                                                            we have a worker called James. We have two dogs - a
                    I'm here to help guide you              working border collie called Molly, and pet foxy called        I'm here to help guide you
                 through the plan. I want to see            Possum.                                                        through the plan. I want to
                  a district that looks after our           I'm interested in the Our Community Our Future plan           see a district that continues
                  elders and makes Matamata-                because there are so many farmers in the district, and I     to be a great place to raise a
                                                            think it's important that Council considers farmers and
                    Piako a great place for my                                                                                        family
                                                            rural areas when planning for the future. Our district
                     grandchildren to grow up               has great quality soils for farming, and I think it's
                                                            important that these are protected and not subdivided
                                                            into lifestyle blocks.
                                                                                                                       I live in Morrinsville with my husband Nick
              I live in Matamata with my husband                                                                       and our three children - Katie (8), Matt (6),
              Robert. We have lived in Matamata for                                                                    and Ella (3). We have a chocolate poodle
              the last 30 years. We have two grown up                                                                  called Coco, and a tabby cat called
              children - Marie and Michael, and three                Hi, I'm Tony.                                     Jingles.
              young grandchildren.
                                                               I'm here to help guide                                  I'm interested in the Our Community
              I am interested in the Our Community Our                                                                 Our Future plan because I think
              Future plan because I believe that the               you through the
                                                                                                                       Morrinsville's a great community, and I
              population of the district is ageing, and I       plan. I want to see a                                  want to make sure it remains a great
              want to make sure that elderly people are         district that values its                               place to raise my family. We use
              catered for in the future.                                                                               loads of Council services like sports
                                                                       resources
                                                                                                                       grounds, the library, the swimming pool
                                                                                                                       and playgrounds, plus the usual stuff like the dump,
                                                                                                                       the roads and water - we need to make sure Council
                                                                                                                       keeps providing these services in our towns.

                                                                                                                                                                              8

                                                                                                                       Our Community Our Future 2012-22 Part One – Introduction
Our Community Our Future
                                                                                                                                    a guide
                   The Our Community Our Future plan sets our direction for the next ten years;           Community Outcomes
                   outlining our key aims, objectives and priorities for the Matamata-Piako District.     Community outcomes are our visions for the future of our community. During 2010
                   This plan:                                                                             we worked with the community to review our outcomes and ensure our visions still
                                                                                                          represent the views of our community.
                      describes the type of district our communities have told
                          us they want – our community outcomes                                           Our Community Our Future
                                                                                                          Our Community Our Future is the name of this plan. Formally it is known as a ‘Long
                      identifies the key projects to take place over the next                           Term Plan’ (LTP). This plan sets our direction for the next ten years but we review it
                                      ten years
                                                                                                          every three years.
          This plan sets              
                                       provides an overview of each activity we will carry out
                                                                                                          Annual Plan
                                        and the services we will provide for the next ten years
                                                                                                          We produce an Annual Plan in the two years that we don’t produce a Long Term
          out the aims,               
                                       determines how much this will all cost and how we will             Plan. The Annual Plan highlights any changes or variances from the Long Term Plan
                                        fund it                                                           for the coming year.
         objectives and
                                      Why produce an Our Community Our Future plan?                       Annual Report
         priorities for our           Under the Local Government Act 2002, we have to set out our long    We produce an Annual Report every year. This reviews our performance, letting the
                                      term plans for the community. We also do it to give our community   community know whether we did what we said we would. It also checks financial
       district for the next
                                      the opportunity to have a say on where we are heading and to        performance against the budget.
            ten years                 ensure our planning is robust.
                                      In completing the plan we are required to do a number of things,                                                                    Annual
                                                                                                                Annual                     Year one
                                      including:                                                                                                                          Report
                                                                                                                Report                  Our Community
                                      
                                       take a sustainable development approach and promote                                                Our Future
                                        community wellbeing
                                                                                                                                             (LTP)
                          carry out our business in a clear, transparent and accountable manner
                          operate in an efficient and effective manner, using sound business                                           The Planning
                                practices                                                                                                   Cycle
                          take into account community views by offering clear information and the                      Year three                           Year two
                                opportunity to present views                                                            Annual Plan                          Annual Plan
                          provide opportunities for Maori to contribute to decision making
                          collaborate and co-operate with other agencies and local councils to
                                achieve desired outcomes
                                                                                                                                             Annual
                                                                                                                                             Report

 9

Part One – Introduction Our Community Our Future 2012-22
Financial Strategy
                                                               the big picture
  What’s our current financial position?
                                                                                 Our financial vision for 2022

                                                                                                                                                                                   Introduction
  We are currently in a sound financial position. We provide a range of
  services that the community have indicated they are generally happy
  with, we have a reliable infrastructure network, low debt, and a small         In 2022, the Matamata-Piako District is prospering. Council continues to
  pool of investments.
                                                                                 provide its community with safe roads, reliable water supplies, good health
  The future                                                                     and sanitation services, well utilised leisure and recreational facilities, and
  The decisions that have been made in the past have got us to this solid
  starting point. But where will we be in ten years time or beyond? Will we      land that is an attractive proposition for development. Rates are fair and
  still be able to provide the same high standard of service without making      affordable and represent good value for money. Council is in a sound
  rates unaffordable? Will our debt be at a reasonable level and will we be
  able to pay for it comfortably? And will our investments be working for        financial position, and comfortably placed to be able to continue to provide
  us?                                                                            for its community well into the future, as it has over the past ten years.
  Important decisions
  Any decisions we make now will impact on our future financial situation.
  In turn, this impacts on the services we can afford to provide to the
  community over the next ten years and beyond.                               What challenges will we have to face to achieve this vision?

  So how will we manage it?                                                   Increasing costs
  This section outlines our financial strategy – how we plan to manage and    Just as the costs of running your household increase every year, the cost to provide our
  address the challenges above.                                               services continues to increase each year. Driving the increase in costs for us are:
  Parts two and three of the 2012-2022 Our Community Our Future plan             Significant costs of complying with changes to, or new legislation (for example,
  provide more details about what services we will provide the community             legislated changes for improved wastewater discharge have largely required the
  over the next ten years and how we will fund these. This plan has been             $17.5 million upgrade of the Morrinsville wastewater treatment plant).
  developed against guidelines that Council has set to help ensure that we
  remain in a good financial situation not just for the next few years, but
                                                                                 The level of inflation (or the increase in costs over time) that a local authority faces
                                                                                     is different to the level of inflation that a household faces (usually referred to as
  well into the future.
                                                                                     the Consumer Price Index (CPI)). The CPI measures the change in cost of a range
  Having clear steps and goals in place will ensure we can clearly                   of household goods and services, such as groceries, housing costs, power etc.
  demonstrate to the community how any proposed funding or                           The inflation that we have built into our forecasts is based on a different measure
  expenditure would impact on the services we deliver and our ability to             of inflation specifically for local authorities, and is related to the change in costs
  achieve our vision.                                                                for things like costs of asphalt for roads, or supplies for water treatment plants.
                                                                                     The inflation we incur is usually higher than the rate of household inflation. Every
                                                                                     three years the cumulative impact of inflation hits us when we revalue our assets
                                                                                     (as shown in the graph on the following page, pushing up our depreciation cost.
                                                                                     Depreciation accounts for an average of 29% of our total operating costs.

                                                                                                                                                                              10

                                                                                                                     Our Community Our Future 2012-22 Part One – Introduction
Interest costs associated with borrowing and the impact of interest rate              to changing needs and expectations (such as technological changes, the aging
                         movements. Interest makes up an average of 7% of total operational                  population, changing lifestyle factors etc). We receive hundreds of submissions every
                         expenditure over the ten year period of the plan. If interest goes up say 1%        year with competing requests for additional services or facilities, or for increased
                         above the rates we’ve assumed in this plan, this could increase our interest        standards of services. Most of these requests have many benefits for our community,
                         expense by an average of $644,000 per annum.                                        but they also come with a cost. As a rough guide, for every additional $100,000
                                                                                                             of operating expenditure or $1,000,000 of capital expenditure added for say a
                  All these cost drivers mean that even if we stick to providing exactly the same
                                                                                                             recreation project, this would increase general rates by just over half a percent. One
                  services every year, the cost of providing them will continue to increase.
                                                                                                             of our biggest challenges is balancing the benefit to the community, while keeping
                  Types of spending                                                                          rates affordable for the ratepayers of today and tomorrow.

                  We have two types of spending:                                                             Spreading the cost
                     Operating expenditure - this generally covers the day to day spending on              Local Government legislation requires councils to ensure that the decisions they
                         services we provide                                                                 make are fair to both today’s ratepayers and the ratepayers of the future. For
                                                                                                             example, if we were to spend $15 million on building a new wastewater treatment
                     Capital expenditure - spending to replace or upgrade existing assets. This            plant in 2015 that had an asset life of 50 years, who should pay for the cost of the
                         can be to maintain current services, or purchase/build new assets to increase       new plant? Should rates increase by 80% in 2015 to pay for the new plant? Or
                         our services or cater for growth                                                    should a family who moves into the district in the following year or in 20 years time,
                                                                                                             and still get the use of the service, also have to share the cost?
                  Capital expenditure (building or upgrading assets) usually results in increased
                  operating expenditure in the years to follow. For example, if we built a new public        One way we can spread the costs to make them more fair for everyone is by
                  toilet block, then aside from the building costs (capital expenditure), we would           borrowing the funds to construct the new plant. We can then recover the funds
                  need to budget for additional costs every year for cleaning, power, insurance, and         through rates and repay the loan over the life of the plant so those who benefit from
                  depreciation (operating expenditure). Depreciation provides funding to maintain the        the service in the future will also pay their share. This way of spreading the cost is
                  toilet block so the toilets will still be in satisfactory condition in a number of years   called ‘intergenerational equity’.
                  (e.g. 30 years time). As the years go by, the cost of replacing the asset will increase,
                  (for the reasons described above), so the amount of depreciation included in the           We also need to cater for growth when planning new assets. For example, if the
                  budget will also need to increase.                                                         $15 million plant can service the existing 10,000 households, but we expect another
                                                                                                             500 properties that will require wastewater to be developed in the next 20 years, it
                  On top of those operating costs, if we got a loan to pay the building costs for the        makes sense to increase the capacity of the plant at the time it is being built. This
                  toilet block, then the operating budget would also need to increase to include the         might mean that the $15 million project increases to an $18 million project - so who
                  annual costs of paying that loan. These costs may fluctuate in line with changes to        should pay for the additional $3 million? This is one of the questions that we asked
                  interest rates (just like a home loan).                                                    the community for feedback on in the “Decisions for the future of our community”
                                                                                                             booklet in August 2011. Overwhelmingly, the community agreed that those who
                  It is important that we consider both the short term and long term impacts of any
                                                                                                             cause additional demand for services (by developing the new sections) should pay
                  decisions to build or purchase new assets or provide new services to the community
                                                                                                             the additional costs (the $3 million) to cater for future growth – rather than the current
                  as they not only commit the community to the initial capital cost, but also to the
                                                                                                             ratepayers.
                  ongoing operational costs for the next 30 years or more.
                                                                                                             So, another way we can spread the costs is by charging people (such as
                  Changing needs and expectations                                                            developers) who create additional demand on Council services. We call this charge
                  The services and facilities that we provide have changed gradually over time due           a ‘development contribution’, and it is charged when new properties are created

11

Part One – Introduction Our Community Our Future 2012-22
When deciding how
                                   (for more information about development                 Limited funding options
                                   contributions, see the Development Contributions        We only have a limited number of ways we can fund all the services we provide and
     to fund services              Policy in part three of the Our Community Our

                                                                                                                                                                                         Introduction
                                                                                           each option comes with its own challenges:
                                   Future plan).
     Council tries to                                                                        Rates – rates are a form of tax, and the basic principle of a tax is that
                                    For us to be able to create long term or annual              everyone pays, to benefit the greater community. Rates account for the
    ensure they spread              budgets using these methods of spreading the                 majority of our revenue. One of our biggest challenges is keeping rates at an
                                    costs between both current and future ratepayers,            affordable level for the majority of the community and spreading the costs in a
     the costs in a fair,           we have to make a number of assumptions and                  fair and equitable way.
                                    estimates about what might happen in the future
        equitable and               (such as how much the project might cost, how            Fees and charges – fees and charges charge people for specific services
       affordable way               many years the plant might last, the number of               that they benefit from – such as charging people to use the pools, or charging
                                    new subdivisions that may be developed, when                 the applicant for the costs of a building consent. The challenge with fees
                                    and where the growth may occur, etc). The future             and charges is finding a balance between recovering costs without making
will never turn out exactly as we expect, but we have based our assumptions on                   services so expensive that people are discouraged from using them.
the best information that we have available to us now. You can read more about the
significant assumptions we have made and how they could impact on the financial
                                                                                             Subsidies and grants – we receive some subsidies and grants from
                                                                                                 Government agencies, particularly towards the cost of maintaining our
aspects of our plan in part three of the Our Community Our Future plan.
                                                                                                 roading network. Throughout the Our Community Our Future plan we have
Keeping rates affordable                                                                         assumed that the amount of roading subsidy we currently receive will remain
                                                                                                 relatively constant for the foreseeable future, however, our costs are likely to
The New Zealand population is getting older – and so is the population in our district.
                                                                                                 increase meaning that decisions will need to be made in the future on whether
An aging population means there will be a higher proportion of fixed incomes (e.g.
                                                                                                 to cut the standard of service we provide or to fund the shortfall another way
increasingly more people earning a pension than a salary), plus, statistics show that
                                                                                                 (such as increase rates).
the average household income in our district is slightly below the national average.
The current global financial crisis has hurt businesses and employment in the district       Development contributions – as discussed above, we charge development
over recent years, and the outlook and timing of recovery is uncertain. All these                contributions to developers to ensure they share the costs of the additional
factors mean that significant annual rates increases are not practical or affordable for         demand they place on our infrastructure and services. Aside from trying to
a large percentage of our community.                                                             predict when the additional demand may occur, we also have to recover an
                                                                                                 appropriate level of costs, without imposing charges so high that they deter
When deciding how to fund services, we need to consider how to spread the costs
                                                                                                 development altogether.
in a way that is fair, equitable and affordable for the majority of the community.
Our district has a mix of rural and urban properties - the farms and rural properties        Interest and dividends from investments (including Power New Zealand
in our district do not receive some services that are available to properties in our             (PNZ) investment fund) – a small portion of our revenue comes from
towns (such as water, wastewater, and rubbish collection), so those property owners              interest earned on surplus cashflow funds invested throughout the year, and
don’t pay for those services through targeted rates. The majority of the significant             from dividends received from the overseas investment fund (refer to further
capital projects undertaken in recent years (apart from roading) benefit residents and           information on the fund in the following pages). We use this interest and
ratepayers in urban areas, meaning that the bulk of our cost increases have fallen on            dividends to pay operational expenditure; this effectively subsidises rates,
urban ratepayers.                                                                                because if we didn’t have the interest and dividends, the community would
                                                                                                 have to pay for this operational expenditure through rates. Any decisions to

                                                                                                                                                                                    12

                                                                                                                        Our Community Our Future 2012-22 Part One – Introduction
withdraw the overseas investment (and not reinvest the money in a similar          future rate increases by concentrating on the essential services we provide.
                          manner) must consider how the funding shortfall will be made up each year.
                                                                                                             So how do we determine what services are “essential”? There are obvious essential
                       Borrowing – as explained above, we borrow money and pay it off over a               services like sanitation, health and safety, or meeting statutory requirements, but
                          number of years to ensure that those who benefit from a service in the future      there are other services that are not so easy to classify – for example, not all people
                          will also pay their share. Borrowing is not a source of revenue in itself, but a   would see economic development as an essential service for Council to be involved
                          way of bridging the cashflow requirements associated with large projects. The      in, however, it’s important that we don’t allow the district to stagnate, miss out on
                          obvious downside of borrowing is that we have to pay interest on the loan          opportunities or go backwards by not investing anything in its future. This means
                          well into the future, and changes in interest rates are outside of our control.    that if projects are important to our community and its future and the community tell
                          We can borrow money from external organisations (such as banks), or we can         us so, we need to allow some flexibility to be able to take up these opportunities as
                          also borrow internally using available funds (for example, borrowing funds         they arise, while still keeping rate increases to a minimum.
                          from the overseas investment fund for a specific capital project).
                                                                                                             To try to achieve the right balance, we have set out some basic steps and guidelines
                  Our Revenue and Financing Policy in part three of the Our Community Our Future             for our decision making to ensure that we get both sides of the equation right:
                  plan outlines how we have decided to fund our activities and services based on a
                                                                                                             1.   review the current services we provide and consider future proposals to
                  range of considerations set out in this policy.
                                                                                                                  determine if they are “essential” for us to achieve our vision and the levels of
                  How will we achieve our vision for 2022?                                                        service we have agreed with the community. We rely on community feedback to
                                                                                                                  guide us on this
                  The key to achieving our vision for 2022 is all about finding the right balance
                  between providing an acceptable standard of services at a level that is affordable for     2.   continually look for ways to be more efficient to ensure that our ratepayers are
                  our community both now and in the future.                                                       getting value for money
                  In August 2011, we asked the community for feedback on how they best thought               3.   review the Revenue and Financing Policy to ensure that our decisions on the
                  we could try to achieve this balance – specifically seeking feedback on future rate             fairest way to fund our activities and services remain equitable
                  increases, debt and changes to the standard of services we provide. We received
                  submissions from over 800 people on the three options presented. The options               4.   set limits on our rates for each of the next ten years. This will help ensure that
                  included:                                                                                       rates remain affordable and at a level that our community is willing to pay

                  1.    minimising future rate increases by concentrating only on the current services       5.   set limits on the level of borrowing we will commit ourselves to (because of the
                        and the 'have to dos' (things we’re required to do to meet safety or statutory            significant and ongoing costs that debt imposes on future generations)
                        requirements),                                                                       6.   consider our objectives for and set targeted levels of returns from our
                  2.    reducing the 'choose to dos' (services or projects that contribute to wellbeing           investments
                        like swimming pool upgrades) in order to reduce future rate increases and            7.   when pulling together the budgets and looking at the proposed levels of service,
                        minimise the need to raise debt,                                                          and ensuring that the specified limits are adhered to, we will then look at the
                  3.    providing additional 'choose to do' services that would increase both debt and            overall picture to determine whether the planned programs are affordable or
                        rates but provide additional services/facilities for our community.                       whether some hard decisions need to be made with the community to reduce,
                                                                                                                  defer or reconsider providing some services.
                  The almost equal split in feedback across the three options only served to
                  demonstrate how challenging our decision making can be. Overall though, the
                  results show that two thirds of the submitters favoured minimising the impact of

13

Part One – Introduction Our Community Our Future 2012-22
What have we done                                                                                                               Limits on rates
In developing the Our Community Our Future plan to try and achieve our vision,                                                  Our priority is to keep rates at an affordable level that the community is willing to pay.

                                                                                                                                                                                                                                                                                          Introduction
we’ve followed the steps above – this is what we’ve done to follow them:
                                                                                                                                We know that our costs will continue to increase due to inflation and interest and the
Review of current levels of service and future proposals                                                                        other factors discussed earlier, and that our revenue from rates will have to increase
                                                                                                                                to cover this. We want to give you, the ratepayer, some certainty however that this
We have reviewed community feedback gathered through customer surveys,                                                          revenue will be contained to a certain level. Based on the levels of service that we
complaints, community consultation exercises and submissions relating to the range                                              have set out in this Our Community Our Future plan and the key assumptions that
and levels of service we provide. The feedback received showed that the community                                               we have made, our forecasting shows that our total rates revenue (i.e. the total
are generally happy with the levels of service currently provided, so we have not                                               amount of rates that we collect each year from all ratepayers) will need to increase
made any significant changes.                                                                                                   annually as follows:
Look for efficiencies
We have and will continue to scrutinise all areas of our operations to ensure that we                                                                                  Forecast increase in total rate revenue for the next ten years*
are using public funds in the most efficient and effective manner. Our focus over the
                                                                                                                                                                      9.00%
first few years of the plan is on the Community Facilities group of activities. These
                                                                                                                                                                      8.00%                                                                                        7.64%

                                                                                                                                  Percentage increase in total rate
activities are considered to have more discretionary and non-essential services e.g.

                                                                                                                                   revenue from the previous year
berm mowing.                                                                                                                                                          7.00%
                                                                                                                                                                              6.22% 6.12%
We have discontinued funding depreciation for non-critical buildings, for example the                                                                                 6.00%                                               5.34% 5.85%
Firth Tower buildings as these are not considered to be essential to the delivery of                                                                                  5.00%                           4.72%
agreed levels of service. This has reduced the rates required by $4.3 million over the                                                                                4.00%
next ten years. This also means however, that funds will not be available to maintain                                                                                 3.00%
or replace those buildings in the future, but there would be nothing to stop the                                                                                                                                                                         2.31%
                                                                                                                                                                      2.00%                                     1.79%
community undertaking local fundraising to maintain the buildings if they wanted to.                                                                                                                                                           1.12%
                                                                                                                                                                      1.00%                                                                                                  0.79%
Review of who pays for what                                                                                                                                           0.00%
We have reviewed our Revenue and Financing Policy, which works through how

                                                                                                                                                                                                                                                                              2
                                                                                                                                                                                   3

                                                                                                                                                                                             4

                                                                                                                                                                                                       5

                                                                                                                                                                                                                 6

                                                                                                                                                                                                                           7

                                                                                                                                                                                                                                      8

                                                                                                                                                                                                                                                9

                                                                                                                                                                                                                                                          0

                                                                                                                                                                                                                                                                    1

                                                                                                                                                                                                                                                                             /2
                                                                                                                                                                               /1

                                                                                                                                                                                            /1

                                                                                                                                                                                                      /1

                                                                                                                                                                                                                /1

                                                                                                                                                                                                                          /1

                                                                                                                                                                                                                                    /1

                                                                                                                                                                                                                                               /1

                                                                                                                                                                                                                                                         /2

                                                                                                                                                                                                                                                                   /2
our activities and services should be funded and who should pay what share of the

                                                                                                                                                                                                                                                                         21
                                                                                                                                                                              12

                                                                                                                                                                                        13

                                                                                                                                                                                                  14

                                                                                                                                                                                                            15

                                                                                                                                                                                                                      16

                                                                                                                                                                                                                                 17

                                                                                                                                                                                                                                           18

                                                                                                                                                                                                                                                     19

                                                                                                                                                                                                                                                               20

                                                                                                                                                                                                                                                                        20
                                                                                                                                                                          20

                                                                                                                                                                                       20

                                                                                                                                                                                                 20

                                                                                                                                                                                                           20

                                                                                                                                                                                                                     20

                                                                                                                                                                                                                               20

                                                                                                                                                                                                                                          20

                                                                                                                                                                                                                                                    20

                                                                                                                                                                                                                                                              20
costs. We asked for community feedback on this for some specific activities in the
August 2011 “Decisions for the future of our community” booklet.                                                                                                                                                               Year
                                                                                                                                                                          Revaluations of our assets occur in these years
The outcome of that consultation confirmed that people generally consider the
current system to be fair and equitable. The community agreed that the costs of
growth should continue to be met by developers. There was some support for
                                                                                                                                We have almost completed the single largest capital project this Council has ever
changing to a more user pays system for our water and wastewater services. From 1
                                                                                                                                undertaken - the Morrinsville wastewater plant upgrade. The increases in 2012/13
July 2012 we will phase in a change to a targeted rate for wastewater based on the
                                                                                                                                and 2013/14 shown in the graph are largely due to the additional ongoing costs
number of pans (for non-residential properties) and we have proposed a remission
                                                                                                                                that will be incurred as a result of this capital project (e.g. interest on the loans that
policy based on water use, as this more fairly reflects the user pays model.
                                                                                                                                funded the project, depreciation and operating costs).
*Total revenue excludes targeted rates for wastewater charged to specific industry for their contribution to the Morrinsville
Wastewater Treatment Plant upgrade.

                                                                                                                                                                                                                                                                                     14

                                                                                                                                                                                                      Our Community Our Future 2012-22 Part One – Introduction
The graph also shows that the amount of rates revenue required increases in those                                            for each of the ten years. To put this into perspective, for 2011/12 the average
                  years following the three-yearly revaluation of our assets. These revaluations are a                                         annual rates is 3.25% of the average annual household income, and our proposal is
                  chance to “catch up” (in our books) on what it would cost to replace the assets if                                           not to increase to any more than 4% as shown in the graph below.
                  we had to do it at that time. The cost to replace the assets increases due to inflation
                  and market movements for property. We ‘depreciate’ our assets (such as buildings,
                  pipe, treatment plants, roads etc) and collect rates for this cost so that we can afford                                                    Forecast average annual rates* as a percentage of forecast
                  to maintain the assets and replace them in the future. As the value of the assets                                                                       average annual household income
                  increases we need to increase rates, so that what we are charging covers the cost of                                                4.50%
                  maintaining and replacing the assets in the future.                                                                                 4.00%
                                                                                                                                                      3.50%
                  We will limit total rate revenue increases to a level that meets the forecast
                  increase in costs, as set out in this plan. You can see the forecasted increases in                                                 3.00%
                  the graph on the previous page opposite. This means that if any additional expenses                                                 2.50%
                                                    or proposals are put in front of Council for                                                      2.00%
                                                    consideration, then a cut would need to be made                                                   1.50%
                                                    from other areas that are already funded from
                                                                                                                                                      1.00%
                                                    rates, or the proposal would have to be funded in
                                                                                                                                                      0.50%
                       Council has set              some other way (e.g. user charges).
                                                                                                                                                      0.00%
                                                       We also looked for some way to measure or
                          limits on future

                                                                                                                                                                                                                                                             2
                                                                                                                                                                  3

                                                                                                                                                                            4

                                                                                                                                                                                      5

                                                                                                                                                                                                6

                                                                                                                                                                                                          7

                                                                                                                                                                                                                    8

                                                                                                                                                                                                                               9

                                                                                                                                                                                                                                         0

                                                                                                                                                                                                                                                   1

                                                                                                                                                                                                                                                            /2
                                                                                                                                                                /1

                                                                                                                                                                           /1

                                                                                                                                                                                     /1

                                                                                                                                                                                               /1

                                                                                                                                                                                                         /1

                                                                                                                                                                                                                   /1

                                                                                                                                                                                                                             /1

                                                                                                                                                                                                                                        /2

                                                                                                                                                                                                                                                  /2
                                                       perhaps benchmark whether the rates we charge,

                                                                                                                                                                                                                                                        21
                                                                                                                                                             12

                                                                                                                                                                       13

                                                                                                                                                                                 14

                                                                                                                                                                                           15

                                                                                                                                                                                                     16

                                                                                                                                                                                                               17

                                                                                                                                                                                                                          18

                                                                                                                                                                                                                                    19

                                                                                                                                                                                                                                              20

                                                                                                                                                                                                                                                       20
                                                                                                                                                           20

                                                                                                                                                                      20

                                                                                                                                                                                20

                                                                                                                                                                                          20

                                                                                                                                                                                                    20

                                                                                                                                                                                                              20

                                                                                                                                                                                                                        20

                                                                                                                                                                                                                                   20

                                                                                                                                                                                                                                             20
                        rate increases                 are and will continue to be affordable over the next
                                                                                                                                                                                                                   Year
                                                       ten years. Of course everyone’s circumstances
                                                       and financial situations are different, and those                                                   Forecast average annual rates as a % of forecast annual average household income
                                                       living in rural areas are not subject to significant                                                Limit set at 4%
                                                       targeted rates for water, wastewater, refuse etc that
                                                       are charged for urban properties. There is not one
                                                                                                                                               *Total revenue excludes targeted rates for wastewater charged to specific industry for their contribution to the
                  measure of affordability that will fit all, but it is important to have a consistent point                                   Morrinsville Wastewater Treatment Plant upgrade.
                  to anchor to, so that we can judge whether the rates we are charging are in touch
                  with what’s happening in our community. As such, we have imposed a limit that                                                Where can you learn more about rates?
                  average annual rates1 will not increase to more than 4% of forecast average
                                                                                                                                               Our Revenue and Financing Policy in part three describes the considerations when
                  annual household income2
                                                                                                                                               selecting sources of funding for an activity (including rates). Our Council-wide
                                                                                                                                               funding impact statement (also in part three) outlines the total revenue we intend to
                                                                                                                                               generate from these funding sources over each of the ten years of this plan. Then
                  1
                    “Average annual rates” is the total rates revenue (including GST), divided by the projected number of rating units (i.e.   the calculation of rates shows how the total rates revenue required will be calculated
                  allowing for growth set out in our Growth Strategy .                                                                         and charged against each rating unit. In addition, under 'Examples of the impact
                  2
                    The forecast average annual household income is sourced from Statistics New Zealand’s Household Economic
                  Survey to 30 June 2011. We have used the average annual household income for the “other North Island” region
                                                                                                                                               of rating 2012/13' in part three of this plan there is also a table showing examples
                  being $67,505 and have then forecasted to 2021/22 using independent forecasting data from Business and Economic              of how the rating decisions for the first year of the plan affect a range of “indicator
                  Research Limited (BERL).                                                                                                     properties”, including some more specific properties where rates for this year, or

15

Part One – Introduction Our Community Our Future 2012-22
decisions made in previous years will have a significant impact from 2012/13 (e.g.
pan charges for non-residential wastewater connections, and the impact for the first                                                                                                       Council will limit their borrowing to
year of wastewater and stormwater rates for Waharoa properties).

                                                                                                                                                                                                                                                            Introduction
                                                                                                                                                                                           150% of their annual income. This
Limits on borrowing
To ensure we can achieve the vision for 2022, “Council is in a sound financial                                                                                                             sounds like a lot but is actually less
position, and comfortably placed to be able to continue to provide for its community
well into the future”, we have to be careful that we do not overburden future                                                                                                               than a typical household paying a
generations with debt by living beyond our means today. At the same time, we also
want the ratepayers of the future to pay their share. In order to find an appropriate
                                                                                                                                                                                                            mortgage
balance, we need to set some limits on borrowing. We’ve sought professional advice
on an appropriate ‘limit’ for our borrowing, and these limits are included in our
Liability Management Policy (in part three of the Our Community Our Future plan). The
                                                                                                                                                                             Our total debt is forecast to peak at around $75 million in 2019/20. To
limits have regard for Council’s long term financial sustainability that future lenders will
                                                                                                                                                                             try to put that figure into perspective, the graph below compares our
look for when we need to secure finance in future years.
                                                                                                                                                                             estimated level of borrowing to what may be a typical household, say
A limit on a prudent level of debt has been set as follows: Net debt as a percentage                                                                                         with an income of $60,000 and a mortgage of $250,000.
of total revenue will not exceed 150%. The graph below shows how our forecasted
debt compares to this limit set.

                                                                                                                                                                                      Borrowing as percentage of annual income
                                              Net debt as a percentage of total revenue                                                                                     450%

                                                                                                                                             Borrowing as a percentage of
                                                                                                                                                                            400%
                              160%
                                                                                                                                                                            350%

                                                                                                                                                   annual income
                              140%
                                                                                                                                                                            300%
                              120%
  Net debt as percentage of

                                                                                                                                                                            250%
                              100%                                                                                                                                          200%
        total revenue

                              80%                                                                                                                                           150%
                              60%                                                                                                                                           100%
                              40%                                                                                                                                           50%
                                                                                                                                                                             0%
                              20%
                                                                                                                                                                                       Household             MPDC       Recommended industry limit
                               0%-                                                                                                                                                                                        (for a Council our size)
                              20%
                                                                                                                                      2
                                          3

                                                    4

                                                              5

                                                                        6

                                                                                  7

                                                                                            8

                                                                                                      9

                                                                                                                  0

                                                                                                                            1

                                                                                                                                     /2
                                      /1

                                                   /1

                                                             /1

                                                                       /1

                                                                                 /1

                                                                                           /1

                                                                                                     /1

                                                                                                                /2

                                                                                                                           /2

                                                                                                                                          The graph illustrates that while $75 million is a lot to borrow, our debt level is actually
                                                                                                                                 21
                                     12

                                               13

                                                         14

                                                                   15

                                                                             16

                                                                                       17

                                                                                                 18

                                                                                                             19

                                                                                                                       20

                                                                                                                                20

                                                                                                                                          lower than a typical household paying a mortgage on their home.
                                 20

                                              20

                                                        20

                                                                  20

                                                                            20

                                                                                      20

                                                                                                20

                                                                                                           20

                                                                                                                      20

                                                                                       Year
                                                                                                                                          A limit of 150% of income is considered conservative for a council of our size, and
                                                                            Forecast                      Limit

                                                                                                                                                                                                                                                       16

                                                                                                                                                                                              Our Community Our Future 2012-22 Part One – Introduction
is in line with limits that other similar sized councils have adopted 150% is the                                              Security for our borrowing
                  maximum limit - it is not a target. Our debt is expected to be, on average, around                                             Our borrowing is secured by a charge over rates revenue by way of a debenture
                  116% of our income over the next ten years. The graph also shows that in the future                                            trust deed. Utilising rates revenue as security lowers the risk involved for lenders and
                  we could borrow more money to pay for more of the “choose to do” facilities or                                                 therefore will lower the cost of our borrowing. Generally assets are not offered as
                  projects, if that‘s what the community wants us to do; however this would mean that                                            security for any loan or performance of any obligations under other arrangements.
                  rates would have to increase to pay for the interest on the new loans.
                  More importantly than the actual level of debt is our ability to meet the ongoing cost                                         What we expect from our investments
                  of the debt (i.e. interest). We have set a limit (in line with our borrowing policy) as                                        Our investment policy in part three of this plan sets out the detail of the type of
                  follows: Annual interest costs will be less than 15% of total revenue and 20%                                                  investments we currently hold, and our objectives and risk management strategies
                  of rates revenue. Our current forecasts show that we can comfortably meet these                                                related to holding these investments.
                  limits, as shown on the graph over the page.
                                                                                                                                                 Aside from the treasury investments that we use to effectively manage our cashflow,
                                                                                                                                                 there are two other main types of investments we currently hold.
                      Annual interest costs as a percentage of rates revenue and total revenue                                                   Firstly, we have the Power New Zealand (PNZ) investment fund. The fund was
                                        25%                                                                                                      established in 1998 using the proceeds of the $24 million from the sale of Power
                                        20%
                                                                                                                                                 New Zealand shares that were allocated to Council on the disestablishment of the
                     a percentage of
                     Interest cost as

                                                                                                                                                 Power Board. There are two components to the PNZ fund:
                                        15%
                         revenue

                                        10%                                                                                                         $11.9 million of the fund was used in lieu of obtaining borrowing from an
                                        5%
                                                                                                                                                        external source to fund capital projects for various activities of Council (we
                                                                                                                                                        refer to this as internal borrowing). A return on our internal borrowing equal to
                                        0%
                                                                                                                                                        the five year swap rate at 1 July each year plus 0.25% is budgeted annually,

                                                                                                                                             2
                                                   3

                                                             4

                                                                       5

                                                                                 6

                                                                                           7

                                                                                                     8

                                                                                                               9

                                                                                                                         0

                                                                                                                                   1

                                                                                                                                            /2
                                               /1

                                                            /1

                                                                      /1

                                                                                /1

                                                                                          /1

                                                                                                    /1

                                                                                                              /1

                                                                                                                        /2

                                                                                                                                  /2
                                                                                                                                                        and charged to the various activities that have utilised this funding. This

                                                                                                                                        21
                                              12

                                                        13

                                                                  14

                                                                            15

                                                                                      16

                                                                                                17

                                                                                                          18

                                                                                                                    19

                                                                                                                              20

                                                                                                                                       20
                                          20

                                                       20

                                                                 20

                                                                           20

                                                                                     20

                                                                                               20

                                                                                                         20

                                                                                                                   20

                                                                                                                             20
                                                                                                                                                        internal interest effectively reduces the rates that we would be required to
                                                                                      Year
                                                                                                                                                        collect if we had to pay interest on external loans. The balance of our internal
                                                                 Forecast interest cost as a % of total revenue                                         borrowing at 30 June 2011 was $11.9 million.
                                                                 Limit on interest cost at 15% of total revenue
                                                                 Forecast interest cost as a % of rates revenue                                     An investment policy was established for the second component of the
                                                                 Limit on interest cost at 20% of rates revenue                                         fund that provides for the placement in overseas and New Zealand equities
                                                                                                                                                        by investment advisor Michael Chamberlain and Associates New Zealand
                                                                                                                                                        Limited. The overseas equities are vested with State Street Global Advisors.
                  Future sources of borrowing                                                                                                           Initially, $12.45 million was invested in the security market in 1999. The
                  Council intends to utilise the newly created New Zealand Local Government                                                             value of the fund has fluctuated over the years to a high of $15.6 million in
                  Funding Agency (LGFA) as a potential source of future debt funding where this is                                                      2007, and a low of $8.6 million in September 2011. At 31 December 2011 the
                  advantageous to us. The LGFA is predicted to be able to offer us lower rates of                                                       balance was $9 million.
                  interest (than a traditional bank) and a secure source of future funding. There are also
                  risks associated with our participation in the LGFA. These are outlined further at the                                                Given the volatility of the overseas markets, and after consultation with the
                  end of part three of this plan.                                                                                                       community, Council resolved to commence the realisation of the shares when
                                                                                                                                                        the market value achieves its 1 July 2007 value of $15.6 million. The fund

17

Part One – Introduction Our Community Our Future 2012-22
You can also read