Brown Edge Parish Housing Needs Assessment (HNA)
←
→
Page content transcription
If your browser does not render page correctly, please read the page content below
Brown Edge Parish Housing
Needs Assessment (HNA)

February 2018
Brown Edge Parish HNA
                                                FINAL DRAFT
Quality information
Prepared by                           Checked by                            Approved by

Ivan Tennant – Principal Planner      Steven Smith – Technical Director
Lachlan Anderson-Frank –
Assistant Consultant

Revision History
Revision            Revision date     Details              Authorized     Name             Position

1                   November 2017     Research and         IT             Ivan Tennant     Principal Planner
                                      drafting

2                   December 2017     Internal review      SS             Steven Smith     Technical Director
                        st
3                   1 February 2018   Community Review PT                 Peter Turner     Brown Edge Parish
                                                                                           Council

                    Feb 2019          Project Coordinator MK              Mary Kucharska   Senior Consultant
                                      review

                                                                                                        AECOM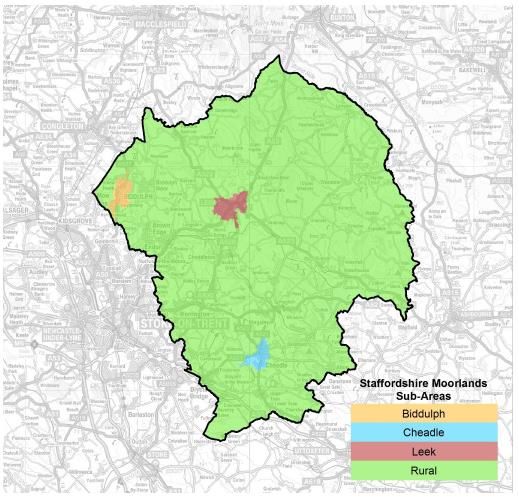
Brown Edge Parish HNA
                                             FINAL DRAFT

Prepared for:
Brown Edge Parish Council

Prepared by:

AECOM
Aldgate Tower
2 Leman Street
London
E1 8FA
aecom.com

© 2018 AECOM Limited. All Rights Reserved.

This document has been prepared by AECOM Limited (“AECOM”) for use of Locality (the “Client”) in accordance
with generally accepted consultancy principles, the budget for fees and the terms of reference agreed between
AECOM and the Client. Any information provided by third parties and referred to herein has not been checked or
verified by AECOM, unless otherwise expressly stated in the document. No third party may rely upon this
document without the prior and express written agreement of AECOM.

                                                                                                        AECOM
Brown Edge Parish HNA
FINAL DRAFT
Table of Contents
1. Executive Summary .................................................................................................................................. 1-7
2. Context ...................................................................................................................................................... 15
2.1 Local context .................................................................................................................................. 15
2.2 Planning policy context ................................................................................................................... 15
3. Approach ................................................................................................................................................... 18
3.1 Research questions ........................................................................................................................ 18
3.2 Quantity .......................................................................................................................................... 18
3.3 Tenure............................................................................................................................................. 18
3.4 Type and size ................................................................................................................................. 18
3.5 Housing for specialist groups .......................................................................................................... 18
3.6 Study objectives ............................................................................................................................. 18
3.7 The Housing Market Area ............................................................................................................... 19
4. RQ1 Quantity ............................................................................................................................................. 23
4.1 Local Plan/District target ................................................................................................................. 23
4.2 SHMA ............................................................................................................................................. 24
4.3 DCLG household projections .......................................................................................................... 24
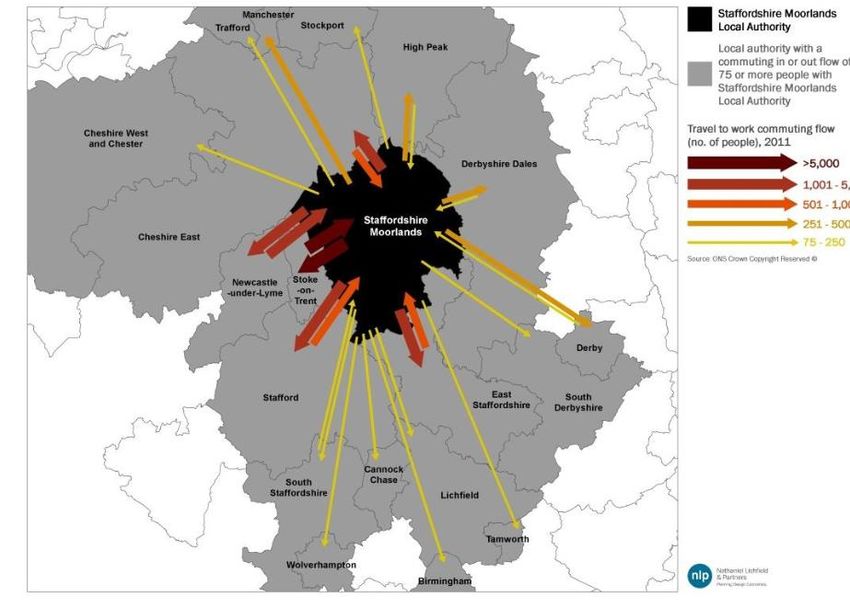
4.4 Home growth 2001 – 2011 .............................................................................................................. 25
4.5 Home growth since 2011 ................................................................................................................ 25
4.6 The standard methodology ............................................................................................................. 26
5. RQ2 A) What affordable housing (social housing, affordable rented, shared ownership, intermediate
rented) and market housing tenures should be included in the housing mix? ............................................ 27
5.1 Definitional issues ........................................................................................................................... 27
5.2 Current tenure profile ...................................................................................................................... 28
5.3 Age structure .................................................................................................................................. 28
5.4 Household composition .................................................................................................................. 31
5.5 Affordability ..................................................................................................................................... 33
5.6 Housing waiting list ......................................................................................................................... 38
5.7 Market segmentation ...................................................................................................................... 39
5.7.1 Arrows analysis .............................................................................................................................. 39
5.7.2 ‘Starter Homes’ and discounted market housing ............................................................................ 41
5.7.3 Shared ownership ........................................................................................................................... 43
5.7.4 Affordable Rented Dwellings .......................................................................................................... 43
5.7.5 Affordable Housing Ratios .............................................................................................................. 44
6. RQ2 B) What tenure of market housing (private rented and housing for sale) should be included in
the housing mix? ........................................................................................................................................ 44
6.1 Build to rent .................................................................................................................................... 44
7. RQ3: Type and size ................................................................................................................................... 45
8. RQ4: Specialist housing (eg, What provision should be made for retirees and the elderly?) ..................... 48
8.1 Sheltered and extra-care housing ................................................................................................... 48
8.2 Retirement villages ......................................................................................................................... 49
8.3 Senior Co-housing .......................................................................................................................... 49
8.4 Multi-generational homes ............................................................................................................... 49
8.5 Lifetime Homes ............................................................................................................................... 49
8.6 Right-sizing ..................................................................................................................................... 50
8.7 Planning flexibility ........................................................................................................................... 50
8.8 Lifetime neighbourhoods ................................................................................................................ 50
8.9 Age-friendliness .............................................................................................................................. 50
8.10 Housing for people with Dementia .................................................................................................. 51
8.11 The role of the Local Authority ........................................................................................................ 52
9. Market signals ............................................................................................................................................ 53
AECOM
Brown Edge Parish HNA
                                                                 FINAL DRAFT
       9.1       Employment and commuting .......................................................................................................... 53
       9.2       Housing market .............................................................................................................................. 55
       9.3       Overcrowding and concealment ..................................................................................................... 57
       9.4       Rate of development....................................................................................................................... 57
10.    Conclusions ............................................................................................................................................... 59
       10.1      Overview......................................................................................................................................... 59
       10.2      Recommendations for next steps ................................................................................................... 63

                                                                                                                                                           AECOM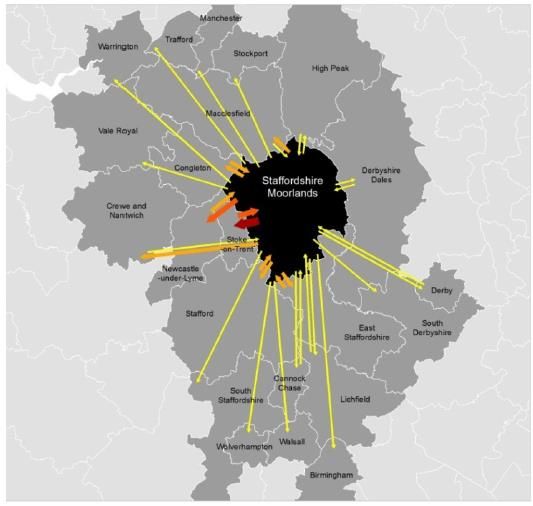
AECOM                                                      1-6

List of acronyms used in the text:

AH      Affordable Housing (NPPF definition)

AMH     Affordable Market Housing

BEPC    Brown Edge Parish Council

DCLG    Department for Communities and Local Government

HNA     Housing Needs Assessment

LPA     Local Planning Authority

NA      Neighbourhood Area

NDP     Neighbourhood Development Plan

NP      Neighbourhood Plan

NPPF    National Planning Policy Framework

ONS     Office for National Statistics

PPD     Land Registry Price Paid Data

PPG     Planning Practice Guidance

PRS     Private Rented Sector

RTF     Rural Town and Fringe

SHLAA Strategic Housing Land Availability Assessment

SHMA    Strategic Housing Market Assessment

SMDC    Staffordshire Moorlands District Council

UKHPI UK House Price Index

                                                          AECOM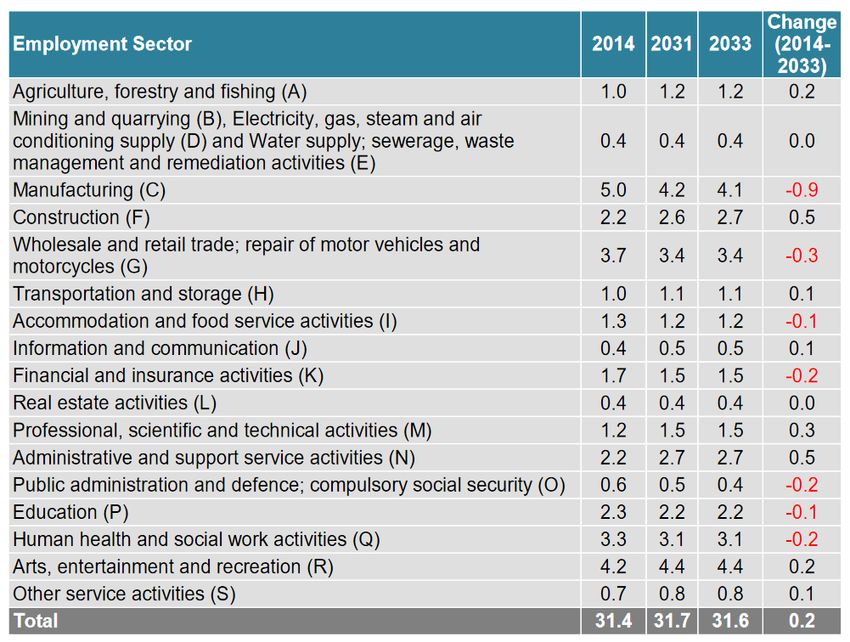
AECOM                                                                                                           1-7

1. Executive Summary
Introduction
1.      The 2011 Localism Act introduced neighbourhood planning, allowing Parishes such as Brown Edge, town councils or
        neighbourhood forums across England to develop and adopt legally binding development plans for their
        neighbourhood areas.

2.      As more and more town or Parish councils and neighbourhood forums seek to address housing growth, including
        tenure and type of new housing, it has become evident that housing policies need to be underpinned by robust,
        objectively assessed housing data.

3.      In the words of the national Planning Practice Guidance (PPG), establishing future need for housing is not an exact
        science, and no single approach will provide a definitive answer. The process involves making balanced judgments,
        as well as gathering numbers and facts. At a neighbourhood planning level, one important consideration is
        determining the extent to which the neighbourhood diverges from the local authority average, reflecting the fact that a
        single town or neighbourhood almost never constitutes a housing market on its own and must therefore be assessed
        in its wider context.

4.      The guidance quoted above on housing needs assessment is primarily aimed at local planning authorities preparing
        Strategic Housing Market Assessments (SHMAs), which are used to determine housing need at a local authority
        and/or housing market area level. However, it helpfully states that those preparing neighbourhood plans can use the
        guidance to identify specific local needs that may be relevant to a neighbourhood, but that any assessment at such a
        localised level should be proportionate.

5.      Our brief was to advise on data at this more local level to help Brown Edge Parish Council understand, among other
        matters, the type, tenure and quantity of housing needed in order to inform neighbourhood plan policies.
PPG-based assessment
6.      This objective and independent housing needs advice note follows the PPG approach where relevant. This ensures
        our findings are appropriately evidenced. The PPG advises that assessment of development needs should be
        thorough but proportionate and does not require planners to consider purely hypothetical future scenarios, only future
        scenarios that could be reasonably expected to occur.
Summary of methodology
7.      Housing Needs Assessment (HNA) at neighbourhood plan level can be focused either on quantity of housing
        needed, type of housing need, or both. In most cases, there is a need to focus on quantity where the housing target
        for the area being assessed is unclear, for example where the local authority has not set a specific target for the
        area, or where there is no Local Plan in place.

8.      The Local Planning Authority is currently preparing a new Local Plan to cover the period of 2016-2031, with the
        intention to publish the Preferred Options Local Plan shortly; this document puts forward a figure of 25 dwellings for
        Brown Edge. Given the maturity of this document, and its closeness to adoption, this should be used as the guiding
        authority on housing numbers. The rationale for this recommended approach is that neighbourhood plans need to
        meet a number of Basic Conditions (tested through independent examination) in order to be ‘made’ by the LPA. One
        of these, Basic Condition E, requires the Neighbourhood Plan to be in ‘general conformity with the strategic policies’
        of the Local Plan, in this case the District Core Strategy. The Government’s PPG indicates that the level of housing
                                                              1
        development is likely to count as a strategic policy.

9.      In terms of the types of housing needed, there is generally more flexibility on what neighbourhood plans can cover. In
        order to understand the types of housing needed in Brown Edge, we have gathered a wide range of local evidence
        and distilled this into policy recommendations designed to inform decisions on housing quantity and characteristics.

10. The planning period of neighbourhood plans, where possible, should always be aligned with the relevant local plan.
Gathering and using a range of data
11. The PPG states that:
             “no single source of information on needs will be comprehensive in identifying the appropriate
             assessment area; careful consideration should be given to the appropriateness of each source of
             information and how they relate to one another…Plan makers should avoid expending significant

1
    See Planning Practice Guidance Paragraph: 006 Reference ID: 2a-006-20140306

                                                                                                               AECOM
AECOM 1-8
resources on primary research (information that is collected through surveys, focus groups or interviews
etc. and analysed to produce a new set of findings) as this will in many cases be a disproportionate way
of establishing an evidence base. They should instead look to rely predominantly on secondary data
(e.g. Census, national surveys) to inform their assessment which are identified within the guidance”.
12. Compared with the 2001 Census, the 2011 Census gathered data in a number of new categories and across a range
of geographies that are highly relevant to planning at the neighbourhood level and helpful if a PPG-based approach
is being used.
13. Like much of the data forming the housing policy evidence base, the Census information is quantitative. However, at
a local level, qualitative and anecdotal data, if used judiciously, also has an important role to play, to a perhaps
greater extent than at the local authority level. We have gathered data from as wide a range of sources as
practicable in order to ensure robustness of conclusions and recommendations arising from the analysis of that data.
Focus on demand rather than supply
14. Our approach is to provide advice on the housing required based on need and/or demand rather than supply. This is
in line with the PPG, which states that “the assessment of development needs should be an objective assessment of
need based on facts and unbiased evidence. Plan makers should not apply constraints to the overall assessment of
need, such as limitations imposed by the supply of land for new development, historic under performance, viability,
infrastructure or environmental constraints”.
15. For this reason, we advise that the conclusions of this report should be assessed against supply-side considerations
(including, for example, factors such as transport infrastructure, landscape constraints, flood risk and so on) as a
2
separate and follow-on study.
Quantity of housing needed
16. Our assessment of a wide range of data sources identified five separate projections of dwelling numbers for Brown
Edge between 2016 and 2031:
A figure derived from the emerging Local Plan for Staffordshire Moorlands (which gives a total of 127
dwellings) or 8 dwellings per annum (rounded to the nearest whole number);
3
A ‘proportionate share’ derived from the SHMA, Objectively Assessed Housing Need (OAHN), providing a
total of 83 dwellings over the Plan period, or 6 dwellings per annum (rounded);
DCLG Household Projections showing growth of 86 households in Brown Edge to 2031, leading to a
projection of 81 dwellings, or 5 dwellings per annum (rounded);
A projection forward of net dwelling completion rates 2001-2016, providing a figure of 40 dwellings until
the end of the Plan period, or 3 dwellings per annum.
The Government’s proposed standard methodology for calculating housing need, provided for information
only, which generates a projection of 89 dwellings until the end of the Plan period, or 7 dwellings per annum.
17. These dwelling number projections, excluding the standard methodology, are illustrated in Figure 1 below.
2
Such an approach, clearly separating housing need assessment from dwelling capacity assessment, was endorsed by the Government
for calculating housing need at local authority level in the ministerial statement and press release ‘Councils must protect our precious
green belt land’ (DCLG, 4 October 2014, available at https://www.gov.uk/government/news/councils-must-protect-our-precious-green-
belt-land)
3
The OAHN includes the baseline demographic need, plus any adjustments made to official forecasts to account for projected rates of
household formation post 2021, past suppression of the formation of new households, the effect of past under-supply, employment
forecasts, market signals and affordable housing need (as set out in paragraph ID2a-004 of the PPG).
AECOM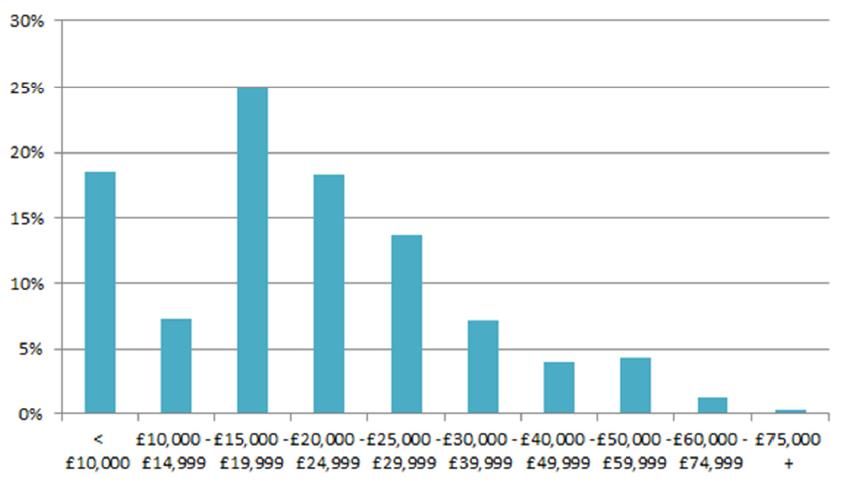
AECOM                                                                                                        1-9

Figure ES.1: Dwelling projections for Brown Edge Parish, 2016-2031

1250

1200

1150                                                                                            Emerging Local
                                                                                                Plan
                                                                                                SHMA(derived)
1100
                                                                                                DCLG Household
                                                                                                Projections-derived

1050                                                                                            Dwelling
                                                                                                completions 2001-
                                                                                                2016 derived

1000
       2001               2011                2021                2031
Source:AECOM

18. The graph above sets out the total number of homes factoring in each of the projections we have identified in Brown
    Edge. So, for example, factoring in DCLG derived data (orange line) to the number of dwellings that have already
    been built in the NA from the beginning of the Plan period in 2011 to 1st January 2016 produces a total figure of 1198
    homes by the end of the Plan period (adding together existing dwellings, and new homes that are required to be
    built).

19. The starting point to arrive at an overall projection for housing numbers to be delivered in the NA over the Plan period
    is the average of the four projections set out above (excluding the ‘standard methodology’, see page 26, which is
    provided for guidance only); we depart from this approach if we have reason to believe that a given projection should
    be awarded more weight than others, or should be excluded. For example, if the Local Plan was out of date in
    planning terms, or another projection was a clear outlier.
20. In the case of Brown Edge we do not see any justification for according any one projection greater weight, therefore
    the initial housing projection for the village is 83 additional dwellings over the Plan period (6 dwellings per annum
    rounded).

21. Notwithstanding this figure, we note that the emerging Local Plan puts forward a housing target of 25 dwellings to be
    delivered in Brown Edge Parish over a Plan period of 2016-2031. The figure of 83 set out above should therefore be
    understood as an aspirational figure that BEPC may use in the event they wish to exceed this minimum target in
    order to achieve other policy objectives, for example delivering a higher number of affordable housing units, more
    infrastructure or supporting settlement viability.

22. Moreover, a further assessment applied to this initial projection indicates that market signals (for example the
    economic context in which the NA sits, together with the performance of the housing market) are likely to impact on
    it. We have applied our professional judgment on the scales of increase and decrease associated with each relevant
    factor on a scale from one to three, where one arrow indicates ‘some impact’, two arrows ‘stronger impact’ and three
    arrows indicates an ‘even stronger impact’. Factors are set out in the table on the following page in alphabetical but
    no other order.

23. Based on the analysis and the balance of arrows set out on the following page, our conclusion is that there is no
    further uplift in housing numbers required as a result of market signals specific to Brown Edge, beyond that already
    applied by the SHMA to the figures for Staffordshire Moorlands as a whole (10%), which has already been taken into
    account in our calculations, as set out above. As such, the final housing number put forward by this HNA for
    Brown Edge is 83 additional dwellings over the Plan period, (6 dwellings per annum rounded).

                                                                                                            AECOM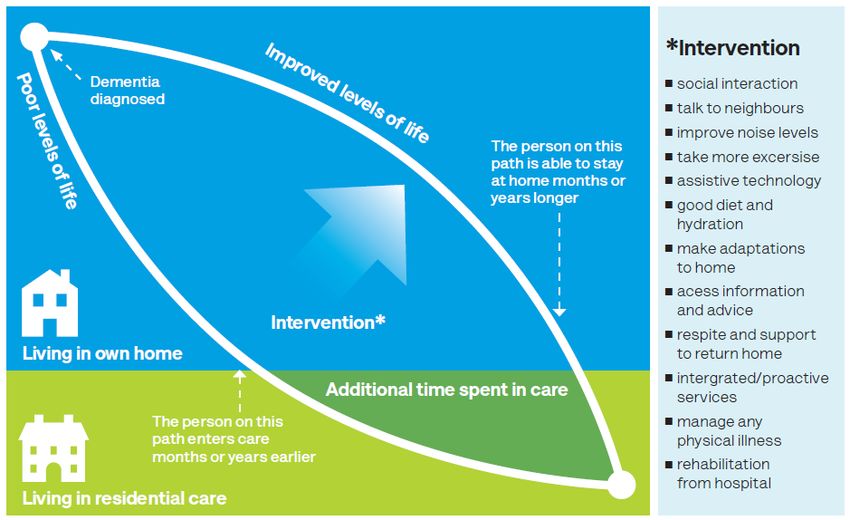
AECOM                                                                                                  1-10

Table ES.1: Summary of factors specific to Brown Edge with a potential impact on neighbourhood
plan housing quantity
Factor           Source(s) (detailed in Chapter Possible impact   Rationale for judgement
                 9)                             on future
                                                housing need

                                                    ↔
Employment       2011 Census, the Staffordshire                   Although there is a lower unemployment rate in
and commuting    Rural Economy Evidence Base;                     the NA compared to the wider District, the
                 the Staffordshire Moorlands                      Staffordshire Moorlands Economic forecasts
                 Employment Land Review 2017                      demonstrate little predicted employment growth
                 update; the Stoke-on-Trent and                   over the current Plan period. Furthermore, the
                 Staffordshire Local Enterprise                   District has a comparatively low GVA per head.
                 partnership Economic Growth
                 Strategy 2012-2026; the                          As a result, employment and commuting is not
                 Staffordshire Economic                           seen as a significant indicator of a likely future
                 Development Strategy 2012-                       increase in housing demand in Brown Edge.
                 2026; and he Staffordshire
                 Moorlands Strategic Housing
                 Market Assessment

                                                    ↓
Housing market   Land Registry Price Paid Data,                   Brown Edge has relatively lower house prices
                 Land Registry House Price                        when compared to the wider Staffordshire
                 Index                                            Moorlands District, mainly as a result of lower
                                                                  growth in prices given that, in 2007, prices in
                                                                  the village were higher on average than in the
                                                                  rest of the district. Indeed, in real terms, house
                                                                  prices have decreased in Brown Edge.

                                                                  As a result, an assessment of one down arrow
                                                                  has been deemed appropriate because prices
                                                                  have only just recovered to pre-recession
                                                                  levels, and have not experienced the same
                                                                  recovery as those across the district.

                                                    ↓
Overcrowding     Census 2011                                      There is evidence of a clear decline in
and                                                               overcrowding in Brown Edge, although there is
concealment                                                       some evidence of a higher number of family
                                                                  households with non-dependent children
                                                                  compared to the Staffordshire Moorlands
                                                                  average, and a higher rate of concealed
                                                                  families. However, the decrease in levels of
                                                                  overcrowding seen between the two censuses
                                                                  suggest that, on balance, one down arrow
                                                                  would be appropriate.

                                                    ↑↑
Rate of          Staffordshire Moorlands Local                    Brown Edge experienced a significantly slower
development      Plan-Preferred Options 2017;                     rate of growth in the number of dwellings
                 data provided by the                             between 2001 and 2011 in comparison with the
                 Neighbourhood Forum;                             rest of the District. Even counting current
                 Staffordshire Moorland SHMA                      commitments through approved planning
                 update 2017; the Staffordshire                   applications, a further 10 dwellings would need
                 Moorlands Affordable Housing                     to be built by 2021 to reach the rate of
                 Statement; and the                               development achieved between 2001 and
                 Staffordshire Moorlands District                 2011. Indeed, there has been wider under-
                 Local Plan Core Strategy                         delivery within the whole of the District and, as
                                                                  such, two up arrows are deemed appropriate to
                                                                  account for the likelihood of future under-
                                                                  delivery in Brown Edge.

                                                                                                     AECOM
AECOM 1-11
24. Our conclusions on the types and sizes, tenures, and specialist types of housing are summarised in the table below.
Table ES.2: Summary of local factors specific to Brown Edge with a potential impact on housing type
Factor Source(s) (see Possible impact on housing needed Conclusion
Chapters 4-8)
Affordable SHMA, housing In 2015 the Lower Quartile Affordability A substantial proportion (roughly 60%) of
Housing waiting list Ratio (LQAR) for the District was 7.2 the population requires subsidy to access
4
(AH) and in 2012, the Median Affordability a home suited to their needs.
Ratio (MAR) was 5.6.
Notwithstanding the Housing Waiting List
Analysis of the Income and Purchase data, policy should seek to increase the
Thresholds suggests that roughly 83% stock of affordable housing, given that it
of households in Brown Edge are provides accommodation to younger age
unable to access affordable market groups, who might otherwise be forced
housing (AMH) for sale, and 60% are into unsuitable PRS housing, or displaced
unable to access housing within the from the area.
private rented sector (PRS).
HWL data suggests the NDP should not
Housing Waiting List data from the local seek to establish its own affordable
authority indicates very weak demand housing policy (one that departs from the
for affordable housing in the NA. Local Plan policies).
Given prevailing income levels and house
prices in the area, we estimate that
between 15 and 20% of households
would be able to take advantage of
Discounted Market Sale Housing (‘Starter
Homes’). We would therefore recommend
DMSH form part of the AH quota within
the NA, seeking to fulfil the Government’s
10% policy expectation.
For Affordable Rented Dwellings (ARD) to
expand the choice of housing available to
residents in the NA, rent levels should be
set substantially below the maximum of
80% so as to avoid competition with
intermediate products.
In terms of the apportionment of AH
tenures, it is appropriate that 20% of AH
is allocated to intermediate products,
including shared ownership; in addition,
10% should be reserved for starter
homes to meet the Government’s policy
expectation. Given the relative
unaffordability of ARD in rural areas in
Staffordshire Moorlands generally, we
would suggest this is replaced with social
rented homes. As a result, we arrive at a
ratio of 10% DMSH, 20% intermediate
homes and 70% social rented homes.
4
The term ‘Affordable Housing’ denotes the planning definition set out on page 50 of the National Planning Policy Framework,
https://www.gov.uk/government/uploads/system/uploads/attachment_data/file/6077/2116950.pdf
AECOMAECOM 1-12
Factor Source(s) (see Possible impact on housing needed Conclusion
Chapters 4-8)
Demand/nee Census, SHMA One in four households comprises one Policy should seek to provide dwellings of
d for smaller person, of which a clear majority are 2 and 3 habitable rooms so as to address
dwellings aged 65+. the need for dwellings suited to one
person/couple households as well as
Small homes of 2 and 3 habitable people seeking to downsize.
rooms make up 4% of total stock in
Brown Edge. The number of small Taking into account the evidence related
homes has increased modestly over the to affordability, and the implications for
inter-censual period, increasing from the size of dwellings given demographic
some 36 dwellings to 47. shifts, there is a clear indication that there
is an imbalance in favour of large homes
Census data suggests wide-spread in the NA.
under-occupation of homes, pointing to
a shortage of smaller dwellings for
people to 'downsize' into.
The SHMA seeks a larger number of 1
and 2 bed homes (2-4 habitable rooms)
and a reduced overall proportion of 4+
bed homes (6+ habitable rooms) to
address an imbalance within the
housing stock at the District level.
Demographic The numbers of people aged between These trends raise questions as to the
change 25 and 44 fell in the NA during the inter- long term viability of services typically
censual period by 19.2%. Again, this used by younger age groups such as
mirrors trends in the wider area in schools. Indirectly it also impacts on a
which numbers of those aged under 65 wider range of businesses, given the
are forecast to fall by 10.4%. implicit reduction in the employed
population.
While the NA and District data is
broadly comparable in respect of While there being a higher proportion of
employment trends, it is worth noting retired and economically inactive people
the proportion of residents working full- is to be expected in a rural environment,
time in Brown Edge is 3.1% lower than these trends should be monitored to
the average for the District and the ensure the economically active
retired population 2.1% greater. population is sufficiently strong to support
local services and businesses.
Data from the SHMA (for the District
level over the period 2011-31)
indicates, firstly, a very substantial
increase in the numbers of those aged
65+both within one person households
and families, and, secondly, an
increase in one person households.
Family-sized Census Within the NA, the dominant household Policy should seek to arrest the decline of
housing type is families, of which those with those aged 25-44 in Brown Edge through
children form the majority. the provision of affordable dwellings of
the right size for family occupation (4 -5
There has been a loss of 75 medium habitable rooms).
sized dwellings (4 and 5 room homes)
and an increase in the number of larger
homes of 6 rooms plus of 98 dwellings
over the inter-censual period
Housing for Census, SHMA The contrast with the District area is Policy should seek to manage the
AECOMAECOM 1-13
Factor Source(s) (see Possible impact on housing needed Conclusion
Chapters 4-8)
independent particularly striking in respect of the growing elderly population through
living for proportion of families who are aged 65+ supporting the delivery of appropriate
older people (16% for the NA as opposed to 11.3% housing as well as embracing both
for the District). Lifetime Homes and Lifetime
5
Neighbourhoods principles (Lifetime
Brown Edge shows strong evidence of Homes are adaptable dwellings suited for
an aging population, with the proportion occupation by all household types; policy
of those aged 65-84 having increased may require a share of all new build
by 22.3% and those aged 85+ having homes to be designed according to its
increased by 77.1% over the inter- principles).
censual period.
Using the Learning and Improvement
This chimes with data in the SHMA that Networks (LIN) recommendations for the
forecasts in increase in those aged 65+ number of specialist dwellings per 1000
of 46% between 2011 and 2031, population of those aged 75+, we have
suggesting the trends identified in arrived at a need for:
Census data are likely to continue in
the NA over the Plan period. 6 (rounded) additional conventional
sheltered housing units
12 (rounded) additional leasehold
sheltered housing units
2 (rounded) additional ‘enhanced’
sheltered units, split 50:50 between those
for rent and those for sale
2 (rounded) additional extra care housing
units for rent
4 (rounded) additional extra care housing
units for sale
1 additional (rounded) specialist dementia
care home
Tenure of Census, Land The vast bulk (87.5%) of the dwellings PRS will continue to provide a growing
housing Registry, in the Parish are in owner occupation; role in satisfying housing need in the NA,
Home.co.uk, CLG this is in contrast to the District, in given the shortage of shared equity stock
Live Tables which 79.7% are occupied in this way. and overall affordability of for-sale homes.
While not achieving the same rate of For those ineligible for AH and who
growth as the District average, the cannot access AMH for-sale, PRS
number of private rented sector (PRS) dwellings will be attractive, underpinning
dwellings increased from 36 to 69 the growth in this market we seen in
dwellings, an increase of 91.75% over recent years.
the period.
5
‘Lifetime Neighbourhoods’ are explained in more detail in chapter 8, section 8.8
AECOMAECOM 1-14
Recommendations for next steps
25. This neighbourhood plan housing needs advice has aimed to provide BEPC with evidence on housing trends from a
range of sources. We recommend that the Parish should, as a next step, discuss the contents and conclusions with
SMDC with a view to agreeing and formulating draft housing policies, in particular the appropriate approach to
identifying the level of need for new housing in the NP area, bearing the following in mind:
Neighbourhood Planning Basic Condition A, that the plan has regard to national policies and advice
contained in guidance issued by the Secretary of State; Condition D, that the making of the neighbourhood
plan contributes to the achievement of sustainable development; and Condition E, which is the need for the
neighbourhood plan to be in general conformity with the adopted strategic development plan;
the views of SMDC – in particular in relation to the housing need figure that should be adopted;
the views of local residents;
the views of other relevant local stakeholders, including housing developers;
the numerous supply-side considerations, including local environmental constraints, the location and
characteristics of suitable land, and any capacity work carried out by the SMDC, including but not limited to
the SHLAA;
the findings and recommendations of this study; and
The impact of the new Government proposed standard methodology for calculating housing need on the
District and its neighbourhoods.
26. Recent changes to the planning system, forthcoming changes to the NPPF, as well as the implementation of the
Housing and Planning Act, will continue to affect housing policies at a local authority and, by extension, a
neighbourhood level.
27. This advice note has been provided in good faith by AECOM on the basis of housing data and national guidance
current at the time of writing (alongside other relevant and available information).
28. Bearing this in mind, we recommend that the steering group should monitor carefully strategies and documents with
an impact on housing policy produced by SMDC or any other relevant body and review the neighbourhood plan
accordingly to ensure that general conformity is maintained.
29. At the same time, monitoring ongoing demographic or other trends in the factors summarised in Tables ES.1 and
ES.2 would be particularly valuable.
AECOMBrown Edge Neighbourhood Plan
Housing Needs Assessment
DRAFT
2. Context
2.1 Local context
30. Brown Edge is a village in Staffordshire, approximately seven miles from Stoke-on-Trent. A section of the
B5051 road, running from Longport and Burslem to Endon and the A53 passes through the southern portion
of the Parish, whilst the north of the Parish is bordered by the Knypersley Reservoir and the Head of Trent
River. In common with other areas in this part of England, there are numerous streams and rivers running
through the Parish, some with weirs.
31. Brown Edge itself is a fairly spread out settlement, centered on a high street (High Lane), but
encompassing a range of different types of neighbourhoods built in various eras, as well as significant
amounts of greenspace reaching into the settlement itself, including a children’s playground set within a
field, as well as numerous other green areas, some with mature trees. Various other woodlands punctuate
the wider Parish area, including Dallows Wood and Rushymoor Wood.
32. In addition to the high street to the south of the village, encompassing an inn and shops, to the north of the
village, St. Anne’s Church and Brown Edge Hall form a civic focal point. In general however, farms surround
the village’s outskirts in most directions, giving it a mainly rural character.
2.2 Planning policy context
33. Brown Edge Parish and the NA are located within the Staffordshire Moorlands District. The Local Planning
Authority is currently preparing a new local plan to cover the period of 2016-2031, with the intention to
publish the Preferred Options Local Plan during summer 2017. As part of this, the consultation on site
allocations is currently under way to identify specific sites for future development.
34. As a result, the key strategic document providing current planning policy in the District is the Core Strategy
th
Development Plan Document (hereafter, the ‘Core Strategy’) which was adopted on 26 March 2014. The
Core Strategy is part of the Local Development Framework covering the period from 2006-2026 and
replaces the majority of saved polices from the 1998 Local Plan. The 1998 Local Plan infill boundaries have
been retained, available as part of the evidence base, but will be superseded when the new local plan is
adopted.
35. The Core Strategy states that “the rate of housing development in the Rural Areas (where Brown Edge
Parish sits) will be decreased from a past average of 85 dwellings / annum to 77 dwellings / annum
reflecting the emphasis of the strategy to focus the bulk of new development in the towns and the need for
6
strategic restraint in those areas nearest to the North Staffordshire conurbation but maintaining sufficient
7
growth to support existing communities in the rural areas” . As a result, “in the rural areas it was not
considered appropriate to identify broad locations, other than the strategic development sites which are
proposed in policy SS6c, because the limited scale of development required for any particular settlement
8
would not require strategic development areas to be identified” . However, there are a number of specific
policies which will impact future development in the Brown Edge NA.
9
36. In the planning policy explanation of Policy SS4 , the Core Strategy outlines the settlement hierarchy
across the District. Within this, Brown Edge is identified as a Larger Village (therefore subject to Policy
SS6a).
10
37. Housing developments within the Brown Edge NA are also subject to Policy H1 which states that “all
development will be assessed according to the extent to which it provides for high quality, sustainable
housing and to which it meets identified local housing market needs and the strategy for the area having
regard to the location of the development, the characteristics of the site and the economics of provision”.
Policy H1 continues to state that developments densities of 30 – 40 dwellings per hectare are expected in
urban areas and villages outside of town centers and densities of 20 – 30 dwellings per hectare in remoter
6
Comprising Stoke-on-Trent and Newcastle-under-Lyme.
7
Staffordshire Moorlands Core Strategy 2014, page 57, paragraph 7.27
8
Staffordshire Moorlands Core Strategy 2014, page 67 paragraph 8.1.4
9
Staffordshire Moorlands Core Strategy 2014, page 68 paragraph 8.1.33
10
Staffordshire Moorlands Core Strategy 2014, page 116
AECOM
15Brown Edge Neighbourhood Plan
Housing Needs Assessment
DRAFT
11
rural areas . Residential development and redevelopment on unidentified (windfall) sites will only be
permitted up an indicative maximum scheme size of 5 dwellings within the Infill Development Boundaries of
the smaller villages, currently saved from the 1998 Local Plan.
12
38. Policy H2 states that in rural areas “residential developments of 5 dwellings (or 0.16 hectares) or more
shall provide a target of 33% affordable housing on-site from all sources, unless there are exceptional
circumstances which dictate otherwise”. It continues that “unless circumstances dictate otherwise and in
agreement with the Council, 70% of all affordable dwellings provided on each site should be social rented
13 14
housing with the remainder being intermediate housing”. Policy SS2 no longer includes a target for the
minimum number of affordable housing units to be provided across the District between 2006 and 2026
“because of the uncertainty with the level of affordable housing provision to be sought from market housing
in the longer term. The current level of 33% affordable housing on market housing sites will be re-assessed
after 2016 as part of the review of the Core Strategy in the light of more up-to-date evidence on the ability of
15
sites to deliver affordable housing”.
16
39. Furthermore, Policy R2: Rural Housing states that outside of sites allocated in the Site Allocations DPD
(forthcoming), the following forms of housing development will be permitted in rural areas:
Affordable housing requirements which cannot be met elsewhere;
A new dwelling that meets an essential local need, such as accommodation for an agricultural, forestry
or other rural enterprise worker, where the need for such accommodation has been satisfactorily
demonstrated and that need cannot be met elsewhere;
Proposals for replacement dwellings, provided they do not have a significantly greater detrimental
impact on the existing character of the rural area than the original dwelling or result in the loss of a
building which is intrinsic to the character of the area; or
Extensions to existing dwellings provided they are appropriate in scale and design and do not have a
detrimental impact on the existing dwelling and the character of the rural area.
40. Policy R2 also recognises that the re-use of rural buildings for commercial purposes is preferable to that of
residential uses, providing policy recognition that in certain circumstance agricultural or commercial use
may no longer be financially viable for a rural building and that conversion to housing may be appropriate,
although the policy requires this to be demonstrated through a marketing exercise.
17
41. Finally, Policy SS3: Distribution of Development outlines the broad spatial location of the District’s
housing requirement. This is set at 6000 new homes for the entire District, with 28% of these (1680) being
developed in ‘Rural areas’ between 2006 and 2026. This comprises all locations in the District outside of
Cheadle, Biddulph and Leek (which are allocated for 22%, 20% and 30% of total home delivery
respectively).
Staffordshire Moorlands, Local Plan Preferred Options July 2017 2016-2031
42. As mentioned, the Council is currently in the process of reviewing its Local Plan; at the time of writing, the
LPA is consulting on a series of policies of relevance to the Brown Edge HNA (Local Plan Preferred Options
July 2017). This document includes the following:
Policy SS4- Neighbourhood Plans - In order to assist in meeting the development requirements for
the Local Plan, Neighbourhood Plans should maximise opportunities for housing growth in sustainable
locations. The following table (Figure 3) sets out the housing requirements for Parishes preparing a
Neighbourhood Plan. These requirements are a minimum and may be subject to review as part of the
18
District's overall review of plan delivery against its housing requirement.
43. This sets outs a minimum target of 25 dwellings that BEPC should aim to deliver over the Plan period to be
in conformity with the emerging local plan policy.
11
Staffordshire Moorlands Core Strategy 2014, page 116
12
Staffordshire Moorlands Core Strategy 2014, page 118
13
Staffordshire Moorlands Core Strategy 2014, page 118
14
Staffordshire Moorlands Core Strategy 2014, page 71, paragraph 8.1.15
15
Staffordshire Moorlands Core Strategy 2014, page 71, paragraph 8.1.15
16
Staffordshire Moorlands Core Strategy 2014, page 141
17
Staffordshire Moorlands Core Strategy 2014 Page 73
18
Staffordshire Moorlands, Local Plan Preferred Options July 2017, page 54
AECOM
16Brown Edge Neighbourhood Plan
Housing Needs Assessment
DRAFT
Table 1: Neighbourhood Plan housing requirement
Source: SMDC19
19
http://staffsmoorlands-consult.objective.co.uk/portal/local_plan/po?pointId=s1500892664317 (visited 02/10/17)
AECOM
17Brown Edge Neighbourhood Plan
Housing Needs Assessment
DRAFT
3. Approach
3.1 Research questions
44. Below we set out the RQs relevant to this study, as discussed and agreed with Brown Edge Parish Council
(BEPC).
45. Research Questions, abbreviated to ‘RQ;’ are arrived at the start of the project through discussion with the
Parish. They served to direct our research and provide the structure for the HNA.
3.2 Quantity
46. The Local Planning Authority, Staffordshire Moorlands District Council (SMDC), puts forward in their
emerging Local Plan, currently the ‘Preferred Options July 2017’ 25 dwellings for Brown Edge Parish to
be delivered over the course of its Plan period, 2016 to 2031.
47. Notwithstanding this guidance, BEPC seeks an independent assessment of the number of dwellings
required to accommodate need arising over the neighbourhood plan’s proposed Plan period (2017 – 2033)
RQ1. What quantity of housing is appropriate for the NA?
3.3 Tenure
48. While there is a belief that the settlement already offers a good mix of affordable homes, BEPC has
expressed an interest in understanding what tenure mix will be appropriate given changes affecting the
market for homes, such as demographic shifts and house prices. This study will therefore examine,
RQ2. A) What affordable housing (social housing, affordable rented, shared ownership, intermediate
rented) and B) market housing tenures should be included in the housing mix?
3.4 Type and size
49. BEPC has a particular interest in the size of future dwellings, recognising there may be a shortage of larger
homes and homes that are suitable for retirement as well as sheltered dwellings for older residents.
RQ3. What type (terrace, semi, bungalows, flats and detached) and size (number of habitable rooms) of
housing is appropriate?
3.5 Housing for specialist groups
50. BEPC has identified with reference to Census data that the average age in Brown Edge is higher than for
the District as a whole. In addition the existing nursing home of Rock Cottage suggests the settlement is a
suitable location for specialist dwellings for the elderly.
RQ4. What provision should be made for specialist housing for older people within the NA?
3.6 Study objectives
51. The objectives of this assessment can be summarised as:
collation of a range of data with relevance to housing need in Brown Edge relative to Staffordshire
Moorlands;
analysis of that data to determine patterns of housing need and demand; and
setting out recommendations based on our data analysis that can be used to inform the
Neighbourhood Plan’s housing policies.
52. The remainder of this report is structured around the objectives set out above, save for the following section
which discusses the Staffordshire Moorlands Housing Market Area, which is the basis for this study.
Chapters 4-8 set out our conclusions and recommendations based on our data analysis that can be used to
inform the Neighbourhood Plan’s housing policies.
AECOM
18Brown Edge Neighbourhood Plan
Housing Needs Assessment
DRAFT
3.7 The Housing Market Area
53. The PPG states that neighbourhood planners can refer to existing needs assessment prepared by the local
planning authority as a starting point. As Brown Edge is located within the Staffordshire Moorlands Housing
Market Area (HMA), we turned to the Strategic Housing Market Assessment (SHMA) and the SHMA Update
(SHMAU) produced on behalf of SMDC by Nathaniel Litchfield and Partners in June 2014 and February
2017, respectively. These documents represent the evidence base for SMDC’s housing policies;
henceforward, we refer to these as the ‘SHMA Studies’.
54. The SHMA studies draw upon a range of data including population projections, housing market transactions
and employment scenarios to derive the objectively-assessed housing need (OAN) for Staffordshire
Moorlands. ‘OAN’ for housing refers to the number, or range of numbers, of dwellings that should be
delivered over the Plan period if identifiable demand for housing within the HMA is to be satisfied. It may be
used as a starting point for arriving at a projection for housing need for Brown Edge. The SHMA studies also
contain a number of points of relevance relating to tenure that will be useful in answering the Research
Questions.
55. Before drawing on the SHMA, is it important to establish some definitional issues and caveats; firstly, the
SHMA makes clear the geographical spread of the HMA is not the same as the District, but covers a much
larger area, driven by the close linkages between the District and surrounding local authority areas.
Secondly, the Parish of Brown Edge falls into the rural areas of the District, and therefore exhibits
20
characteristics that distinguish it from other more urban areas. Below we reproduce Figure 1.3; this shows
the geographical arrangements of the various ‘Sub-Areas’ of which the District is made up.
Figure 1: Staffordshire Moorlands Sub-Area boundaries
Source: SHMA
56. Secondly, on account of this network of migratory and economic relationships, the geographical spread of
the HMA is to some extent uncertain. The existence of an HMA is driven by the level of ‘self-containment,’
this is the extent to which patterns of movement are contained with the geographical spread of the HMA.
57. Two key indicators are used to assess this, ‘internal migration’ (people moving house from one place in the
UK to another) and Travel to Work Areas (TTWAs). As a rule of thumb, the first of these indicators should
20
SHMA, page 8
AECOM
19Brown Edge Neighbourhood Plan
Housing Needs Assessment
DRAFT
show that be at least 70% of all house-moves take place within the HMA, and the second should exhibit
strong internal linkages, with the majority of the population employed within the HMA. If containment falls
below these thresholds, the HMA is too restricted, and should be redrawn at a larger scale.
58. As indicated earlier, in the case of Staffordshire Moorland, these two key indicators suggest close inter-
relationships between Staffordshire Moorlands and surrounding authority areas; there is, for example, a
high level of cross migration between the District and Stoke-on-Trent, meaning they are unlikely to be
21
independent housing market areas.
59. The functional boundaries of the Staffordshire Moorlands HMA therefore extend well beyond the boundaries
of the District. Below we reproduce SHMA Figure 2.4; this shows the internal migration flows within the sub-
region. Internal migrations within Staffordshire Moorlands account for 52% of all in-migration and 57% of all
out-migration (that is, migration between Staffordshire Moorlands District and the wider HMA).
Figure 2: Internal migration flows
Source: ONS Migration Statistics Unit 2011
60. Bringing this down to a more local level, SHMA data shows that the more rural parts of the District have
lower migratory self-containment rates than the urban areas. In Table 2 on the following page we reproduce
Table 2.1 from the SHMA. Brown Edge (and Endon) show a self-containment rate of 28.8%, this indicates
that house purchases on the part of ‘in-comers’ are relatively low, though still higher than Caverswall.
21
SHMA, page 16
AECOM
20Brown Edge Neighbourhood Plan
Housing Needs Assessment
DRAFT
Table 2: Staffordshire Moorlands Ward Self-containment
Source: 2001 Census
61. Other indicators, such as commuting patterns, suggest strong levels of self-containment. The 2001 Census
commuting data suggests that around 74% of all residents of Staffordshire Moorlands in employment work
within the District. Below we reproduce SHMA Figure 2.5 showing the commuting relationships between the
District and surrounding local authority areas.
Figure 3: Travel to work commuting flow
Source: Census 2001/NLP Analysis
AECOM
21Brown Edge Neighbourhood Plan
Housing Needs Assessment
DRAFT
62. Notwithstanding the stronger evidence from commuting flows, the SHMA concludes that levels of self-
containment are not considered substantial enough for Staffordshire Moorlands to be a self-contained
22
housing market area. This is a common feature of rural parts of the UK where spatial distribution of
housing, infrastructure and employment centres are more diffuse creating much larger functional housing
and economic areas than would be the case in more urban environments.
63. Bringing this analysis together, Brown Edge exists within the rural parts of the Staffordshire Moorlands
HMA; this means it will have particular characteristics that distinguish it from other parts of both the District
and wider HMA, and these will be drawn out in the course of this study through analysis of Census and
other data.
64. As a rural community, it will exhibit linkages with a large geographical area; for example, a strong economic
dependency on Stoke-on-Trent and, to some degree, other cities such as Derby. Demand for housing will
originate from across the sub-region, rather than being contained within the Parish or indeed the wider
District; this will translate into house-price growth as a result of competition for housing from people
migrating into the NA.
22
SHMA, page 18
AECOM
22Brown Edge Neighbourhood Plan
Housing Needs Assessment
DRAFT
4. RQ1 Quantity
65. We have estimated the quantity of housing needed in the NA according to five different sources; these are,
1. Local Plan (LP)
2. SHMA - proportional share drawn from OAN
3. DCLG household projections
4. Net home completion rates 2001-2011
5. Net home completion rates 2011-2015
We have also included a calculation based on the Government’s new standard methodology for calculating
housing need, although this is for information only, as the proposed approach has not been confirmed as
yet. These calculations are set out below.
4.1 Local Plan/District target
66. This target is provided as an alternative to the figures provided in paragraph 43 that BEPC may use in the
event they wish to exceed these targets in order to, for example, support settlement viability and resource
additional infrastructure.
67. Given the advanced position of the emerging Local Plan, it is reasonable to use the figures set out within
the consultation version of this document as the basis for calculating BEPC’s housing target. The
consultation version of the plan is available on the local authority's website. The figure for dwellings at the
District level, taking account of completions, comes to 5401 (6080-679), as set out in Table 3 below; we do
not take account of commitments as there is no guarantee they will be brought forward for development,
and may not eventually appear in the LPA's monitoring reports.
Table 3: District net housing requirement
23
Source: Staffordshire Moorlands
68. The proportional share may be calculated for the Parish based on the proportion of the District’s homes
found in the NA. At the time of the last Census, there were 1,107 dwellings in the NA, or 2.54% of all homes
in the District. Therefore, 137 dwellings (rounded) homes should be allocated as the ‘fair share’ of the
District target.
69. In arriving at a final total for BEPC, it is important to take into consideration that 10 dwellings were built
24
between 2012 and 2017 in the NA. Allowing for these completed dwellings, a housing target for BEPC
that is in conformity with emerging local plan policy is 127 dwellings over the period to 2031, or 10
dwellings per annum (rounded).
23
http://staffsmoorlands-consult.objective.co.uk/portal/local_plan/po?pointId=s1500892664317 (visited 02/10/17)
24
Appendix 11 of the Staffordshire Moorlands Local Plan – Preferred Options (page 4)
AECOM
23You can also read