Upper Beeding Parish Council Housing Needs Assessment - Upper Beeding Parish ...
←
→
Page content transcription
If your browser does not render page correctly, please read the page content below
Upper Beeding Parish Council
Housing Needs Assessment

November 2017
Housing Needs Assessment
Upper Beeding Parish
                                      FINAL DRAFT REPORT
Quality information
Prepared by                         Checked by                       Approved by

Ivan Tennant                        Sean Teatum, Chairman,
Lachlan Anderson-Frank              Neighbourhood Planning Group,
                                    Upper Beeding Parish Council

Revision History
Revision           Revision date   Details            Authorized    Name             Position

Draft 1            20/08/17        Technical Review                 Jesse Honey      Associate
                                                                                     Planner
Draft 2            30/08/17        Community Review                 Sean Teatum      Upper Beeding
                                                                                     Parish Council
Draft 3            02/10/17        Locality Review                  John Wilkinson   Neighbourhood
                                                                                     Planning Officer
Draft 4            10/10/17        Community/AECOM                  Sean Teatum      UBPC
                                   Review                           Ivan Tennant     AECOM
Draft 5            08/11/17        Community/AECOM                  Sean Teatum      UBPC
                                   Review                           Ivan Tennant     AECOM

                                                                                                 AECOM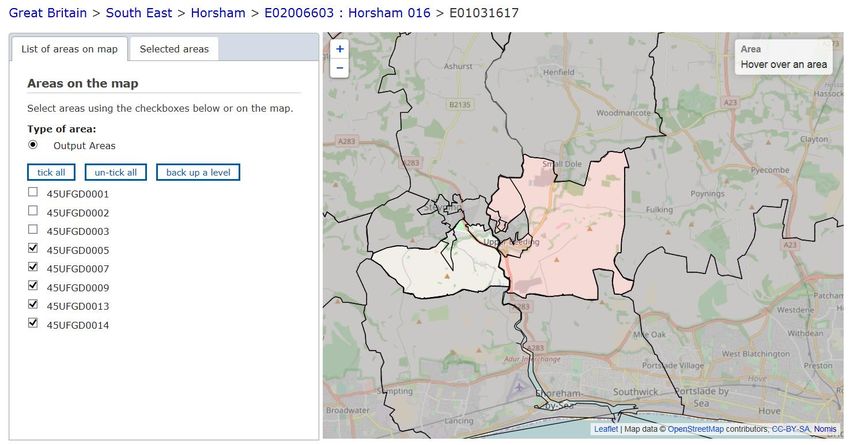
Housing Needs Assessment
Upper Beeding Parish
                                      FINAL DRAFT REPORT

Prepared for:
Upper Beeding Parish Council

Prepared by:

AECOM Limited
Aldgate Tower
2 Leman Street
London
E1 8FA
aecom.com

© 2017 AECOM Limited. All Rights Reserved.

This document has been prepared by AECOM Limited (“AECOM”) for sole use of our client (the “Client”) in
accordance with generally accepted consultancy principles, the budget for fees and the terms of reference
agreed between AECOM and the Client. Any information provided by third parties and referred to herein has not
been checked or verified by AECOM, unless otherwise expressly stated in the document. No third party may rely
upon this document without the prior and express written agreement of AECOM.

                                                                                                       AECOM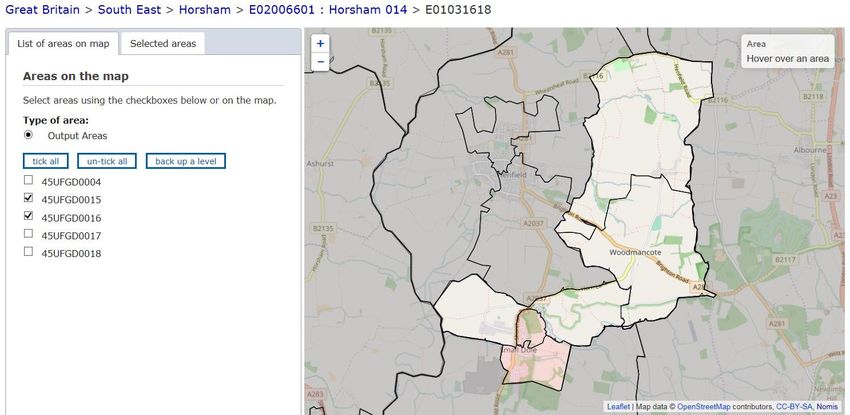
Housing Needs Assessment
Upper Beeding Parish
                                                        FINAL DRAFT REPORT

Table of Contents
0.     Executive Summary .................................................................................................................................. 0-8
       0.1      Introduction ..................................................................................................................................... 0-8
       0.2      Summary of Methodology ............................................................................................................... 0-8
       0.3      Focus On Demand Rather Than Supply ......................................................................................... 0-9
       0.4      Quantity of Housing Needed .......................................................................................................... 0-9
       0.5      Recommendations for next steps ................................................................................................. 0-15
1.     Context ...................................................................................................................................................... 16
       1.1      Local context ................................................................................................................................... 16
       1.2      Census Geography .......................................................................................................................... 16
       1.2      Local Planning context .................................................................................................................... 19
               1.3.1 Horsham District Planning Framework 2015 ............................................................................. 19
2      Approach ................................................................................................................................................... 21
       2.1      Research Questions ........................................................................................................................ 21
               2.1.1      Quantity .................................................................................................................................. 21
               2.1.2      Tenure ..................................................................................................................................... 21
               2.1.3      Type and Size ......................................................................................................................... 21
               2.1.4      The Housing Market Area ....................................................................................................... 21
       2.2      RQ1. What quantity of housing is appropriate for the Neighbourhood Plan Area? .......................... 25
               2.2.1      Horsham District Planning Framework (HDPF) 2015.............................................................. 25
               2.2.2      Strategic Housing Market Assessment (SHMA) 2009 ............................................................. 26
               2.2.3      DCLG Household Projections ................................................................................................. 26
               2.2.4      Home growth 2001-2011......................................................................................................... 27
               2.2.5      Home growth since 2011 ........................................................................................................ 27
               2.2.6. South Downs National Park .................................................................................................. 288
       2.3      RQ2. What type of affordable housing (social housing, affordable rented, shared ownership,
                intermediate rented) should be included in the housing mix? ........................................................ 299
               2.3.1      Definitional issues ................................................................................................................. 299
               2.3.2      Current tenure profile .............................................................................................................. 30
               2.3.3      Affordability ............................................................................................................................. 31
               2.3.4      Affordability Ratio .................................................................................................................. 322
               2.3.5      Income thresholds ................................................................................................................ 333
               2.3.6      Housing waiting list data ......................................................................................................... 34
               2.3.7      Housing provision: affordable homes (AH) ............................................................................. 35
               2.3.7.1 Discounted market housing (starter homes) ....................................................................... 35
               2.3.7.2 Shared ownership ............................................................................................................... 36
               2.3.7.3 Affordable rent .................................................................................................................. 377
               2.3.7.4 Affordable Housing type allocations .................................................................................. 377
       2.4      RQ3. What type of market housing (private rented and housing for sale) should be included
                in the housing mix?........................................................................................................................ 388
               2.4.1      Build to rent........................................................................................................................... 388
       2.5      RQ4. What type and size of dwellings are suited to ........................................................................ 39
               2.5.1      Current Tenure Profile ............................................................................................................. 39
               2.5.2      Age Structure .......................................................................................................................... 41
               2.5.3      Household composition........................................................................................................... 42
               2.5.4      Market Segments .................................................................................................................. 467
               2.5.5      Housing for Older People........................................................................................................ 48
               2.5.5.1 Sheltered and extra-care housing ....................................................................................... 48
               2.5.5.2 Retirement villages ............................................................................................................. 49
               2.5.5.3 Senior Co-housing .............................................................................................................. 49
               2.5.5.4 Multi-generational homes .................................................................................................... 49

                                                                                                                                                              AECOM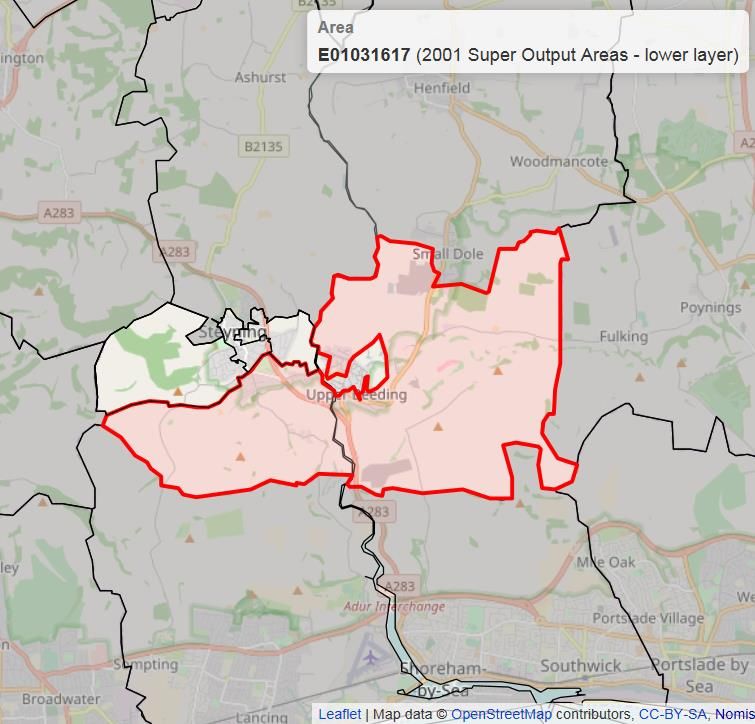
Housing Needs Assessment
Upper Beeding Parish
                                                            FINAL DRAFT REPORT
                  2.5.5.5 Lifetime Homes ................................................................................................................... 49
                  2.5.5.6 Right-sizing ......................................................................................................................... 49
                  2.5.5.7 Planning flexibility ............................................................................................................... 50
                  2.5.5.8 Lifetime neighbourhoods ..................................................................................................... 50
                  2.5.5.9 Age-friendliness .................................................................................................................. 50
                  2.5.5.10 Housing for people with Dementia .................................................................................... 51
                  2.5.5.11 The role of the Local Authority........................................................................................... 51
3         Market Signals ........................................................................................................................................... 52
          3.1        Employment and commuting trends ............................................................................................... 52
          3.2        Housing Transactions: Prices ......................................................................................................... 56
          3.3        Housing Transactions: Volume ....................................................................................................... 58
          3.4        Migration ......................................................................................................................................... 59
          3.5        Overcrowding ................................................................................................................................. 60
          3.6        Concealed Families ........................................................................................................................ 61
          3.7        Rate of development....................................................................................................................... 61
4         Conclusions ............................................................................................................................................. 633
          4.1        Overview....................................................................................................................................... 633
          4.2        Recommendations for next steps ................................................................................................. 666

Figures
Figure 1: Dwelling projections for the Upper Beeding NPA, 2017-2031 ............................................................. 0-10
Figure 2: Upper Beeding Neighbourhood Plan Area ............................................................................................. 16
Figure 3: Correct 2001 Census Super Lower Layer Super Output Area for Upper Beeding centre (E01031616) . 17
Figure 4: Incorrect 2001 Census Super Lower Layer Super Output Area for Upper Beeding outskirts (E01031617)17
Figure 5: Matching 2001 Census Output Areas for Upper Beeding outskirts (E01031617) ................................... 18
Figure 6: Additional 2001 Census Output Areas for Upper Beeding outskirts ....................................................... 18
Figure 7: Defining Housing Market Areas and Areas of Market Overlap ............................................................... 22
Figure 8: Migration Flows between Wards, 2000-1 ............................................................................................... 23
Figure 9: Brighton and Hove TTW Catchment Area .............................................................................................. 24
Figure 10: Lower Quartile Affordability Trend (1997-2013).................................................................................... 32
Figure 11: Proportion of Households unable to buy or rent, Crawley, Horsham and Mid Sussex .......................... 34
Figure 12: Potential Scale of the Intermediate Housing Market ............................................................................ 37
Figure 13: Annual Private Rental Lettings for Northern West Sussex Authorities, Q2, 2010 – Q1, 2014 ............. 38
Figure 14: Age Structure in Upper Beeding, Horsham and England, 2011 ........................................................... 41
Figure 15: Changing Household Structure, West Sussex County 2006-2026 ....................................................... 44
Figure 16: Household Earnings by Income Band, 2014 ........................................................................................ 45
Figure 17: Dementia care chart ............................................................................................................................. 51
Figure 18: Map of current and future growth capacity and spatial priorities in the Coast to Capital Local Enterprise
Partnership Area ................................................................................................................................................... 53
Figure 19: Commuter Practices for those who live and work within Horsham ...................................................... 54
Figure 20: Number of VAT Registered Businesses in Horsham Per Year ............................................................. 55
Figure 21: Overall House Prices 2007 .................................................................................................................. 56
Figure 22: Price inflation, overall house prices, 2002-2007.................................................................................. 57
Figure 23: Median house price (1998-2007) ......................................................................................................... 58
Figure 24: Sales volumes of different housing types in Upper Beeding, 2007-2016 ............................................. 58
Figure 25: Indexed Analysis of Sales Trends (1998-2014) .................................................................................... 59
Figure 26: Components of Population Change, mid-2001 to mid-2013 – Horsham .............................................. 60
Figure 27: Housing Supply vs. Past Targets, 2006/07-2013/14............................................................................. 62

Tables
Table 1: Summary of factors specific to Upper Beeding with a potential impact on neighbourhood plan area
housing .............................................................................................................................................................. 0-11

                                                                                                                                                                 AECOM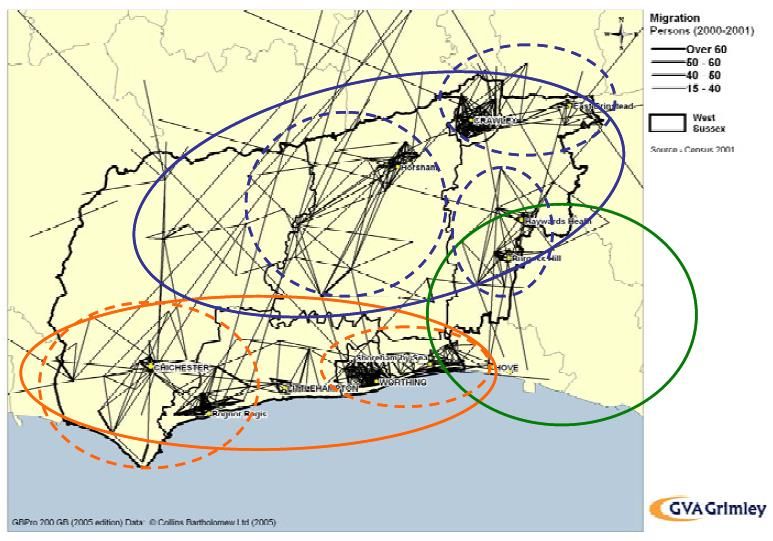
Housing Needs Assessment
Upper Beeding Parish
                                                             FINAL DRAFT REPORT
Table 2: Summary of local factors specific to Upper Beeding with a potential impact on neighbourhood plan
housing characteristics....................................................................................................................................... 0-13
Table 3: Tenure (households) in Upper Beeding, 2011 .......................................................................................... 30
Table 4: Rates of tenure change in Upper Beeding, 2001-2011 ............................................................................ 30
Table 5: Breakdown of households in need ........................................................................................................... 31
Table 6: Concealed families in Upper Beeding and Horsham, 2011 ...................................................................... 31
Table 7: Lowest current property prices (2014) ..................................................................................................... 32
Table 8: Comparison of lower quartile and median affordability ............................................................................ 33
Table 9: Entry-level Housing Costs and Income Thresholds, 2014 ....................................................................... 33
Table 10: Average Household Incomes, Northern West Sussex HMA .................................................................. 33
Table 11: Allocation of AH tenure types ................................................................................................................. 37
Table 12: Accommodation type (households) in Upper Beeding, 2011 ................................................................. 40
Table 13: Number of rooms per household in Upper Beeding ............................................................................... 40
Table 14: Rates of change in number of rooms per household in Upper Beeding, 2001-2011 .............................. 41
Table 15: Rate of change in the age structure of the population of Upper Beeding, 2001-2011 ............................ 42
Table 16: Household composition (by household) in Upper Beeding, 2011 .......................................................... 43
Table 17: Rates of change in household composition in Upper Beeding, 2001-2011 ............................................ 43
Table 18: Changes in number of persons per room, Upper Beeding and Horsham, 2001-2011 ........................... 44
Table 19: Concealed families in Upper Beeding, Horsham and England, 2011..................................................... 44
Table 20: Economic activity in Upper Beeding, 2011 ............................................................................................. 45
Table 21: Change in the population of over 75s between 2011 and 2031 ............................................................ 48
Table 22: Distance to work, 2011 .......................................................................................................................... 53
Table 23: Economic activity in Upper Beeding, 2011 ............................................................................................. 54
Table 24: Upper Beeding Prices Paid by House Type, 2007-2016 ........................................................................ 57
Table 25: Sales of housing in Upper Beeding versus existing housing stock in the Parish and in Horsham District,
by type .................................................................................................................................................................. 59
Table 26: Country of birth and length of residence, 2011 ...................................................................................... 60
Table 27: Length of residence of those born outside of the United Kingdom ........................................................ 60
Table 28: Trends in number of persons per room in Upper Beeding, 2001-2011 .................................................. 61
Table 29: Concealed families in Upper Beeding, 2011 .......................................................................................... 61
Table 30: Summary of units permitted, built and demolished in Upper Beeding, by type, 2010-2016 ................... 61
Table 31: Summary of factors specific to Upper Beeding with a potential impact on neighbourhood plan area
housing ................................................................................................................................................................. 63

                                                                                                                                                                   AECOM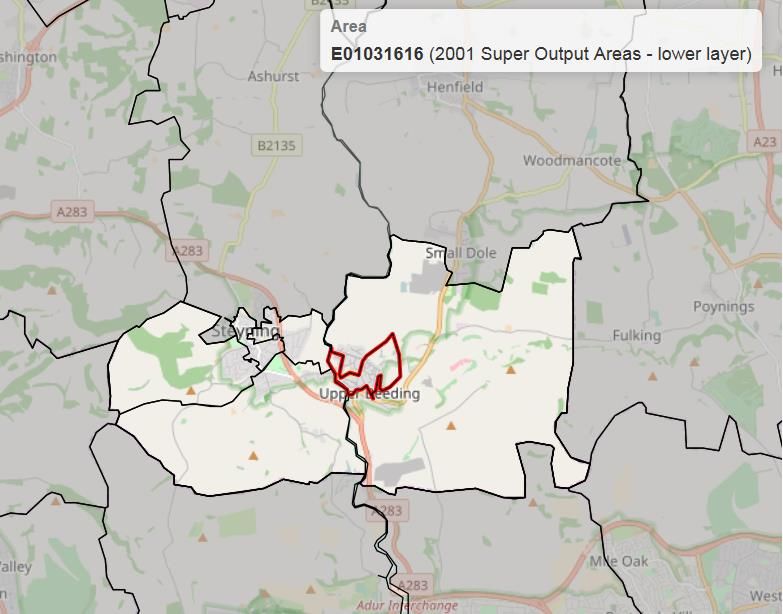
AECOM                                                                        0-7

Glossary of terms used in the text:

AH                    Affordable Housing (NPPF definition)
AHNMU14               Northern West Sussex Housing Market Area – Affordable Housing
                      Needs Model Update 2014
AMH                   Affordable Market Housing
UBPC                  Upper Beeding Parish Council
CtCLEP                Coast to Capital Local Enterprise Partnership
CtCSEP14              Coast to Capital Strategic Economic Plan 2014
DCLG                  Department for Communities and Local Government
HDC                   Horsham District Council
HDEP16                Horsham District Economic Plan 2016
HDPF15                Horsham District Planning Framework 2015
HEP16                 Horsham Economic Profile, December 2016
HMA                   Housing Market Area
HNA                   Housing Needs Assessment
HNSR                  Housing Needs Survey Report, November 2014
HNHD15                Housing Need in Horsham District, March 2015
LPA                   Local Planning Authority
NDP                   Neighbourhood Development Plan
NPPF                  National Planning Policy Framework
MH                    Market Housing
OAN                   Objectively Assessed Need
ONS                   Office for National Statistics
PPG                   Planning Practice Guidance
PRS                   Private Rented Sector
SHLAA                 Strategic Housing Land Availability Assessment
SHMA09                Northern West Sussex Strategic Housing Market Assessment, May
                      2009
SHMAU12               Northern West Sussex – Horsham Strategic Housing Market
                      Assessment Update, October 2012
UKHPI                 UK House Price Index

                                                                            AECOM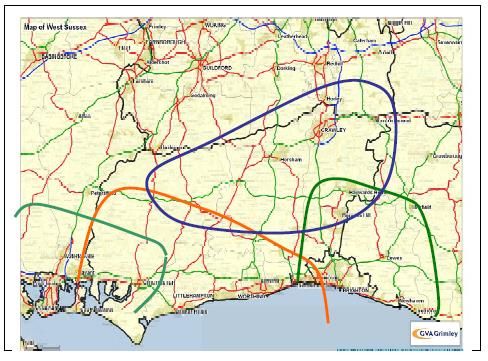
AECOM                                                                                                             0-8

0.           Executive Summary
0.1          Introduction
       1.   The 2011 Localism Act introduced neighbourhood planning, allowing town and parish councils or neighbourhood
            forums across England to develop and adopt legally binding development plans for their neighbourhood area.

       2.   As more and more town and parish councils and forums seek to address housing growth, including tenure and
            type of new housing, it has become evident that developing policies need to be underpinned by robust,
            objectively assessed housing data.

       3.   In the words of the National Planning Practice Guidance (PPG), establishing future need for housing is not an
            exact science, and no single approach will provide a definitive answer. The process involves making balanced
            judgments, as well as gathering numbers and facts. At a neighbourhood planning level, one important
            consideration is determining the extent to which the neighbourhood conforms with trends in the wider Housing
            Market Area (HMA) but also diverges from them, to reveal its own particular characteristics. This approach
            reflects the fact that a single town or neighbourhood almost never constitutes a housing market on its own and
            must therefore be assessed in its wider context.

       4.   The guidance quoted above on housing needs assessment is primarily aimed at local planning authorities
            preparing Strategic Housing Market Assessments (SHMAs), which are used to determine housing need at a local
            authority level. However, it helpfully states that those preparing neighbourhood development plans (NDPs) can
            use the guidance to identify specific local needs that may be relevant to a neighbourhood, but that any
            assessment at such a local level should be proportionate.

       5.   Our brief was to advise on data at this more local level to help Upper Beeding Parish Council (UBTC)
            understand, among other matters, the type, tenure and quantity of housing needed to inform neighbourhood plan
            policies.

0.2          Summary of Methodology
       6.   Housing Needs Assessment at neighbourhood plan level focuses on either quantity of housing needed, type of
            housing need, or both. In most cases, there is a need to focus on quantity where the housing target for the
            settlement being assessed is unclear, for example, where the local authority has not set a specific target for the
            settlement, or where there is no local plan in place.

       7.   In the case of UBPC, the current adopted Development Plan, the Horsham District Planning Framework 2015
            (HDPF) sets out the planning strategy for the Horsham District outside of the South Downs National Park for the
            years up to 2031, and aims to deliver the social, economic and environmental needs of the district.

       8.   In Policy 15, the HDPF sets a housing figure for the district to be delivered over the Plan Period (2011-31) of ‘at
            least 16,000’ homes. This will in part be achieved by ‘the provision of at least 1,500 homes throughout the district
            in accordance with the settlement hierarchy, allocated through Neighbourhood Planning.’ 1

       9.   One purpose of this study is to identify a housing number for Upper Beeding that takes into consideration these
            numbers.

       10. The targets set out in Policy 15 should be understood as the minimum number to be delivered over the plan
           period; for this reason, a number of projections are tabled that place the number derived from Local Plan policy
           into a context.

       11. In order to carry out this assessment we reference a number of studies commissioned by Horsham District
           Council. These are the Northern West Sussex Strategic Housing Market Assessment, May 2009 (SHMA09); the
           Northern West Sussex – Horsham Strategic Housing Market Assessment Update, October 2012 (SHMAU12) and
           the Northern West Sussex Housing Market Area – Affordable Housing Needs Model Update (AHNMU14).
           Together these documents represent the evidence base supporting the LPA’s housing policies, and are referred
           to collectively as the ‘SHMA studies.’

1
    HDPF, page 56

                                                                                                                AECOM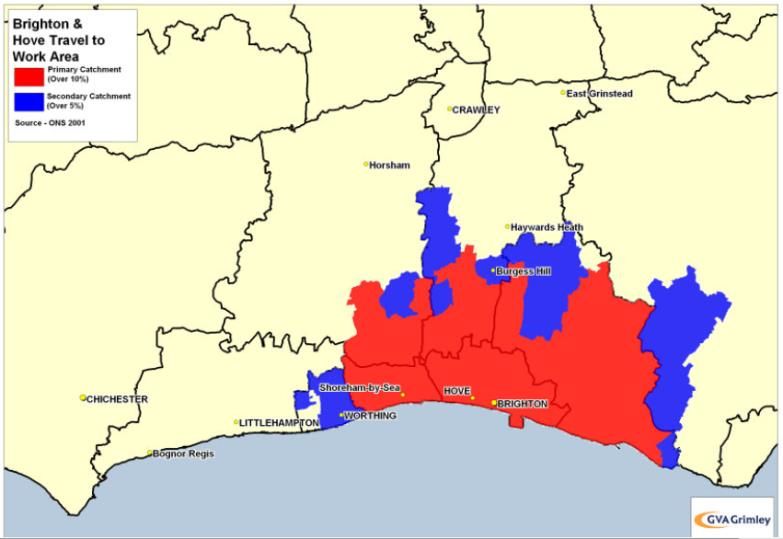
AECOM                                                                                                                   0-9

      12. The rationale for this recommended approach is that neighbourhood plans need to pass a number of Basic
          Conditions to pass examination. One of these, Basic Condition E, requires the Neighbourhood Plan to be in
          ‘general conformity with the strategic policies’ of the Local Plan, in this case the HDPF. The Government’s
          Planning Practice Guidance indicates that the level of housing development is likely to count as a strategic
          policy.2

      13. In terms of the types of housing needed, there is generally more flexibility on what neighbourhood plans can
          cover. In order to understand the types of housing needed in UBPC we have gathered a wide range of local
          evidence and summarised it into policy recommendations designed to inform decisions on housing
          characteristics.

      14. Data and materials gathered relevant to this HNA have been sourced and analysed in line with PPG;3 together,
          they provide a balance of sources that capture a local perspective.

      15. The housing projections set out in this HNA correspond with the Neighbourhood Plan period of 2017-2031; this in
          turn corresponds with the plan period for the HDPF.

0.3         Focus On Demand Rather Than Supply
      16. The assessment provides advice on the housing required based on need and/or demand rather than supply, as
          recommended in PPG4. For this reason, we advise that the conclusions of this report should next be assessed
          against supply-side considerations (including, for example, factors such as transport infrastructure, landscape
          constraints, flood risk and so on) as a separate and follow-on study .

0.4         Quantity of Housing Needed
      17. We have estimated the quantity of housing needed in NPA derived from four different sources; these are,

             1. Horsham District Planning Framework ‘settlement hierarchy’ minimum derived figure (HDPF) 2011-31,
                which generates a projection of 69 dwellings over the plan period or 5 dwellings per annum
                (rounded);

             2. Horsham District Planning Framework ‘district’ minimum derived figure (HDPF) 2011-31, which generates
                a projection of 446 dwellings over the plan period or 32 homes per year (rounded);

             3. Housing Need in Horsham 2015 (SHMA) –a proportional share drawn from OAN produces a final target of
                351 dwellings over the plan period, or 25 per year (rounded);

             4. DCLG Household projections generate a re-based projection of 366, or 26 dwellings (rounded) over the
                plan period; and

             5. A projection derived from homes growth between 2001 and 2016 (based on Census and Horsham District
                Council figures) of 64 homes over the plan period.

2
 See Planning Practice Guidance Paragraph: 006 Reference ID: 2a-006-20140306
3
 See Planning Practice Guidance Paragraphs: 014 Reference ID: 2a-014-20140306 and 009 Reference ID: 2a-009-
20140306
4‘the assessment of development needs should be an objective assessment of need based on facts and unbiased evidence. Plan
makers should not apply constraints to the overall assessment of need, such as limitations imposed by the supply of land for new
development, historic under performance, viability, infrastructure or environmental constraints.’ PPG (date)

                                                                                                                      AECOM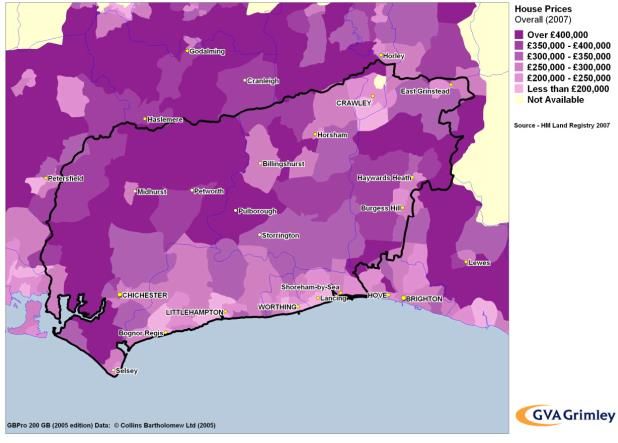
AECOM                                                                                                       0-10

Figure 1: Dwelling projections for the Upper Beeding NPA, 2017-2031
 2500

 2400

 2300

 2200

 2100
                                                                                               HDPF(SH)
 2000

 1900                                                                                          SHMA(derived)

 1800
                                                                                               DCLG Household
 1700                                                                                          Projections-derived
 1600

 1500
        2001             2011               2021               2031
Source: AECOM Calculations

   18. The graph above (the vertical axis indicates the number of homes) sets out the total number of homes factoring
       in each of the projections we have identified in Upper Beeding. So, for example, factoring in DCLG derived data
       (orange line) to the number of dwellings that have already been built in the NPA between 2011 and 1st January
       2016 (18) produces a total requirement that there should exist 2,034 homes by the end of the Plan Period
       (combining existing completed dwellings, and new homes that are required to be built).

   19. The starting point to arrive at an overall projection for housing numbers to be delivered in the NPA over the Plan
       Period is the average of the five projections set out above; we depart from this approach if we have reason to
       believe a given projection should be awarded more weight than others, or should be excluded.

   20. We have received explicit guidance from HDC that the projection 2, derived from the overall housing target for
       the district should be discounted, and only the ‘settlement hierarchy’ number taken into consideration. For this
       reason, we have excluded projection 2 from our calculation. The average of the remaining projections comes
       to 213 dwellings, or 15 dwellings per year over the Plan Period (rounded).

   21. Moreover, a further assessment applied to this initial projection indicates that market signals (for example the
       economic context in which the NPA sits, together with the performance of the housing market) are likely to impact
       on it. We have applied our professional judgment on the scales of increase and decrease associated with each
       factor on a scale from one to three, where one arrow indicates ‘some impact’, two arrows ‘stronger impact’ and
       three arrows indicates an even stronger impact. Factors are in alphabetical but no other order.

                                                                                                           AECOM
AECOM 0-11
Table 1: Summary of factors specific to Upper Beeding with a potential impact on neighbourhood plan
area housing
Possible impact on
Source(s) (detailed
Factor future housing Rationale for judgement
in Chapter 5)
need
Upper Beeding has been shown to be connected to the
wider economic area, and therefore demand for housing
will be stimulated by economic growth in the Brighton
and Hove and Wider Coast to Capital Economic Area.
HNHD15,
Furthermore Upper Beeding has been shown to have a
CtCSEP2014,
Employment significant degree of home workers, a sector which has
HDEP16, HEP2016,
trends high potential for future growth as noted in the Horsham
SHMA09, Census
District Economic Profile 2016.
2001/11
As a result, an assessment of two up arrows has been
deemed appropriate because of the current strength and
predicted future growth of employment opportunities in
the local area.
The Upper Beeding NPA has been shown to have
experienced a 34% increase in prices paid over a ten
year period, with larger increases for smaller, more
SHMA09, Land affordable properties such as terraces.
Housing
Registry Price Paid
transactions
Data for 2006-2016, As a result an assessment of one up arrow has been
(Prices)
HNHD15 deemed appropriate due to the relatively low increases in
house prices experienced in the NPA when assessed
against the District, thus placing it more in line with HMA
comparator areas.
1. The volume of sales in Upper Beeding has been shown
to be more resilient to the effects of the double dip
national recession than the rest of the housing market
area, demonstrating the ongoing demand for housing in
Land Registry Price the NPA.
Housing Paid Data for 2006-
2. Furthermore, the proportion of all properties sold in
Transactions 2016, Census
Upper Beeding that fall into each type matches how
(Volume) 2001/2011 data,
these types are represented in the existing stock, except
SHMA09
for flats and terraces, where a higher number has been
sold. This suggests these types are in particularly high
demand. For this reason, two upward arrows are
deemed appropriate.
Migration is not seen as significant factor in determining
HNHD15, SHMA 2009,
housing need given that just 29% of the 6% of Upper
Migration Census data 2001,
Beeding residents born outside of the UK arrived in the
2011
last 10 years.
Overcrowding
Census data 2001,
2011
While there is some evidence of over-crowding in Upper
Beeding, this is not seen as sufficient to justify a policy
response.
AECOMAECOM 0-12
Upper Beeding’s rate of concealed families (1.4%) is
Census data 2001, higher than that of Horsham District as a whole (1.3%)
Concealment
2011 indicating some level of demand; therefore one up arrow
is considered appropriate.
The local authorities in the wider North West Sussex
Housing Market Area have significantly under-delivered
against HMA targets over the past eight years.
Rate of
development
HDC, HNHD15 Land
Registry Data/AECOM
Calculations Furthermore the rate of development in Upper Beeding
increased in 2015/16. This suggests a period of under-
delivery prior to this year had created a latent demand;
the development exhibited in 2015/16 is evidence of the
market responding to this demand as the national
economy recovers. In order to sustain this process, an
assessment of one up arrows is deemed appropriate.
22. Market signals research has shown that Upper Beeding is located in an area with a high potential for jobs growth,
as a result of its closeness to Brighton, and the 'Coast to Capital' economic region, as well as its high level of
home working, small businesses and business survival rates.
23. Moreover, there is strong evidence of disequilibrium between demand and supply within the housing market
exhibited through increasing house prices and the speed with which dwellings change hands, particularly among
smaller dwellings. This suggests supply struggles to keep up with demand. This position is potentially
exacerbated by the weak record of supply at the district level, notwithstanding the construction of 18 dwellings
over the last 5 years.
24. While we are mindful of these factors, we are also conscious that the ‘settlement hierarchy’ approach to the
calculation of a housing target for the town suggests Upper Beeding has already satisfied its housing target. For
this reason we do not propose any uplift to the housing projection arrived at in Paragraph 20.
AECOMAECOM 0-13
Table 2: Summary of local factors specific to Upper Beeding with a potential impact on neighbourhood
plan housing characteristics
Factor Source(s) (see Possible impact on Conclusion
Chapter 4) housing needed
Affordable Census, HNSR, The current tenure profile of the Those households ineligible for affordable housing, but
Housing (AH) SHMA studies area (dominated by owner who cannot afford market housing, may struggle to
occupation) leaves little suitable access housing suitable for their needs, meaning they
accommodation for those on may need to move out of the area.
low incomes
While an equilibrium between AH need and supply can
Roughly 8% of households in be said to exist, it is important to note this is an artificial
2014 were eligible for construct given that demand and supply are attenuated
affordable housing; this is also by eligibility criteria and practical constraints on
the proportion of the housing delivery. Moreover, the presence of a small but
stock defined as AH. persistent group of 'concealed households' suggests
small backlog that policy should seek to clear, as well
The small growth in shared as ensuring future needs are met
ownership dwellings
The growth of shared ownership could be a plausible
At the level of the HMA, a crisis route to home ownership for those on low incomes, for
of affordability is identified, with
example first time buyers, leading to the
households on lower and
recommendation that a substantial share of AH quotas
median incomes unable to
access affordable market that come from housing development should be
housing (AMH) allocated to this tenure type.
Households on mean and Household income levels generate a compelling
median incomes within argument for discounted market sales housing and
Horsham District are unable to affordable private rent housing. These tenure types are
afford entry-level properties particularly suitable for first time buyers.
Demand/ need for Census, Land The current housing stock The growth of three room households points to an
smaller dwellings Registry Price Paid exhibits a strong bias towards increase in the numbers of older people, who have
Data larger dwellings, and relatively reached an age where they are looking for a smaller
few flats home.
Changes in the profile of the The lack of smaller dwellings is likely to lead to the
housing stock saw an increase displacement of households on lower incomes from the
in larger family dwellings and area, as discussed above.
households occupying homes
consisting of three rooms. Findings from the housing transactions suggests
demand is high for smaller, more affordable homes,
Data from housing transactions leading to the recommendation that these type of
reveals house prices for smaller dwellings should form a larger proportion of new homes
dwelling types, such as being delivered than has previously been the case.
terraced dwellings and flats has
increased more strongly than
for detached and semi-
detached properties.
Demographic Census, SHMA A substantial increase in the The increase in the proportion of the population
Change studies numbers of older people is accounted for by older people creates an imperative for
recorded, and this is forecast to housing policy to address their needs, for example
continue dwellings of a manageable size designed to be ‘age-
friendly.’
In arriving at an appropriate level of housing for older
people of different types, we have applied the Housing
Learning and Improvement Network’s suggested
numbers per 1,000 of the 75+ population.
AECOMAECOM 0-14
This provides an estimate of the increase in the
numbers of older people aged 75+ of 59. This will
result, over the plan period, in a need for additional
- conventional sheltered housing units = 60 x
6% = 4;
- leasehold sheltered housing units = 120 x
6% = 8
- ‘enhanced’ sheltered units, split 50:50
between those for rent and those for sale =
20 x 6% = 1 (rounded)
- additional extra care housing units for rent
=15 x 6% = 1
- additional extra care housing units for sale =
30 x 6% = 2
- specialist dementia care homes = 6 x 6% =
15
Family-sized Other changes in age structure Larger dwellings should form an important part of the
housing reinforce the impression of a mix of types and sizes of homes provided over the plan
family orientated community, as period.
well as a place of retirement.
5
This finding suggests it would not be economic to provide a single specialist unit of this type within Upper Beeding, and may be better
located nearby in locations that are more accessible to key services (e.g. Lancing, Worthing, Shoreham)
AECOMAECOM 0-15
0.5 Recommendations for next steps
25. This neighbourhood plan housing needs advice has aimed to provide UBPC with evidence on housing trends
from a range of sources. We recommend that the parish should, as a next step, discuss the contents and
conclusions with HDC with a view to agreeing and formulating draft housing policies, in particular the
appropriate approach to identifying the level of need for new housing in the NP area, bearing the following in
mind:
• The Basic Conditions that neighbourhood plans need to fulfil in order to pass examination, in particular
having regard for national policies and advice contained in guidance issued by the Secretary of State;
that its policies contributes to the achievement of sustainable development and are in general conformity
with the adopted strategic local policies6;
• the views of HDC – in particular in relation to the housing need figure that should be adopted;
• the views of local residents as captured in the Consultation Statement and household surveys;
• the views of other relevant local stakeholders, including housing developers;
• the numerous supply-side considerations, including local environmental constraints, the location and
characteristics of suitable land, and any capacity work carried out by the HDC, including but not limited
to the SHLAA; and
• the recommendations and findings of this study.
25. Recent changes to the planning system, forthcoming changes to the NPPF, as well as the implementation of the
Housing and Planning Act, will continue to affect housing policies at a local authority and, by extension, a
neighbourhood level.
26. This advice note has been provided in good faith by AECOM consultants on the basis of housing data and
national guidance current at the time of writing (alongside other relevant and available information).
27. Bearing this in mind, we recommend that the steering group should monitor carefully strategies and documents
with an impact on housing policy produced by HDC or any other relevant body and review the neighbourhood
plan accordingly to ensure that general conformity is maintained.
28. At the same time, monitoring ongoing demographic or other trends in the factors summarised in Tables 1 and 2
would be particularly valuable.
6
The five basic conditions and how they should be addressed can be seen in the document ‘How to Write a Basic Conditions Statement,
https://mycommunity.org.uk/wp-content/uploads/2016/08/How-to-write-a-basic-conditions-statement.pdf (visited 19/09/17
AECOMHNA Template
DRAFT
1. Context
1.1 Local context
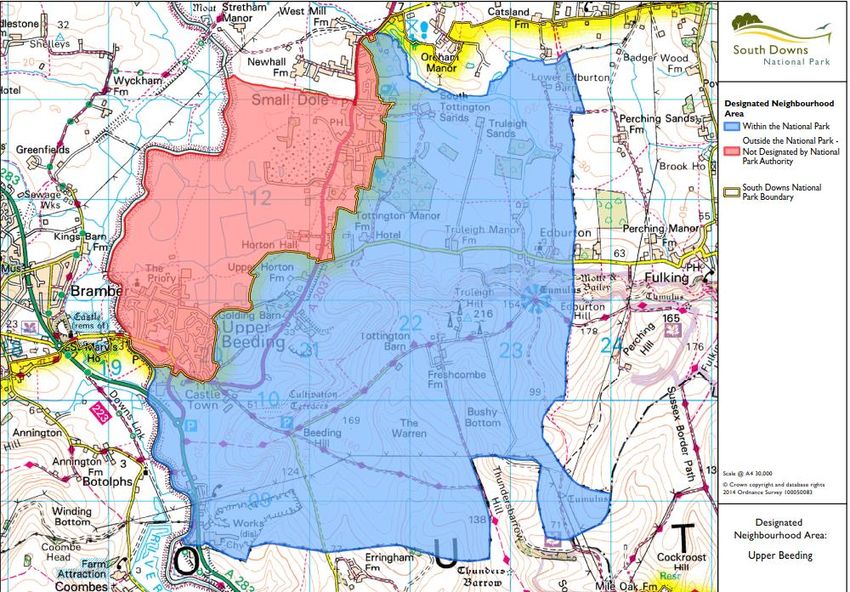
29. The parish of Upper Beeding consists of the villages of Upper Beeding, Small Dole and Edburton in the
Horsham district of West Sussex, approximately 5 miles from the coast itself. Upper Beeding sits on the
River Adur. The parish sits on the northern edge of the South Downs National Park, and approximately
two thirds of the neighbourhood plan area, which encompasses the entire parish, falls within the Park’s
boundary.
30. The village sits in close proximity to the A283 which leads from Milford to Shoreham by Sea, and has
benefited from a bypass around the nearby villages of Bramber and Steyning, built roughly 25 years ago.
Figure 2: Upper Beeding Neighbourhood Plan Area
Source: Upper Beeding Parish Council
1.2 Census Geography
31. For the purposes of this study, census data was downloaded for both 2001 and 2011 Censuses to contribute
to an assessment of the housing needs in the area. Whilst the 2011 Census data can be filtered down to the
Parish level, thereby ensuring exact accuracy, 2001 Census data is grouped according to a series of other
geographical areas or units, not parishes, which are: Output Areas (OAs), Lower Layer Super Output Areas
(LSOAs), and Medium Layer Super Output Areas (MSOAs). As such, to find the appropriate 2001 Census for
the entire parish, a combination of these needs to be used. As shown in figure 3 below, one LSOA,
E01031616, corresponds to the centre of Upper Beeding. However, the adjacent LSOA, E01031617, covers
areas that fall outside the Parish boundary. Therefore, a series of smaller geographies must be used to
capture data for this area correctly.
AECOM
16HNA Template
DRAFT
Figure 3: Correct 2001 Census Super Lower Layer Super Output Area for Upper Beeding centre
(E01031616)
Source: http://www.nomisweb.co.uk/
Figure 4: Incorrect 2001 Census Super Lower Layer Super Output Area for Upper Beeding
outskirts (E01031617)
Source: http://www.nomisweb.co.uk/
32. To capture the correct data, the LSOA E01031617 is broken down into its individual component Output Areas
(OAs), to select those that fall within the parish boundary. These comprise five OAs as listed in Figure 5
below.
AECOM
17HNA Template
DRAFT
Figure 5: Matching 2001 Census Output Areas for Upper Beeding outskirts (E01031617)
Source: http://www.nomisweb.co.uk/
33. However, these output areas do not cover the entire Neighbourhood Plan Area. As Figure 2 showing the NPA,
on page 15, makes clear, part of the village of Small Dole to the North of the NPA is included within its
boundary. Therefore, further geographies must be included for a proper comparison of 2001 Census Data,
and 2011 Census Data for the entire geographical area of the Parish. To accommodate these, the following
OAs pertaining to Small Dole were included when collecting the data, as shown in Figure X below:
45UFGD0015 and 45UFGD0016. As such, the final list of geographies for 2001 census data includes 1
LSOA, E01031616, and 7 OAs, combined.
Figure 6: Additional 2001 Census Output Areas for Upper Beeding outskirts
Source: http://www.nomisweb.co.uk/
AECOM
18HNA Template
DRAFT
1.3 Local Planning context
34. In line with the Basic Conditions of neighbourhood planning, Neighbourhood Development Plans (NDPs) are
required to be in general conformity with the adopted strategic local policies. Consequently, there is a
requirement for the relevant Local Plan to be reviewed as part of this HNA.
35. The Horsham District Planning Framework (excluding South Downs National Park) , adopted in 2015, is the
most up to date local plan for the area, and the emerging Horsham District Local Plan is at a sufficiently early
stage of preparation, with no drafts published (Source: Horsham Local Development Scheme 2017) as to be
disregarded for this exercise. It is projected to be published in 2020 (ibid.). The 2015 Framework replaced the
Core Strategy and General Development Control Policies adopted in 2007.
1.3.1 Horsham District Planning Framework 2015
36. The Horsham District Planning Framework 2015 sets out the planning strategy for the Horsham District
outside of the South Downs National Park for the years up to 2031, and aims to deliver the social, economic
and environmental needs of the plan area.
37. Policy 2 ‘Strategic Development’, which sets out that the focus of development in the district will conform to
the settlement hierarchy, in which Upper Beeding, together with Bramber, is identified as a small town/larger
village, and be focused on Horsham. It supports development which protects the rural character and existing
landscape, whilst providing for the varied housing needs of the community.
38. Policy 3 ‘Built Up Area Boundary’, which sets out the mechanism of built-up area boundaries to support the
planned expansion of existing settlements through the Local Plan and Neighbourhood Planning processes.
Within this boundary, development is accepted in principal, whereas outside of it, development will be more
strictly controlled. Emphasis is placed on the use of a Settlement Sustainability Review to ensure that
development is of a scale that both retains the character and role of the settlement in terms of the range of
services and facilities there as well as community cohesion.
39. Policy 9 ‘Key Employment Areas’, which seeks to protect employment uses whilst enabling development by
using a sequential approach to assessing applications within designated Key Employment Areas. It clarifies
that proposals in such areas must not result in the overall loss of employment floorspace. Proposals outside
of Key Employment Areas must demonstrate the premises are no longer needed and/or viable for
employment use should floorspace of this kind be reduced.
40. Policy 15 ‘Housing Provision’ which establishes the need for 800 homes per year to be built, or 16,000
homes over the next 20 years, to meet the demand created by growth in the economy of the Gatwick
Diamond economic area, and inward migration to Horsham as a result of its attractive quality of life and
growing local economy. This target will be supported by: completions between 2011 and 2015, when the plan
was adopted, homes already permitted or agreed for release, three strategic sites, the allocation of “1500
homes…through Neighbourhood Planning”, and 750 windfall units.
41. Policy 16 ‘Meeting Local Housing Needs,’ which seeks to achieve a mix of housing sizes, types and
tenures to meet established local housing needs, subject to the existing character of neighbourhoods and
individual scheme viability. It does so by requiring all residential developments of between 5 and 14 dwellings
to provide 20% affordable, or a financial contribution where this is deemed achievable; and by requiring all
developments of more than 15 dwellings or on sites over 0.5 hectares, to provide 35% affordable dwellings.
These provisions will also apply to sub-divided sites in a way which ensures the same amount of affordable
housing is achieved as if they were not sub-divided. All of these policies will be subject to viability, as well as
assurances that local housing needs as set out in the latest SHMA are met. The framework also notes that
“the council will support schemes being brought forward through Neighbourhood Plans”.
42. Policy 17 ‘Exceptions Housing Schemes’, which enables rural, greenfield sites near to settlement
boundaries to come forward for development to meet local housing needs. This is considered acceptable
where no suitable alternatives exist within the locality to meet the need, that the need is in a single parish or
its immediately adjoining parishes within Horsham District, and that the needs relate to existing residents in
unsuitable accommodating or needing separate accommodation in area (excluding existing owner occupiers),
people whose work provides important services and who need to live in the parish, people who may no longer
be resident in the parish but have longstanding links with the local community, and people with the offer of a
job in the parish who cannot take up the offer because of a lack of affordable housing. A further condition is
that the development must “provide subsidised housing in perpetuity which will normally be managed by a
provider that is registered with the Homes and Community Agency.”
43. Policy 18 ‘Retirement Housing and Specialist Care’, which states that “proposals for development which
provide retirement housing and specialist care housing will be encourage and supported” where they are
accessible from existing settlements and where they cater to those on lower incomes. Large-scale retirement
AECOM
19HNA Template
DRAFT
communities will also be supported in appropriate locations, provided they accommodate a range of needs,
include some affordable provision or an appropriate financial contribution, and contribute “appropriate services
and facilities”.
44. Policy 19 ‘Park Homes and Residential Caravan Sites’, which states that provision of park homes and
caravans will be supported so long as they meet local housing needs and are marketed locally for a
reasonable period of time, that they are used for permanent accommodation, and that flooding, drainage and
ground engineering are not significant barriers to their development. Proposals to convert these to permanent
housing or holiday accommodation will not be supported in the face of housing need, whilst conversion of
existing holiday accommodation will have to meet the same criteria as new building of this type, and must not
harm nearby occupiers and users amenity or damage the environment.
45. Policy 20 ‘Rural Workers Accommodation’, which states that housing for rural workers to support the rural
economy will be supported outside of the defined built-up area, provided that it is functionally required and its
occupation supports the established business use, and that evidence is submitted to demonstrate the viability
of the rural business for which the housing is required.
46. Strategic Policy 21 ‘Gypsy and Traveller Sites Allocations’, which states “Provision shall be made for 39
net additional permanent residential pitches for Gypsies and Travellers within the period 2011 – 2017”, and
that the council will make provision for Gypsy, Traveller and Travelling Showpeople (GTTS) over the rest of
the plan period. It allocates 4 sites for this purpose, delivering a total of 29 pitches, and notes sites with
existing planning permission for a further 13 pitches.
47. Policy 22 ‘Gypsy and Traveller Sites’, which states that existing sites for GTTS will be safeguarded from
development preventing their use for that purpose, unless they are no long required to meet identified need. It
notes that the provision of sites to meet that need beyond 2017 will be identified in a Site Allocations
Development Plan Document, and that further sites may be provided: on windfall sites, by extending existing
sites, by redeveloping existing sites, by allocating further sites within strategic developments sites or as
standalone allocations, on publically owned land, both publically managed and for purchase by GTTS. The
council also states that it will “work with neighbouring authorities to make appropriate provision to meet the
requirements for Gypsies and Travellers.”
48. Strategic Policy 23 ‘Gypsy and Traveller Accommodation’, which sets out the criteria for determining the
allocation of land for GTTS and assessing planning applications for this purpose, namely: barriers to
development such as flooding or ground engineering issues; safe and convenient vehicle and pedestrian
access; proper utility servicing and size of site to accommodate amenities; location in or near existing
settlements, or part of an allocated strategic location within reasonable distance of local services; and that the
development does not have an unacceptable impact on the character and amenities of neighbours and is
sensitively designed. Furthermore, it takes the view that “in assessing sites for Travelling Showpeople, or
where mixed uses are proposed, the site and its surrounding context must be suitable for mixed residential
and business uses, including storage required and/or land required for exercising animals”, and does not have
adverse impacts on neighbours in the same way as above.
AECOM
20HNA Template
DRAFT
2 Approach
2.1 Research Questions
48. This section of the study poses a series of Research Questions, abbreviated to ‘RQ;’ these have been
arrived at through discussion with the parish at the start of the project. They serve to direct our research
and provide the structure for the HNA.
2.1.1 Quantity
49. Horsham District Planning Framework (HDPF) sets a figure for dwellings to be delivered over the Plan
Period (2011-31) of ‘at least 16,000’ homes. This will in part be achieved by ‘the provision of at least
1,500 homes throughout the district in accordance with the settlement hierarchy, allocated through
Neighbourhood Planning.’ The purpose of this HNA is to identify Upper Beeding’s ‘fair share’ of the Local
Authority housing figure. RQ1.
50. RQ1. What quantity of housing is appropriate for the plan area?
2.1.2 Tenure
51. UBPC recognise a need for affordable housing in the area; the study should therefore consider the
suitability of Local Plan policy as regards affordable housing for the NPA, and the tenures of affordable
housing needed to meet housing need.
52. RQ2. What tenure of affordable housing (social housing, affordable rented, shared ownership,
intermediate rented) should be included in the housing mix?
53. RQ3. What tenure of market housing (private rented and housing for sale) should be included in the
housing mix?
2.1.3 Type and Size
54. There is a concern within UBPC of a shortage of dwellings suitable for young people, and the Parish
notes the growth of young professional people moving to the area. Likewise, there is a need among
older people to downsize.
55. RQ4. What type and size of dwellings are suited to:
-older people (in particular those living alone in large houses and those suffering from
dementia)
-first time buyers (in particular the children of current residents and young professionals)
2.1.4 The Housing Market Area
56. Before answering these research questions, it is necessary to describe the sources from which we draw
our evidence. The PPG states that plan-makers can refer to existing secondary data to inform their
assessment of housing need7; such sources include relevant reports commissioned by the local
planning authority. In the case of Upper Beeding HNA, we refer to a number of documents (the ‘SHMA
studies’) which together provide the evidence base for the housing policies contained in the current
adopted Local Plan, the Horsham District Planning Framework (HDPF). These documents are listed
below:
- Northern West Sussex Strategic Housing Market Assessment, May 2009 (SHMA09)
- Northern West Sussex – Horsham Strategic Housing Market Assessment Update, October 2012
(SHMAU12)
- Northern West Sussex Housing Market Area – Affordable Housing Needs Model Update
(AHNMU14)
- Housing Need for Horsham District, 2015 (HNHD15)
7
PPG Paragraph: 014 Reference ID: 2a-014-20140306
AECOM
21You can also read