DRAFT - Real Estate Market Analysis: State of New Hampshire Lakes Region Facility
←
→
Page content transcription
If your browser does not render page correctly, please read the page content below
DRAFT - Real Estate Market Analysis:
State of New Hampshire Lakes Region
Facility

May 18, 2018

Prepared for:
State of New Hampshire
Lakeshore Redevelopment Planning Commission

                                              120 West Avenue, Suite 303
                                              Saratoga Springs, NY 12866
                                                           518.899.2608
                                              www.camoinassociates.com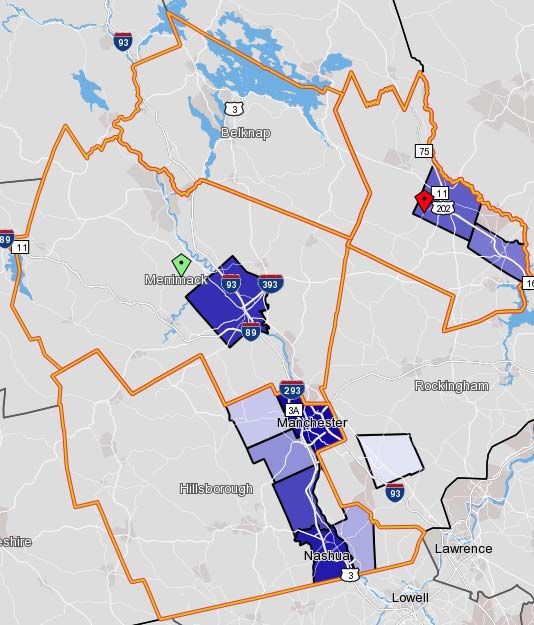
About Camoin Associates
Camoin Associates has provided economic development consulting services
to municipalities, economic development agencies, and private enterprises
since 1999. Through the services offered, Camoin Associates has had the
opportunity to serve EDOs and local and state governments from Maine to
California; corporations and organizations that include Lowes Home
Improvement, FedEx, Volvo (Nova Bus) and the New York Islanders; as well as
private developers proposing projects in excess of $600 million. Our
reputation for detailed, place-specific, and accurate analysis has led to
projects in 30 states and garnered attention from national media outlets
including Marketplace (NPR), Forbes magazine, and The Wall Street Journal.
Additionally, our marketing strategies have helped our clients gain both
national and local media coverage for their projects in order to build public
support and leverage additional funding. We are based in Saratoga Springs,
NY, with regional offices in Portland, ME; Boston, MA; Brattleboro, VT; and
Richmond, VA. To learn more about our experience and projects in all of our
service lines, please visit our website at www.camoinassociates.com. You can
also find us on Twitter @camoinassociate and on Facebook.

The Project Team
Michael N’dolo
Vice President, Project Principal
Rachel Selsky
Senior Project Manager, Project Manager
Anna Winslow
Analyst, Project Staff
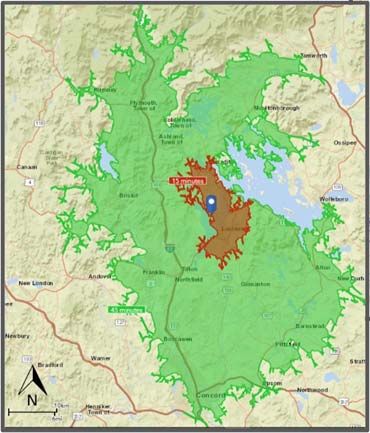
Table of Contents
Executive Summary ........................................................................................................................................................................................... 1
Site Location and Previous Work ................................................................................................................................................................. 7
Demographic and Socioeconomic Profile ................................................................................................................................................ 8
Industrial and Flex Space ..............................................................................................................................................................................13
Office Space ......................................................................................................................................................................................................16
Residential .........................................................................................................................................................................................................21
Retail....................................................................................................................................................................................................................31
Tourism and Recreation ............................................................................................................................................................................... 41
Attachment A: Data Sources ....................................................................................................................................................................... 50

Table of Tables
Table 1: Basic Demographic Comparison ................................................................................................................................................... 9
Table 2: Residents by Place of Work, Economic Region .....................................................................................................................11
Table 3: Workers by Place of Residence, Economic Region ..............................................................................................................11
Table 4: Industrial Job Growth, Lakes Region ..........................................................................................................................................14
Table 5: Industrial Job Growth, Economic Region .................................................................................................................................15
Table 6: Growth in Office Utilizing Occupations, Lakes Region .......................................................................................................17
Table 7: Growth in Office Utilizing Occupations, Economic Region ...............................................................................................18
Table 8: Office Space Demand ......................................................................................................................................................................19
Table 9: Health Industry Growth, Lakes Region ......................................................................................................................................19
Table 10: Health Industry Growth, Economic Region ...........................................................................................................................20
Table 11: Housing Units by Units in Structure ........................................................................................................................................21
Table 12: Housing Units by Year Structure Built, 2015 ........................................................................................................................22
Table 13: Residential Building Permits Issued, Economic Region, 2013-2017 ...........................................................................22
Table 14: Housing Values (Owner Occupied Housing), Lakes Region...........................................................................................24
Table 15: Housing Values (Owner Occupied Housing), Economic Region ..................................................................................24
Table 16: Renter-Occupied Housing Units by Monthly Rent, 2015 ................................................................................................25
Table 17: Change in Number of Households, 2000-2022 ..................................................................................................................26
Table 18: Household Trends by Tenure, Lakes Region ........................................................................................................................26
Table 19: Household Trends by Tenure, Economic Region ...............................................................................................................27
Table 20: Households by Size, 2010 ............................................................................................................................................................27
Table 21: Household Income Trends, Lakes Region .............................................................................................................................28
Table 22: Household Income Trends, Economic Region.....................................................................................................................29
Table 23: Age 50+ Population Growth, Lakes Region..........................................................................................................................30
Table 24: Age 50+ Population Growth, Economic Region .................................................................................................................30
Table 25: Households by Income and Age of Householder (2017), 15 Minute Drive Time ..................................................32
Table 26: Households by Income and Age of Householder (2017), 45 Minute Drive Time ..................................................32
Table 27: Top Tapestry Segments of the Economic Region, 2017 ..................................................................................................33
Table 28: Consumer Spending Index, 45 Minute Drive Time ............................................................................................................36
Table 29: Supportable Retail - 15-Minute Drive Time from Lakes Region Facility ...................................................................40
Table 30: Supportable Retail - 45-Minute Drive Time from Lakes Region Facility ...................................................................40

               Camoin Associates | DRAFT - Real Estate Market Analysis: State of New Hampshire Lakes Region Facility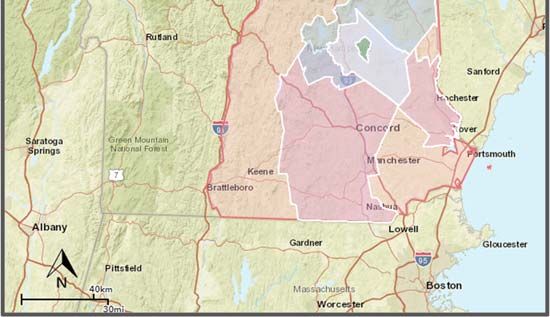
Table 31: Accommodation Inventory, Lakes Region, 2018 ................................................................................................................43
Table 32: Arts, Entertainment, and Recreation Businesses .................................................................................................................45
Table 33: Arts, Entertainment, and Recreation Industry Groups, Economic Region ................................................................45
Table 34: Top Arts, Entertainment, and Recreation Industry Sub-Sectors, Economic Region .............................................46
Table 35: Leisure and Sports Market Potential, Economic Region..................................................................................................47
Table 36: General Sports Market Potential, Economic Region .........................................................................................................47
Table 37: Fitness Market Potential, Economic Region .........................................................................................................................48
Table 38: Outdoor Activity Market Potential, Economic Region......................................................................................................48
Table 39: Entertainment Industry Market Potential, Economic Region.........................................................................................49

Table of Figures
Figure 1: Study Areas........................................................................................................................................................................................... 1
Figure 2: Study Areas........................................................................................................................................................................................... 2
Figure 3: Site Location ........................................................................................................................................................................................ 7
Figure 4: Commuting Patterns, Economic Region .................................................................................................................................10
Figure 5: Map - Workers by Place of Residence, Economic Region ...............................................................................................11
Figure 6: Map - Residents by Place of Work, Economic Region ......................................................................................................11
Figure 7: Owner Occupied Housing Values, 2017 .................................................................................................................................23
Figure 8: Percent Change in Households by Income Range, 2017-2022 .....................................................................................28
Figure 12: Map - Accessibility to the Lakes Region ..............................................................................................................................42

               Camoin Associates | DRAFT - Real Estate Market Analysis: State of New Hampshire Lakes Region Facility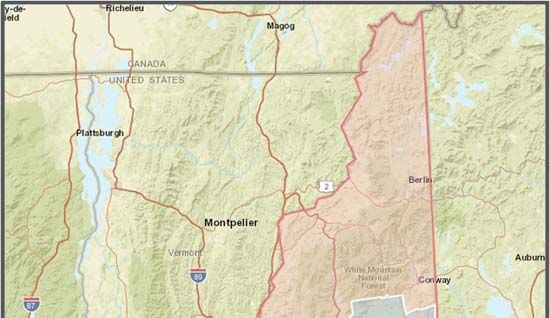
Executive Summary
Camoin Associates was commissioned to complete a market analysis report for the state-owned Lakes Region
Facility Site (the “Site”) and the surrounding region to identify potential redevelopment opportunities for the Site.
The following market data analysis consists of:
Demographic and Socioeconomic Profile
Industrial and Flex Market Analysis
Office Space Market Analysis
Hospitality Market Analysis
Residential Market Analysis
Retail Market Analysis
Tourism and Recreation Market Analysis
The purpose of this report is to describe current market conditions and identify local and regional trends that may
affect the redevelopment of the Lakes Region Facility. The key findings of the market analysis are summarized in the
executive summary with more information included in the full report.
Geographies Studied
This market analysis considers several different geographical areas to compare local and regional trends, as well as
to align with the available data sources. See Figure 1: Study Areasand Figure 2: Study Areas for more detail on the
study areas. The following geographies were considered:
City of Laconia: The city was examined for Figure 1: Study Areas
demographic and socioeconomic comparison.
City of
County of Belknap: The county was
Laconia
examined for demographic and
Lakes Region
socioeconomic comparison.
Facility
Lakes Region: The Lakes Region is defined by
the Lakes Region Planning Commission as the
towns of Alexandria, Alton, Andover, Ashland,
Barnstead, Belmont, Bridgewater, Bristol, State of New
Center Harbor, Danbury, Effingham, Franklin, Hampshire
Freedom, Gilford, Gilmanton, Hebron, Hill,
Holderness, Laconia, Meredith, Moultonborough, Lakes
New Hampton, Northfield, Ossipee, Sanbornton, Region
City of
Sandwich, Tamworth, Tilton, Tuftonboro, and Laconia
Wolfeboro. The Lakes Region was used Belknap
throughout this report to examine demographic, County
socioeconomic, office, residential, industrial, and Economic
tourism data. Region
Economic Region: The Economic Region is
defined by the counties of Belknap, Strafford,
Hillsborough, and Merrimack. The Economic
Region was also used throughout the report.
Camoin Associates | DRAFT - Real Estate Market Analysis: State of New Hampshire Lakes Region Facility 1
State of New Hampshire: Data
for the state was used to provide Figure 2: Study Areas
context for smaller geographies
throughout the analysis.
15 Minute Drive-time from
Lakes Region Facility Site (Local
Trade Area): This drive-time
radius was utilized to study the
Interstate
local retail trade area.
93/Route 3
45 Minute Drive-time from Corridor
Lakes Region Facility Site Local
(Regional Trade Area): This Trade Area
drive-time radius was utilized to
Regional
study the regional retail trade Trade Area
area.
Interstate 93/Route 3 Corridor:
The 93/3 Corridor was used to
provide context for the office and
industrial space markets, using the
CBRE New England Market Outlook
report.
Key Findings: Demographic & Socioeconomic
The Economic Region is projected to grow at the fastest rate compared to other geographies in terms of
population and households, adding 23,460 people and 9,376 households, an increase of 3.1% and 3.2%
from 2017 through 2022.
The population of the Economic Region is significantly younger than the population of the Lakes Region
and the county, with a median age of 41.1. The Lakes Region demonstrates the oldest population, with a
median age of 47.5, which is projected to increase to nearly 49 by 2022. The immediate vicinity of the Lakes
Region Facility has an older median age, with the City of Laconia having a median age of 44.5 and Belknap
County having median age of 46.6. As the age of residents increases, there will be more need for units that
allow aging in place, transitional housing options, and potential to downsize.
Economic Region households are wealthier than residents of comparison geographies overall, with a
median household income of nearly $71,000.
Approximately 234,400 people both live and work within the Economic Region. Approximately 113,500 live
within the region and are employed outside, while 94,400 are employed within the region and live outside.
Finding employment opportunities for those residents who are traveling out of the Economic Region will
decrease their commute time and improve their quality of life.
Key Findings: Industrial and Flex
The Lakes Region has excess industrial and flex space available, including at nearby O’Shea Industrial Park
and the Lakes Region Industrial park. Laconia, and the Site specifically, have limited access to the highway
and ease of transportation would be a constraint for production-related industries. Projected growth in
industrial utilizing industries can be accommodated within the existing business parks in Laconia and/or the
parks in Franklin and Tilton.
Camoin Associates | DRAFT - Real Estate Market Analysis: State of New Hampshire Lakes Region Facility 2
When considering the larger Economic Region, CBRE reports an existing inventory of 44.2 million square
feet within the 93/3 Corridor in southern New Hampshire. Absorption rates rested at 6.6% in 2017. Low
vacancy and increasing demand have allowed for less flexible terms and more expensive new leases. NNN
rates rose to $6.16 in 2017.1 Southern New Hampshire has more attractive market conditions for industrial
development than the area surrounding the Site. Therefore, industrial companies would look to southern
New Hampshire before considering locating in Laconia.
The Manufacturing and Transportation and Warehousing industries show the some demand in the Lakes
Region in terms of industrial space. The Manufacturing industry is expected to see a net gain 127 jobs over
the next 10 years, while Transportation and Warehousing is projected to gain 37 jobs over the same period.
Within the greater Economic Region, Transportation and Warehousing is projected to gain 212 jobs through
2027. However, the Manufacturing industry shows a projected net loss of over 1,300 jobs. Overall, the local
region around the Site is not seeing any substantial job growth that would warrant additional industrial
space.
Key Findings: Office
Nationally, preferences are evolving in the office market, causing much of existing space to be considered
outdated. While there are still some office users who are looking for a more traditional office park style
development, more and more tenants are seeking spaces that are attractive to their workforce with high
levels of amenities, walkability to a wide variety of services, flexible layout, and more urban connectivity. The
location and connectivity of the Lakes Region Facility as it currently exists would not be ideal for an office
park development; however, with some additional amenities, use-types, and increased connectivity, it could
become an attractive location for office users.
According to CBRE, the Interstate 93/Route 3 Corridor office vacancy rates were healthy in 2016 and 2017,
remaining constant at 10.4%. Both rents and vacancies are lower within the Southern New Hampshire
subregions compared to the rest of New England. NNN rates in the Corridor stayed stagnant at $11.31 in
2016 and 2017. Currently, the 93/3 Corridor has approximately 22.3 million square feet of office space.
Based on growth in office-utilizing occupations, the office space outlook in the Economic Region shows
demand for an annual estimated 212,160 square feet of new office space. Over 5 years, this demand equals
1.06 million square feet of space. Some of this could be captured on the Site; however, changing
preferences for office space users would require development of nearby amenities and increased
connectivity with goods and services. Furthermore, looking at the more local region around the Site the
overall economic activity is very low and suggests a weak office market.
The demand for medical office is expected to be strong over the next five years with growth expected in
office-utilizing industries, such as Offices of Physicians (1,500 new jobs in Economic Region); Offices of
Dentists (208 new jobs in Economic Region); and Offices of Other Health Practitioners (387 new jobs in
Economic Region).
Key Findings: Residential
Home-buying practices are drastically evolving as millennials and baby boomers dominate the housing
market. Both young and old are looking for homes that are connected to amenities such as restaurants,
shopping, entertainment, and work space. The combined trend of having children later in life and empty-
nesters looking to downsize has put increased pressure on multifamily housing development projects.
1
CoStar defines triple net (NNN) rents as, “A lease in which a tenant is responsible for all expenses associated with their proportional share of
occupancy of the building.”
Camoin Associates | DRAFT - Real Estate Market Analysis: State of New Hampshire Lakes Region Facility 3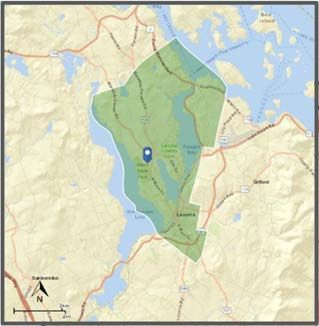
The Economic Region population is projected to increase at the fastest rate compared to the other
geographies, increasing by 3.1% over the coming five years. The Economic Region is projected to
experience an increase of nearly 9,400 households through 2022. Within the Economic Region there are a
number of unique small cities that offer walkability, night life, and attractive housing options; however, with
the right development project, Laconia could be able to capture that growth.
It is reported that the available inventory for purchasing residential units is extremely limited, making it
difficult for people who desire to live in the area to find houses. The homes in the $200,000 to $300,000
range sell extremely quickly.
Single-family housing is the dominant type of residential development in both the Lakes Region and
Economic Region, at 78% and over 65%, respectively.
The Lakes Region housing stock is younger than that of the Economic Region, with a median year built of
1978 compared to 1975 in the Economic Region.
Housing values are relatively lower in the Lakes Region with median home value of owner-occupied housing
at $231,400 compared to $255,400 in the Economic Region.
Household incomes are projected to rise, specifically within the greater Economic Region, indicating there
may be potential for higher-end housing.
About 37% of housing units in the Lakes Region are vacant compared to 11% in the overall Economic
Region; however, the vast majority of vacancy within the Lakes Region is due to seasonal vacancy and does
not indicate a surplus of housing inventory. About 85% of Belknap County vacant homes are seasonally
vacant. Approximately 26% of occupied housing units within the Lakes Region are renter-occupied, while
33% within the Economic region are renter-occupied. The mix between owners and renters is not projected
to change.
Lakes Region median rental rate is about $100 lower than that of the greater Economic Region. This is a
result of the Economic Region having a greater proportion of high-end rental units (over $1,250 per month).
The population over the age of 55 is projected to grow significantly in both regions, meaning there will be
demand for age-appropriate housing. The most immediate demand will be for independent living facilities,
as well as market-rate condos and apartments in the core of the community. This is because empty-nesters
will begin to shift their housing preferences from the single-family home to smaller units with less upkeep in
areas that are walkable to local shops and amenities. Many people have strong connections to the Lakes
Region after years of summer vacations and visiting with family and therefore, may look to retire or
downsize in the area. There has been high demand for smaller units by older individuals looking to buy
housing in the area, both single family and multifamily.
Key Findings: Retail
The retail market is rapidly changing as consumers continue to incorporate online shopping into their
everyday lives. Brick and mortar stores are finding ways to adapt and thrive in this market by incorporating
more experiences, online/offline coordination, focusing on customer service, and being a destination for
repeat visitation. Creating a retail destination within the Lakes Region Facility would require a variety of
retailers, incorporating the tourism sector, and offering an experience that is appealing to a wide range of
family members and demographics.
A retail gap analysis found that in the Local Trade Area (15-minute drive time from the Lakes Region
Facility), eight industries have sales leakage, meaning that local businesses are not meeting all of the needs
of local customers. These industries are:
Camoin Associates | DRAFT - Real Estate Market Analysis: State of New Hampshire Lakes Region Facility 4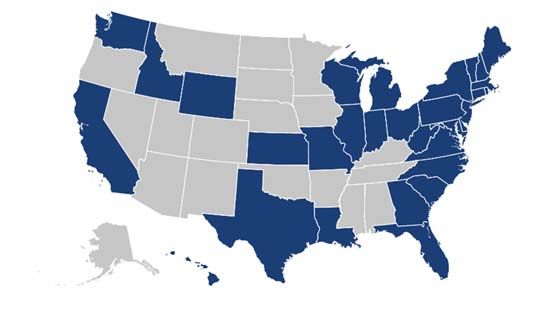
o Electronics & Appliance Stores (Note that electronics are increasingly purchased online, and thus a
physical electronics store would likely not be the best fit for a new business.)
o Grocery Stores,
o Clothing Stores,
o Sporting Goods & Hobby Stores,
o Book, Periodical & Music Stores,
o Department Stores,
o Other General Merchandise Stores, and
o Office Supplies, Stationery & Gift Stores.
A retail gap analysis for the Regional Trade Area (45-minute drive time from Site) demonstrated four areas
with leakage: Grocery Stores; Clothing Stores; Book, Periodical & Music Stores; and Office Supplies,
Stationery & Gift Stores.
Presence of sales leakage does not necessarily indicate that there is business potential. In order to
determine business potential, the analysis considers the amount of spending that could be “captured”
locally by new businesses to see if there is enough potential to actually support new businesses. The results
showed that there is enough leakage within the Grocery Stores and Clothing Stores areas to support a new
business opening. This analysis is based on existing economic activity and does not account for potential
increase in residents due to new housing and/or commercial activity.
Retail development should consider the work being done to revitalize downtown Laconia to avoid creating
a competing retail destination, but rather link the two areas and support the development of the larger area.
Key Findings: Tourism and Recreation
The Site offers access to Ahearn State Park, proximity to Lake Winnisquam beachfront, and many acres of
what could be open space for trails or other recreational uses. The Site is also home to the Robbie Mills
sports complex that is owned by the City of Laconia and used as sports fields.
Based on interviews with local stakeholders, there is a demand for event, conference, and wedding space
that can accommodate larger events. Currently. the area lacks space that can accommodate large parties of
over 300.
Market trends indicate that people are looking for authentic experiences when they are traveling and will
look to spend time where they can do multiple things on their trip.
In 2016, there were 2.42 million visits to the Lakes Region, much of which was concentrated in the summer
season. However, there are regional ski resorts and winter destinations as well. Visits to the Lakes Region in
2016 made up approximately 22.8% of State of New Hampshire visits as a whole, despite the Lakes Region
accounting for only 8.5% of the state’s population.
Travelers to the Lakes Region spent approximately $564.3 million in the region, comprising 11.1% of total
spending by travelers in New Hampshire.
The Lakes Region is easily accessible by major highways and state routes; however, the region is a
significant distance from any major airport, aside from a smaller airport that is used by private planes.
The Lakes Region has a diverse inventory in terms of hotel accommodations and recreational assets,
particularly for family activities during summer months.
Camoin Associates | DRAFT - Real Estate Market Analysis: State of New Hampshire Lakes Region Facility 5
The Arts, Entertainment, and Recreation industry in the Economic Region is expected to grow by 11% over
the next 10 years as measured by employment. Most growth will be in Gambling Industries at 52%
projected growth. Note that growth in gambling industries may be a “statistical anomaly” and warrants
additional qualitative research.
Of 367 Arts, Entertainment, and Recreation businesses in the Economic Region, 119 are operating within the
Fitness and Recreational Sports Centers industry. Golf Courses and Country Clubs employ 1,050 people. All
Other Amusement and Recreation Industries is projected to see significant job growth over the coming 10-
year period.
Residents of the Economic Region participate in outdoor recreation activities substantially more than the
national average in terms of canoeing/kayaking, mounting biking, bird watching, backpacking, camping,
hiking, and skiing.
General sports participation is average, with the exception of golf and baseball, which are especially popular
in the Economic Region compared to the US overall. The fitness market, specifically related to
jogging/running, weight lifting, yoga, walking, aerobics, Pilates, and swimming is also relatively strong in the
Economic Region.
Attendance at non-sports-related venues is also strong with rock and country concerts among the most
popular followed by art galleries and bars/night clubs.
The Colonial Theater in downtown Laconia is undergoing major renovations that will attract performances
to serve residents and visitors.
Overall, the results indicate that new entertainment and recreation businesses and/or facilities such as
sports fields may be feasible given strong participation rates. Further investigation will be needed to
determine if existing businesses and facilities are meeting current demand.
Camoin Associates | DRAFT - Real Estate Market Analysis: State of New Hampshire Lakes Region Facility 6Site Location and Previous
Work
The Lakes Region Facility Site (“Site”), located along
State Route 106 in the City of Laconia is currently
owned by the State of New Hampshire and is
approximately 250 acres. It is surrounded by large Lakes Region
Facility
areas of open space and passive recreation land,
including the immediately adjacent Ahearn State
Park with 3,500 linear feet of waterfront access to
Lake Winnisquam and is used for swimming, biking,
fishing, and hiking. The Site is within three miles of
downtown Laconia along Route 3.
Currently the property is primarily unused, with
some remaining users such as the Lakes Region
Mutual Fire Aid station on the southern portion of
the property, a sports complex owned by the City in
the northern part of the property, and some
remaining state intuitional users. Structures do
remain onsite, but most of them have significant
environmental and structural issues. Figure 3: Site Location
The Site was appraised in 2011 at $2,160,000. The
appraisal included assumptions regarding the zoning associated with the parcel of Rural Residential 1, which
required a lot area of two acres and any cluster developments requiring a Conditional Use Permit from the City. This
zoning allowed for approximately 75 building lots when accounting for infrastructure, roads, and some common
area. Since that time, there has been discussion regarding adjusting the zoning and the City is undergoing a Master
Planning process where zoning of the Site for mixed-use is being considered.
Significant planning and visioning work has been done related to the Site to help identify potential redevelopment
opportunities. Some of the work includes a report by
Vita Nuova that was prepared for the United States
Environmental Protection Agency, a community
visioning process around reuse of the Site, an
appraisal of the property, a Public Policy Framework
for Defining the Future of the Lakes Region Facility
prepared by Better Future Alliance, and many other
community conversations and engagement sessions.
All of this work was reviewed as part of this market
analysis and supplemented with additional
information gathered from data collection and
analysis as well as interviews.
Camoin Associates | DRAFT - Real Estate Market Analysis: State of New Hampshire Lakes Region Facility 7Demographic and Socioeconomic Profile
Overview:
Table 1, below, compares basic demographic indicators for the City of Laconia, Belknap County, Lakes Region,
Economic Region, and State of New Hampshire. The key comparisons include the following:
The Economic Region is projected to grow at the fastest rate compared to comparison geographies in terms
of population and households, adding 23,460 people, an increase of 3.1% through 2022.
The average household size is largest in the Economic Region, followed by the state with 2.49 and 2.45,
respectively. Average household size is projected to stay stagnant across all geographies, except for the City
of Laconia, where average household size is projected to increase by 0.01 to 2.28, a 0.4% increase.
The population of the Economic Region is significantly younger than the populations of the other study
areas, with a median age of 41.1. The Lakes Region has the oldest population, with median age of 47.5, and
is also projected to age faster than comparison geographies over the coming five years.
Economic Region households are wealthier than residents of comparison geographies overall, with a
median household income of nearly $71,000. The City of Laconia demonstrates the lowest median
household income, at $51,963.
Despite the City of Laconia showing the lowest median income in 2017 with $51,963, income is projected to
grow rapidly through 2022, with a growth rate of 18.8% to $61,736. The Economic Region shows the slowest
projected growth, at 9.7%.
Camoin Associates | DRAFT - Real Estate Market Analysis: State of New Hampshire Lakes Region Facility 8Table 1: Basic Demographic Comparison
Basic Demographics
Population
2017 2022 Change 2017-2022 % Change 2017-2022
City of Laconia 16,393 16,696 303 1.8%
Belknap County 62,479 64,033 1,554 2.5%
Lakes Region 116,558 118,628 2,070 1.8%
Economic Region 761,455 784,915 23,460 3.1%
New Hampshire 1,364,251 1,397,066 32,815 2.4%
Households
2017 2022 Change 2017-2022 % Change 2017-2022
City of Laconia 6,999 7,125 126 1.8%
Belknap County 25,687 26,313 626 2.4%
Lakes Region 48,543 49,412 869 1.8%
Economic Region 296,072 305,448 9,376 3.2%
New Hampshire 538,434 552,164 13,730 2.5%
Average Household Size
2017 2022 Change 2017-2022 % Change 2017-2022
City of Laconia 2.27 2.28 0.01 0.4%
Belknap County 2.40 2.40 0.00 0.0%
Lakes Region 2.36 2.36 0.00 0.0%
Economic Region 2.49 2.49 0.00 0.0%
New Hampshire 2.45 2.45 0.00 0.0%
Median Age
2017 2022 Change 2017-2022 % Change 2017-2022
City of Laconia 44.5 45.2 0.7 1.6%
Belknap County 46.6 47.9 1.3 2.8%
Lakes Region 47.5 48.9 1.4 2.9%
Economic Region 41.1 42.0 0.9 2.2%
New Hampshire 42.7 43.6 0.9 2.1%
Median Household Income
2017 2022 Change 2017-2022 % Change 2017-2022
City of Laconia $ 51,963 $ 61,736 $ 9,773 18.8%
Belknap County $ 59,621 $ 68,503 $ 8,882 14.9%
Lakes Region $ 58,010 $ 66,361 $ 8,351 14.4%
Economic Region $ 70,931 $ 77,829 $ 6,898 9.7%
New Hampshire $ 69,725 $ 77,446 $ 7,721 11.1%
Source: Esri
Camoin Associates | DRAFT - Real Estate Market Analysis: State of New Hampshire Lakes Region Facility 9Commuting Patterns
The following images and tables present information on where Economic Region residents work and where
Economic Region workers live. Jobs are concentrated primarily in Manchester, where nearly 13% of residents work.
Manchester also houses the highest concentration of regional workers, at 11.4%. Approximately 234,400 people
both live and work within the Economic Region. Approximately 113,500 live within the Economic Region and are
employed outside, while 94,400 are employed within the region and live outside.
Figure 4: Commuting Patterns, Economic Region
Source: OntheMap
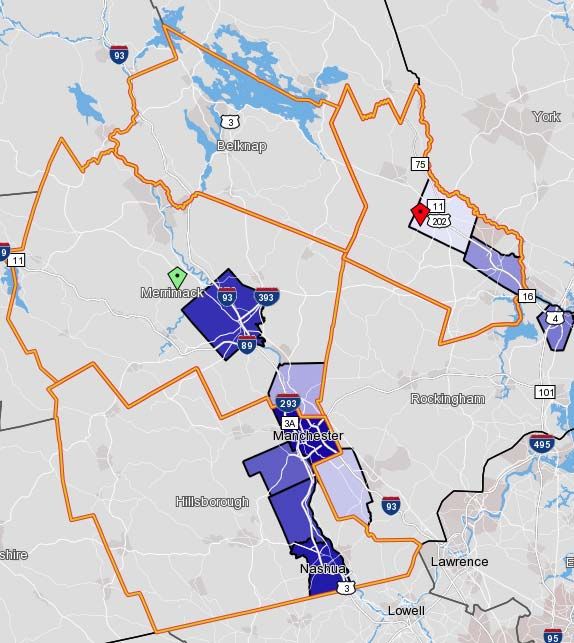
Camoin Associates | DRAFT - Real Estate Market Analysis: State of New Hampshire Lakes Region Facility 10Table 2 and Figure 6 show the concentrations of where Figure 6: Map - Residents by Place of Work, Economic Region
residents of the Economic Region work. The City of
Manchester holds the most workers by far, at 12.9% of
the regional population. However, the City of Nashua
and City of Concord also hold high concentrations of
workers, at 9.7% and 8.6%, respectively. This data
indicates that work places are fairly spread out across
the Economic Region, as 50% of the regional
population falls under the “All Other Municipalities”
category.
Table 2: Residents by Place of Work, Economic Region
Economic Region Residents by Place of Work, 2015
Rank Municipality Count Share
1 Manchester city, NH 44,752 12.9%
2 Nashua city, NH 33,710 9.7%
3 Concord city, NH 29,852 8.6%
4 Merrimack town, NH 11,020 3.2%
5 Bedford town, NH 10,702 3.1%
6 Portsmouth city, NH 10,351 3.0%
7 Dover city, NH 9,973 2.9%
8 Hooksett town, NH 8,608 2.5%
9 Londonderry town, NH 7,767 2.2%
10 Rochester city, NH 7,538 2.2%
All Other Municipalities 173,620 49.9% Source: OntheMap
Total 347,893 100%
Sourc: Census OnTheMap
Figure 5: Map - Workers by Place of Residence, Economic Region
Table 3 and Figure 5 show the concentrations of where
Economic Region workers live. Few people who work
within the region live outside of it. Workers primarily
live within Manchester, followed by Nashua and
Concord cities, at 11.4%, 7.6%, and 5.1%, respectively.
Again, workers’ places of residence are vastly spread
out across the region, as over 60% fall within the “All
Other Municipalities” category.
Table 3: Workers by Place of Residence, Economic Region
Economic Region Workers by Place of Residence, 2015
Rank Municipality Count Share
1 Manchester city, NH 37,463 11.4%
2 Nashua city, NH 25,125 7.6%
3 Concord city, NH 16,771 5.1%
4 Merrimack town, NH 7,493 2.9%
5 Rochester city, NH 8,597 2.6%
6 Dover city, NH 7,553 2.3%
7 Bedford town, NH 7,280 2.2%
8 Hudson town, NH 6,597 2.0%
9 Goffstown town, NH 6,297 1.9%
10 Derry town, NH 6,070 1.8%
All Other Municipalities 197,537 60.1%
Total 328,893 100% Source: OntheMap
Sourc: Census OnTheMap
Camoin Associates | DRAFT - Real Estate Market Analysis: State of New Hampshire Lakes Region Facility 11Conclusion
Through the interviews and analysis of demographic data, it is evident that the Lakes Region is facing a large
challenge related to the older age of residents. This challenge is similar to many other communities in New England,
and is a result of limited housing options, limited job options, and limited entertainment and social opportunities. As
young people move out of the area, the businesses have a greater difficulty finding a quality workforce and they are
forced to look to locate elsewhere.
Camoin Associates | DRAFT - Real Estate Market Analysis: State of New Hampshire Lakes Region Facility 12Industrial and Flex Space
Industrial space is commercial space that is utilized for purposes such as light manufacturing, warehousing and
distribution, research and development, transportation, etc. Similar to industrial space, flex space is defined as:
“A type of building(s) designed to be versatile, which may be used in combination with office (corporate
headquarters), research and development, quasi-retail sales, and including but not limited to industrial,
warehouse, and distribution uses. At least half of the rentable area of the building must be used as office
space. Flex buildings typically have ceiling heights under 18', with light industrial zoning. Flex buildings have
also been called Incubator, Tech and Showroom buildings in markets throughout the country.”2
Flex space buildings can be used for office, medical, industrial, warehouse, distribution, quasi-retail, or research and
development space.
Market Conditions
The national market for industrial space continues to tighten as consumer spending steadily rises and e-commerce
becomes a staple in everyday life, causing increased need for warehousing and distribution space across the
country. Industrial demand has not wavered, despite rising rents. Average NNN rents in the US in Q1 of 2017
reached $5.25 for industrial space, while vacancy fell to 5.3% in the same period.3 The Jones Lang LaSalle (JLL)
Industrial Outlook for 2017 reported that 206.7 million square feet of industrial space was under construction in Q1
of 2017. However, absorption continues to outpace new deliveries nationally. Most regional markets are projected
to continue to favor landlords as demand remains steady.4
According to CBRE’s most recent 2018 New England Market Outlook report, the New Hampshire industrial and flex
space market is extremely tight, with a steady increase in demand coupled with stagnant supply. This combination
has led to an increase in off-market transactions as motivated buyers look to get creative to acquire desired space.
Digging deeper into the market in the 93/3 Corridor (which contains the Economic Region but is more focused on
Southern New Hampshire) more specifically, CBRE reports that developers are quickly moving to identify sites for
new industrial space. Currently, there is 44.2 million square feet of industrial space within this submarket; however,
absorption rates are high, at 6.6% in 2017. The low vacancy rates and high demand have given landlords the power
to capture longer and more expensive lease agreements. Looking at Manchester as an example, NNN rates rose
from $6.09 in 2016 to $6.16 in 2017.
CBRE states, “…existing inventory will continue to have strong absorption unless a property’s obsolescence prevents
this, in which case repurposing and redevelopment remain viable options.” The report also projects that rental rates
may continue to rise throughout the southern part of New Hampshire. The scarcity of high quality industrial and flex
space leaves room for new development within the region.5
Looking more specifically in the Laconia area, existing industrial parks such as the Lakes Region Industrial Park and
O’Shea Industrial park have excess supply and have been unable to lease up or sell the space. The transportation
access to the Site is a constraint for manufactures who are looking to locate in close proximity to major highways
and close to major markets.
2
CoStar.
3 CoStar defines triple net (NNN) rents as, “A lease in which a tenant is responsible for all expenses associated with their proportional share of
occupancy of the building.”
4
JLL US Industrial Outlook 2017.
5
CBRE 2018 New England Market Outlook.
Camoin Associates | DRAFT - Real Estate Market Analysis: State of New Hampshire Lakes Region Facility 13Demand
Future demand for industrial and flex space can be better understood by looking at employment projections within
the industry sectors likely to utilize this space. Specifically, the following two-digit NAICS industries were examined:
Mining, Quarrying, and Oil and Gas Extraction; Utilities; Manufacturing; and Transportation and Warehousing.
Table 4 shows employment growth in the four industries broken down into the more detailed 3-digit NAICS level for
the Lakes Region. Most growth is expected in Manufacturing, which will expand by 127 jobs on net over the next 10
years. This growth is most concentrated in the Fabricated Metal Product Manufacturing, which is projected to grow
by 127 jobs, as well as Transportation Equipment Manufacturing, which is predicted to grow by 37 jobs. Assuming
that manufacturing related jobs require approximately 500 square feet per job, that would mean that the market
could support approximately 63,500 square feet of industrial space, which could be accommodated within the
existing parks or at other business parks in the Lakes Region.
Table 4: Industrial Job Growth, Lakes Region
Industrial Growth, Lakes Region
2017 - 2027 2017 - 2027
NAICS Description 2017 Jobs 2027 Jobs
# Change % Change
211 Oil and Gas Extraction 0 0 0 0%
212 Mining (except Oil and Gas) 63 67 4 6%
213 Support Activities for Mining 12 25 13 108%
221 Utilities 237 241 4 2%
311 Food Manufacturing 63 95 32 51%
312 Beverage and Tobacco Product Manufacturing 50 65 15 30%
313 Textile MillsTable 5 examines the same industrial growth data for the Economic Region. On net, Transportation and
Warehousing industries are projected to see the most growth over the coming 10-year period, adding 212 jobs.
Transit and Ground Passenger Transportation and Couriers and Messengers are projected to see the most growth of
these subsectors, adding 145 jobs and 126 jobs, respectively. Though the 2-digit Manufacturing industry shows net
job loss of 1,323 jobs, three Manufacturing subsectors are projected to see significant growth: Fabricated Metal
Product Manufacturing (+375 jobs); Transportation Equipment Manufacturing (+314 jobs); and Food Manufacturing
(+149 jobs).
Table 5: Industrial Job Growth, Economic Region
Industrial Growth, Economic Region
2017 - 2027 2017 - 2027
NAICS Description 2017 Jobs 2027 Jobs
# Change % Change
211 Oil and Gas Extraction 0 0 0 0%
212 Mining (except Oil and Gas) 306 315 9 3%
213 Support Activities for Mining 30 57 27 90%
221 Utilities 798 678 (120) -15%
311 Food Manufacturing 1,007 1,156 149 15%
312 Beverage and Tobacco Product Manufacturing 508 506 (2) 0%
313 Textile Mills 1,303 1,388 85 7%
314 Textile Product Mills 299 366 67 22%
315 Apparel Manufacturing 325 361 36 11%
316 Leather and Allied Product Manufacturing 43 38 (5) -12%
321 Wood Product Manufacturing 649 702 53 8%
322 Paper Manufacturing 501 210 (291) -58%
323 Printing and Related Support Activities 1,410 1,165 (245) -17%
324 Petroleum and Coal Products Manufacturing 30 26 (4) -13%
325 Chemical Manufacturing 439 476 37 8%
326 Plastics and Rubber Products Manufacturing 3,342 3,249 (93) -3%
327 Nonmetallic Mineral Product Manufacturing 844 783 (61) -7%
331 Primary Metal Manufacturing 1,881 1,951 70 4%
332 Fabricated Metal Product Manufacturing 5,765 6,140 375 7%
333 Machinery Manufacturing 2,333 1,949 (384) -16%
334 Computer and Electronic Product Manufacturing 12,327 11,490 (837) -7%
Electrical Equipment, Appliance, and Component
335 1,585 1,020 (565) -36%
Manufacturing
336 Transportation Equipment Manufacturing 1,757 2,071 314 18%
337 Furniture and Related Product Manufacturing 406 488 82 20%
339 Miscellaneous Manufacturing 2,945 2,841 (104) -4%
481 Air Transportation 270 302 32 12%
482 Rail Transportation 163 165 2 1%
483 Water Transportation 0 0 0 0%
484 Truck Transportation 1,786 1,777 (9) -1%
485 Transit and Ground Passenger Transportation 1,789 1,934 145 8%
486 Pipeline Transportation 0 0 0 0%
487 Scenic and Sightseeing Transportation 62 80 18 29%
488 Support Activities for Transportation 546 522 (24) -4%
491 Postal ServiceOffice Space
Market Conditions
The rise of the tech industry nationally is driving most demand for office space. The tech industry’s leasing volume
has vastly outpaced that of any other industry. This trend has been particularly driven by increasing business and
consumer confidence. JLL’s 2017 US Office Outlook report concludes that, “rents surge as business confidence
jumps and economic forecasts remain optimistic.” National data shows that Class A rents have outpaced Class B
rents more than two-fold, bringing the average rent in the US office market to $32.78 per square foot in Q1 of 2017.
Vacancy during that same period was 14.7% and is projected to rise nationally through 2018 due to additional
completions resulting in tenants shifting to newer space, leaving outdated space vacant.6
Office culture in the United States is drastically evolving due to changing preferences and priorities of employees.
CBRE posits,
“Driven by the purported preferences of millennial employees, who make up an ever-increasing share of the
workforce, ‘traditional’ office configurations have become a borderline liability in many places. Instead of long
hallways with closed-door private offices and low-ceilinged, fluorescent-lit cube farms, open bench seating and
exposed HVAC systems are becoming de rigueur for most remodeling efforts.”
This cultural shift is in turn affecting the types of office space demanded by local businesses. Employees expect to
see open space with lounge areas, cafés, and glass walls and doors dispersed throughout their work environment.
Examining office market trends in the Interstate 93/Route 3 Corridor shows that vacancies are lower in southern
New Hampshire as compared to other New England regions; however, rents are also lower. CBRE reported a vacancy
rate of 10.4% in both 2016 and 2017 in the corridor, while NNN rents also remained flat at $11.31. In total, the
corridor currently houses about 22.3 million square feet of office space. CBRE’s projections through 2018 show that
vacancy and rental rates will remain flat, but will also stay above those of the adjacent Seacoast submarket. 7
6 JLL US Office Outlook 2017.
7
CBRE 2018 New England Market Outlook.
Camoin Associates | DRAFT - Real Estate Market Analysis: State of New Hampshire Lakes Region Facility 16Demand
The demand outlook for office space in the Lakes Region and Economic Region markets is dependent on growth in
office-utilizing occupations. Table 6 shows the categories of office utilizing occupations and the expected 10-year
growth in those occupations through 2027. The total number of new office-utilizing occupations is then used to
estimate future office space demand. There is projected to be a total of 730 new office-utilizing occupations in the
Lakes Region and 10,608 new office-utilizing jobs throughout the Economic Region by 2027.
Table 6: Growth in Office Utilizing Occupations, Lakes Region
Growth in Office Utilizing Occupations, Lakes Region
Avg. Hourly
SOC Code Title 2017 Jobs 2027 Jobs # Change % Change
Earnings
11-1000 Top Executives 795 842 47 6% $ 55.35
Advertising, Marketing, Promotions, Public
11-2000 179 193 14 8% $ 56.42
Relations, and Sales Managers
11-3000 Operations Specialties Managers 497 537 40 8% $ 51.42
11-9000 Other Management Occupations 1,308 1,322 14 1% $ 32.84
13-1000 Business Operations Specialists 1,094 1,184 90 8% $ 31.55
13-2000 Financial Specialists 590 616 26 4% $ 32.70
15-1100 Computer Occupations 683 766 83 12% $ 36.64
15-2000 Mathematical Science Occupations 41 49 8 20% $ 35.28
17-1000 Architects, Surveyors, and Cartographers 57 53 (4) -7% $ 29.75
17-2000 Engineers 471 491 20 4% $ 40.12
Drafters, Engineering Technicians, and Mapping
17-3000 243 242 (1) 0% $ 24.98
Technicians
19-3000 Social Scientists and Related Workers 88 92 4 5% $ 34.42
Counselors, Social Workers, and Other
21-1000 577 614 37 6% $ 21.69
Community and Social Service Specialists
23-1000 Lawyers, Judges, and Related Workers 170 157 (13) -8% $ 47.67
23-2000 Legal Support Workers 98 87 (11) -11% $ 24.09
27-1000 Art and Design Workers 279 321 42 15% $ 17.26
Entertainers and Performers, Sports and Related
27-2000 227 259 32 14% $ 21.11
Workers
27-3000 Media and Communication Workers 200 212 12 6% $ 22.38
27-4000 Media and Communication Equipment Workers 70 78 8 11% $ 19.03
29-1000 Health Diagnosing and Treating Practitioners 1,677 1,747 70 4% $ 48.01
29-2000 Health Technologists and Technicians 803 868 65 8% $ 22.81
Other Healthcare Practitioners and Technical
29-9000 63 66 3 5% $ 31.72
Occupations
Occupational Therapy and Physical Therapist
31-2000 90 112 22 24% $ 24.68
Assistants and Aides
31-9000 Other Healthcare Support Occupations 351 388 37 11% $ 17.14
33-1000 Supervisors of Protective Service Workers 118 126 8 7% $ 32.23
33-9000 Other Protective Service Workers 231 228 (3) -1% $ 14.43
Supervisors of Building and Grounds Cleaning and
37-1000 167 175 8 5% $ 19.47
Maintenance Workers
Supervisors of Office and Administrative Support
43-1000 413 440 27 7% $ 24.99
Workers
43-2000 Communications Equipment Operators 33 24 (9) -27% $ 14.51
43-3000 Financial Clerks 870 825 (45) -5% $ 17.20
43-4000 Information and Record Clerks 1,443 1,515 72 5% $ 15.10
Material Recording, Scheduling, Dispatching, and
43-5000 1,358 1,352 (6) 0% $ 15.61
Distributing Workers
43-6000 Secretaries and Administrative Assistants 1,039 1,047 8 1% $ 17.31
43-9000 Other Office and Administrative Support Workers 1,189 1,212 23 2% $ 16.51
Total 17,510 18,240 730 4% $ 28.38
Source: EMSI
Camoin Associates | DRAFT - Real Estate Market Analysis: State of New Hampshire Lakes Region Facility 17Table 7: Growth in Office Utilizing Occupations, Economic Region
Growth in Office Utilizing Occupations, Economic Region
Avg. Hourly
SOC Code Title 2017 Jobs 2027 Jobs # Change % Change
Earnings
11-1000 Top Executives 6,808 7,131 323 5% $ 60.91
Advertising, Marketing, Promotions, Public
11-2000 2,080 2,205 125 6% $ 61.06
Relations, and Sales Managers
11-3000 Operations Specialties Managers 5,527 5,866 339 6% $ 55.70
11-9000 Other Management Occupations 9,163 9,369 206 2% $ 38.81
13-1000 Business Operations Specialists 11,929 12,819 890 7% $ 32.91
13-2000 Financial Specialists 6,849 7,425 576 8% $ 36.76
15-1100 Computer Occupations 11,051 12,181 1,130 10% $ 40.93
15-2000 Mathematical Science Occupations 610 734 124 20% $ 38.51
17-1000 Architects, Surveyors, and Cartographers 386 364 (22) -6% $ 29.76
17-2000 Engineers 5,071 5,052 (19) 0% $ 44.43
Drafters, Engineering Technicians, and Mapping
17-3000 2,595 2,462 (133) -5% $ 27.12
Technicians
19-3000 Social Scientists and Related Workers 646 678 32 5% $ 36.58
Counselors, Social Workers, and Other
21-1000 4,964 5,401 437 9% $ 22.35
Community and Social Service Specialists
23-1000 Lawyers, Judges, and Related Workers 1,535 1,507 (28) -2% $ 54.04
23-2000 Legal Support Workers 1,068 1,057 (11) -1% $ 26.29
27-1000 Art and Design Workers 2,366 2,588 222 9% $ 19.11
Entertainers and Performers, Sports and Related
27-2000 1,803 2,080 277 15% $ 19.75
Workers
27-3000 Media and Communication Workers 2,134 2,209 75 4% $ 24.60
27-4000 Media and Communication Equipment Workers 744 809 65 9% $ 19.38
29-1000 Health Diagnosing and Treating Practitioners 15,175 17,068 1,893 12% $ 51.02
29-2000 Health Technologists and Technicians 7,108 8,042 934 13% $ 23.51
Other Healthcare Practitioners and Technical
29-9000 596 647 51 9% $ 31.46
Occupations
Occupational Therapy and Physical Therapist
31-2000 568 686 118 21% $ 23.41
Assistants and Aides
31-9000 Other Healthcare Support Occupations 3,931 4,536 605 15% $ 17.74
33-1000 Supervisors of Protective Service Workers 686 719 33 5% $ 35.40
33-9000 Other Protective Service Workers 2,263 2,430 167 7% $ 15.43
Supervisors of Building and Grounds Cleaning and
37-1000 922 989 67 7% $ 20.37
Maintenance Workers
Supervisors of Office and Administrative Support
43-1000 3,946 4,221 275 7% $ 26.73
Workers
43-2000 Communications Equipment Operators 299 226 (73) -24% $ 15.77
43-3000 Financial Clerks 8,285 8,141 (144) -2% $ 18.56
43-4000 Information and Record Clerks 13,816 14,799 983 7% $ 16.55
Material Recording, Scheduling, Dispatching, and
43-5000 12,191 12,098 (93) -1% $ 16.66
Distributing Workers
43-6000 Secretaries and Administrative Assistants 10,528 11,096 568 5% $ 18.42
43-9000 Other Office and Administrative Support Workers 13,171 13,787 616 5% $ 17.65
Total 170,812 181,420 10,608 6% $ 30.82
Source: EMSI
Camoin Associates | DRAFT - Real Estate Market Analysis: State of New Hampshire Lakes Region Facility 18Based on the above analysis, it is estimated that the Lakes Region will add 73 office-utilizing occupations per year,
while the Economic Region is projected to add approximately 1,061 office occupations per year. Using an industry
standard of 200 square feet per employee, we estimated an annual demand of 14,600 square feet of office space per
year in the Lakes Region and 212,160 square feet of space in the Economic Region. Over five years to 2022, the total
office demand in the Lakes Region is estimated to be 73,000 square feet and 1.06 million square feet in the
Economic Region. It is important to point out that there is some overlap between the regions geographically and
therefore, job figures and square foot estimates in the two regions will also contain some overlap.
Table 8: Office Space Demand
Office Space Demand
Annual 5-Year
Annual New SF per
Geography Demand for Demand for
Employees Employee
Office Space Office Space
Lakes Region 73 200 14,600 73,000
Economic Region 1,061 200 212,160 1,060,800
Source: EMSI; Camoin Associates
Medical Office Demand
The level of future demand for medical office space can be determined by looking at industry job projections for the
various health-related industry sub-sectors. Table 9 and Table 10 show a breakdown of job growth in the health
industry from 2017 to 2027 for the Lakes Region and Economic Region. Over the next ten years, there will be an
estimated 204 new health industry jobs in the Lakes Region and 5,562 new health industry jobs in the Economic
Region. Not all of the sub-sectors require office space; however, some that do are expected to see large gains,
including Offices of Physicians (1,500 new jobs in Economic Region); Offices of Dentists (208 new jobs in the
Economic Region); and Offices of Other Health Practitioners (387 new jobs in the Economic Region).
Table 9: Health Industry Growth, Lakes Region
Health Industry Growth, Lakes Region
2017 - 2027 2017 - 2027
NAICS Description 2017 Jobs 2027 Jobs
# Change % Change
6211 Offices of Physicians 593 658 65 11%
6212 Offices of Dentists 253 279 26 10%
6213 Offices of Other Health Practitioners 336 458 122 36%
6214 Outpatient Care Centers 248 327 79 32%
6215 Medical and Diagnostic LaboratoriesYou can also read