UTILITY-SCALE RENEWABLE ENERGY MARKET INTELLIGENCE REPORT
←
→
Page content transcription
If your browser does not render page correctly, please read the page content below
2021
UTILITY-SCALE
RENEWABLE
ENERGY

                   UTILITY-SCALE RENEWABLE ENERGY: MIR 2021
MARKET
INTELLIGENCE
REPORT

                     1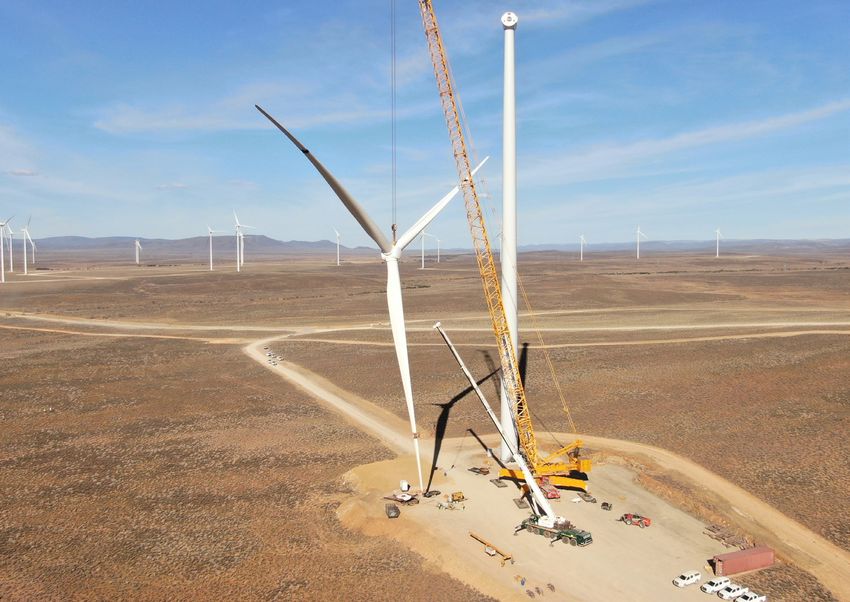
GreenCape
          GreenCape is a non-profit organisation that works at the interface of business, government
             and academia to identify and remove barriers to economically viable green economy
        infrastructure solutions. Working in developing countries, GreenCape catalyses the replication
          and large-scale uptake of these solutions to enable each country and its citizens to prosper.

                                             Acknowledgements
                     We thank Mandisa Mkhize and Jack Radmore for the time and effort
                      that they have put into compiling this market intelligence report.

                                                    Disclaimer
                 While every attempt has been made to ensure that the information published
                 in this report is accurate, no responsibility is accepted for any loss or damage
               to any person or entity relying on any of the information contained in this report.

                                         Copyright © GreenCape 2021

                This document may be downloaded at no charge from www.greencape.co.za.
                                          All rights reserved.

                       Subscribe to receive e-mail alerts or GreenCape news, events,
             and publications by registering as a member on our website: www.greencape.co.za

       This market intelligence report was produced in partnership with the Western Cape Government
                             Department of Economic Development and Tourism.

                  2nd Floor, North Wharf, 42 Hans Strijdom Ave, Foreshore, Cape Town, 8001

             Authors:                                     Mandisa Mkhize and Jack Radmore
 Editorial and review:                                    Cilnette Pienaar, Lauren Basson,
		                                                        Bruce Raw and Nicholas Fordyce
              Images:                                     GreenCape, Mainstream Renewable Power,
		                                                        Nicholas Fordyce and Kervin Prayag
  Layout and design:                                      Tamlin Lockhart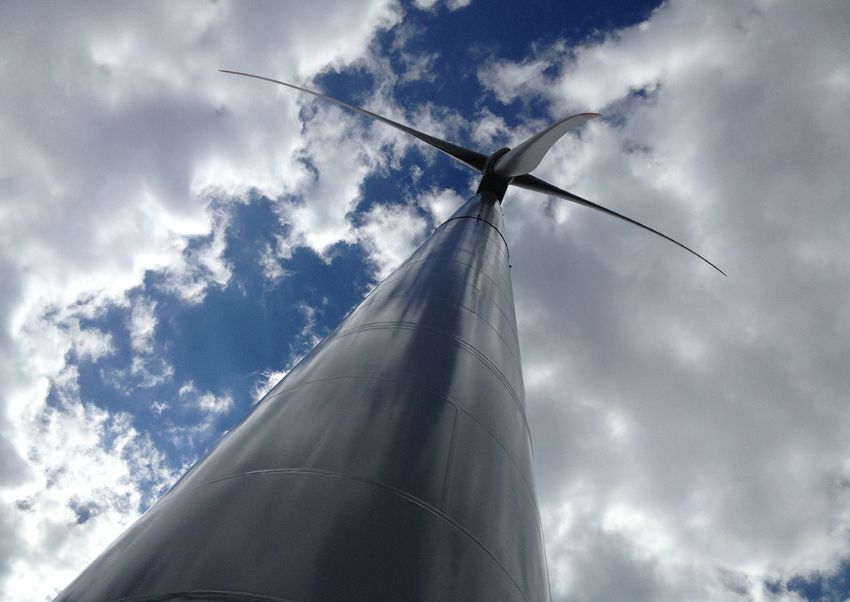
CONTENTS
                                                                                                                              Policy, legislation, and governance 35
                                                                                                                              3.1. Guiding policies 37
                                                                                                                              3.2. Government departments involved
                                                                                                                                   in the energy and electricity sector 38

                                                                       Introduction and purpose 7

                                               0                                                2
                                                                       1                                                   3
WATER: MIR 2020RENEWABLE ENERGY: MIR 2021

                                                 Executive summary 1                            Sector overview 11
                                                 What’s new? 5                                  2.1. South African electricity landscape 13
                                                                                                2.2. The development of utility-scale renewable energy in South Africa 13
                                                                                                2.3. The Renewable Energy Independent Power Producer Procurement Programme 18
                                                                                                2.4. South Africa utility-scale renewable energy market size 23
                                                                                                     2.4.1. The current South Africa utility-scale renewable energy market size 23
UTILITY-SCALE

                                                                                                     2.4.2. The economic value of renewable energy facilities 24
                                                                                                     2.4.3. Investments made to date 24
                                                                                                     2.4.4. The integrated resource plan 26
                                                                                                     2.4.5. The potential of utility-scale renewable energy – beyond the IRP 32
                                                                                                2.5. South Africa Renewable value chain 33
                                                                                                2.6. Key players in the South Africa renewable energy market 34
  03
  ii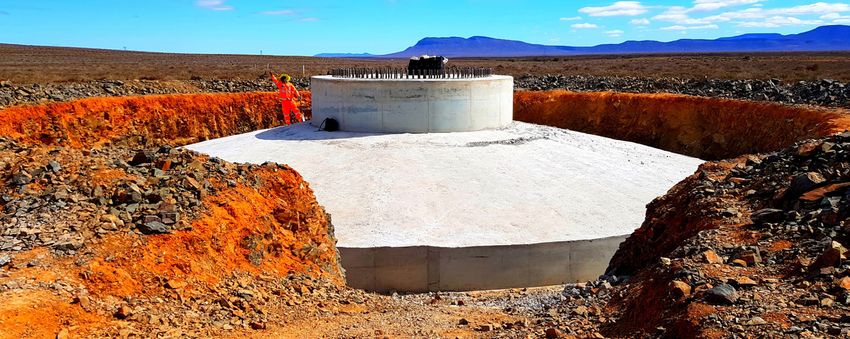
Funding and incentives 57
                                  5.1. General database web page 59
                                       5.1.1. Green Finance Database 59
                                       5.1.2. Government funding and incentives database 59
                                       5.1.3. Finfind database 60
                                       5.1.4. AlliedCrowds database 60

                                                                                                     GreenCape’s support to
                                                                                                     businesses and investors 65

4                                                              6                                                                   8
                                5                                                             7
                                                                      The Western Cape: Africa’s growing
                                                                      greentech hub 61
Emerging opportunities, drivers and barriers 39
4.1. Market drivers 41
     4.1.1. The decreasing cost of utility-scale renewable energy 41
     4.1.2. Policy drivers of market size 42
     4.1.3. Other related drivers 42
4.2. Market opportunities 43
     4.2.1. Continuation of the REIPPPP based on the IRP 2019 allocations 43
     4.2.2. Increased local manufacturing 45
     4.2.3. Distributed generation (1-10MW) 50
     4.2.4. Utility-scale battery storage 52
4.3. Market barriers and uncertainties 54
     4.3.1. Ensuring continuity and transparency 54
     4.3.2. Maintaining the country’s existing manufacturing base 54
     4.3.3. Eskom unbundling – reforming the country’s electricity sector 54                                                       References 67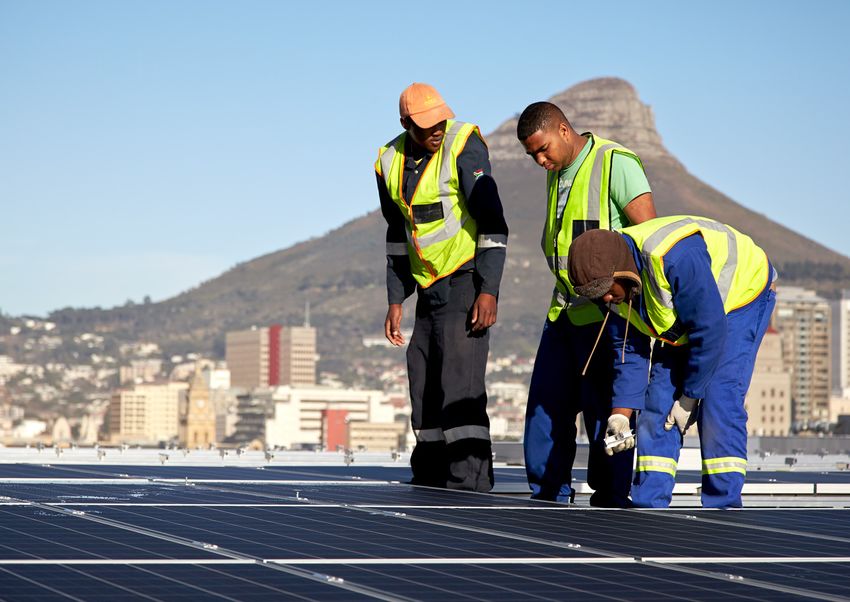
LIST OF FIGURES

                                            Figure 1:    Commencement and timeline of REIPPPP in South Africa                                            9
                                            Figure 2:    Key utility renewable energy movements in South Africa to date                             14-16
                                            Figure 3:    Governance structure of IPPO                                                                  20
                                            Figure 4:    IPPO procurement process                                                                       21
                                            Figure 5:    Countries from which private investments in the REIPPPP were made                             25
                                            Figure 6:    Policy adjusted plan IRP 2019                                                                 31
                                            Figure 7 :   Renewable energy value chain                                                                  33
                                            Figure 8:    Typical company types involved at different stages of project life                           34
                                            Figure 9:    Policies guiding South Africa’s economic growth trajectory                                    37
                                            Figure 10:   Eco-system of policies relating to the REIPPPP                                                38
                                            Figure 11:   Tariff decline and capacity awarded for solar PV and onshore wind across all bid windows      41
                                            Figure 12:   Relative ease of localisation in wind value chain                                             48
WATER: MIR 2020RENEWABLE ENERGY: MIR 2021
UTILITY-SCALE
  03
  iv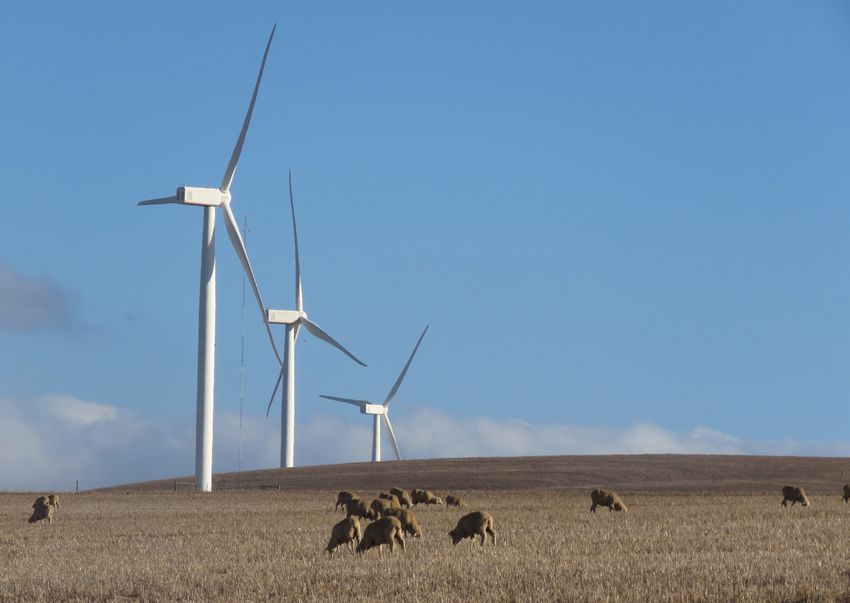
LIST OF TABLES

Table 1:    Summary of market opportunities within the utility-scale renewable energy market                                             3
Table 2:    Additional drivers in the South African renewable energy market                                                             17
Table 3:    Key policy movements in the establishment of the renewable energy sector in SA                                              19
Table 4:    As of end of 2020, the breakdown of the large-scale and small-scale REIPPPP procured, determined and operational capacity
            allocations across all renewable energy technologies                                                                        23
Table 5:    Tariffs offered by solar PV, wind, and CSP projects over bid windows [R/kWh]                                                24
Table 6:    Actual procured generation capacities per REIPPPP bid window                                                                26
Table 7:    Summary of the developments and revisions of South Africa’s IRP from 2010 – 2019 as well as key planning assumptions        28
Table 8:    Capacities for least-cost plan by year 2030                                                                                 29
Table 9:    Capacities for least-cost plan by 2030 with annual build limits on renewable energy                                         29
Table 10:   New additional capacity by 2030 based on IRP 2019:                                                                          32
Table 11:   Future pipeline based on IRP 2019 allocations                                                                               32
Table 12:   Climate Change Agreements of which South Africa is a signatory.                                                             42
Table 13:   Procurement outstanding based on IRP adjustments from 2010 – 2019                                                           44
Table 14:   Average local content as a percentage of total project cost versus threshold and targets                                    45
Table 15:   dtic’s and National Treasury designated sectors instruction number 2 of 2016/2017; list of solar PV component designated

                                                                                                                                             UTILITY-SCALE RENEWABLE ENERGY: MIR 2021
            for local production                                                                                                        47
Table 16:   Estimate of number of manufacturing facilities and job creation potential for wind turbine localisation for IRP2019 build   49
Table 17:   South African pricing markers for Li-ion storage system sizes focused on smaller scale installations                        53
Table 18:   Eskom unbundling highlights                                                                                                 56

                                                                                                                                               v
LIST OF ABBREVIATIONS AND ACRONYMS

                                            BW      Bid window                                              ICN      International Cleantech Network
                                            CAGR    Compound annual growth rate                             IDC      Industrial Development Corporation
                                            CCA     Customs controlled area                                 IDZ      Industrial Development Zone
                                            CCGE    Closed Cycle Gas Engine                                 IEA      International Energy Agency
                                            CCGT    Closed Cycle Gas Turbine                                IEC      International Electrotechnical Commission
                                            CCT     City of Cape Town                                       IEP      Integrated Energy Plan
                                            COD     Commercial operation date                               IFC      International Finance Corporation
                                            CPUT    Cape Peninsula University of Technology                 ISMO     Independent System and Market Operator
                                            CSIR    Council for Scientific and Industrial Research          IPP      Independent Power Producer
                                            CSP     Concentrated solar power                                IPPO     Independent Power Producers Office
                                            DBSA    Development Bank of Southern Africa                     IRP      Integrated Resource Plan
                                            DE      Distribution entity                                     kWh      Kilowatt-hour
                                            DEA     Department of Environmental Affairs                     LCOE     Levelised cost of energy
                                            DG/EG   Distributed Generation/Embedded Generation              LIB      Lithium-ion battery
                                            DMRE    Department of Mineral Resources and Energy              Li-ion   Lithium-ion
                                            DSI     Department of Science and Innovation                    LMO      Lithium manganese dioxide
WATER: MIR 2020RENEWABLE ENERGY: MIR 2021

                                            dtic    Department of Trade, Industry and Competition           LNG      Liquefied natural gas
                                            EAF     Energy availability factor                              MCSA     Minerals Council South Africa
                                            ED      Economic development                                    MEC      Maximum Export Capacity
                                            EDD     Economic Development Department                         MES      Minimum Emission Standard
                                            EKF     Danmarks Eksportkredit (Denmark Export Credit Agency)   MoA      Memorandum of agreement
                                            EOI     Expression of interest                                  MTPPP    Medium Term Power Purchase Procurement
                                            EPC     Engineering, procurement and construction               MWp      Megawatt peak
                                            ERA     Electricity Regulation Act No 4 of 2006                 NDP      National Development Plan
UTILITY-SCALE

                                            ETI     Employment tax incentive                                NEDLAC   National Economic Development and Labour Council
                                            GE      Generation entity                                       NMC      Nickel manganese cobalt
                                            GWp     Gigawatt peak                                           OCGT     Open cycle gas turbine
                                            ICE     Internal Combustion Engine                              OEM      Original equipment manufacturer
  03
  vi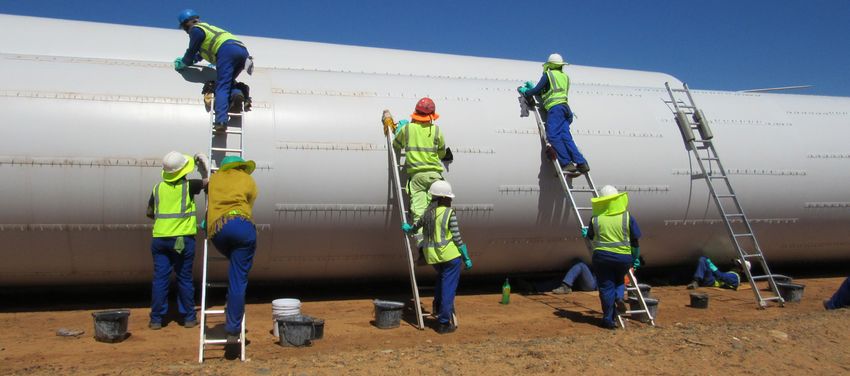
O&M       Operation and maintenance                          UNCTAD     United Nations Conference on Trade and Development
PCE       Portfolio Committee on Energy                      VFRB       Vanadium flox redox battery
PPA       Power purchase agreement                           VRE        Variable Renewable Energy
PPD       Peak Plateau Decline                               WACC       Weighted Average Cost of Capital
PPPFA     Preferential Procurement Policy Framework Act
PV        Photovoltaic
R&D       Research and development
RE        Renewable energy
RECP      Renewable Energy Cooperation Programme
REFIT     Renewable energy feed-in-tariff                    Exchange rate used: 1 US Dollar = R16.64 (October 2020)
REIPPPP   Renewable Energy Independent Power
          Producer Procurement Programme
RFBs      Request for Bids
RFP       Request for proposal
RMB       Rand Merchant Bank
RMIPPPP   Risk Mitigation Independent Producer

                                                                                                                             vii UTILITY-SCALE RENEWABLE ENERGY: MIR 2021
          Procurement Programme
SAESA     South African Energy Storage Association
SAPVIA    South African Photovoltaic Industry Association
SAREM     South African Renewable Energy Masterplan
SARETEC   South African Renewable Energy Technology Centre
SAWEA     South African Wind Energy Association
SED       Socio-economic development
SEZ       Special Economic Zone
SIPs      Strategic infrastructure projects
SMC       Supply Management Chain
SSEG      Small-scale embedded generation
TE        Transmission Entity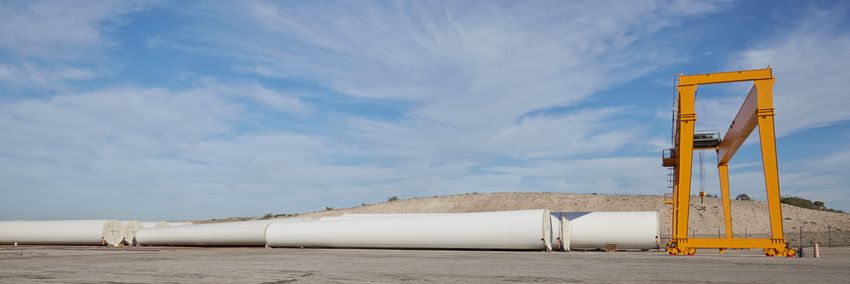
EXECUTIVE
                                            SUMMARY

                                            This market intelligence report is compiled for foreign direct and local investors that are looking to invest
                                            directly in the South African green economy through project development, asset management, equity, debt,
                                            equipment manufacturing, or support services. It highlights market opportunities in the utility-scale renewable
                                            energy market in South Africa.

                                            South Africa has a single utility      Procurement Programme              Key developments influencing the    or buy new generation capacity
                                            model managed by the state-            (REIPPPP). Of this, just over      market in 2020/21:                  and develop their own power
                                            owned entity, Eskom, with a total      4 GW is already connected to                                           generation projects.
WATER: MIR 2020RENEWABLE ENERGY: MIR 2021

                                            installed generation capacity of       the national electricity grid,     • The Department of Mineral
                                            48 GW. This capacity is currently      with the balance expected            Resources and Energy (DMRE)      • The Section 34 Determination
                                            dominated by coal-power                to be connected by 2020/21.          has gazetted amendments to         enables the DMRE to undertake
                                            stations (over 80%).                   The cost of renewable energy         the Electricity Regulations on     procurement of additional
                                                                                   projects continues to decrease,      New Generation Capacity. The       electricity capacity in
                                            Since the establishment of the         with projects in the most recent     amendments clarify the regime      accordance with the Integrated
                                            Independent Power Producers            rounds (round 4 of the REIPPPP)      applicable to municipalities       Resource Plan (IRP 2019). The
                                            Office (IPPO) in 2010, more than 6.4   producing a levelised cost of        when requesting determinations     capacity determined is 11.3 GW of
UTILITY-SCALE

                                            GW of electricity from renewable       energy of less than R0.61/kWh.       under Section 34 of the            generation and 513 MW of energy
                                            energy sources has been procured                                            Electricity Amendment Act, and     storage, including 6 800 MW
                                            through the Renewable Energy                                                enable municipalities in good      renewable energy generation.
                                            Independent Power Producers                                                 financial standing to procure
  103
• A request for proposals for new these preferred bidders include from onshore wind and 1 000 IRP 2019 allocations is R99 billion
generation capacity of 2 000 a combination of a range of MW from solar photovoltaic. for solar PV, R271 billion for wind,
MW under the Risk Mitigation technologies that are solar PV, and R48 billion for distributed
Independent Power Producer wind, liquefied gas and battery In addition to the Integrated generation of less than 10 MW.
Procurement Programme storage. These eight projects will Resource Plan (IRP) gazetted in
(RMIPPPP) was issued in August inject a total of private sector October 2019, these developments This available market will depend
2020, with the closing date investment amount of R45 billion suggest significant growth largely on (1) the commencement
extended to December 2020. In into the country’s economy. opportunities in the utility-scale of new bid windows of the REIPPP
March 2021, DMRE announced renewable energy market over programme against the IRP 2019
the eight preferred bidders • On 19th March 2021, the DMRE the next ten years (2020 – 2030). allocations; (2) local content
totalling 1845 MW and a further released a Request for Proposals Based on the R/MW overnight requirements; (3) the licensing
three eligible bids totalling 150 (RFPs) for a new bid window capital cost per technology (as requirements for distributed
MW (these three bids are subject under REIPPPP (BW 5). The RFP per the IPPO quarterly reports), generation; and (4) the finalisation
to value for money propositions calls for proposals from IPPs to the approximate available South of Eskom’s unbundling process
in line with the provisions in the develop new generation capacity African utility-scale renewable and legal establishment of the
RFP). The solutions provided by of 2 600 MW, including 1 600 MW energy market value based on transmission entity.
Wind turbine manufacturing
at GRI Renewable Industries,
Atlantis Special Economic
Zone for green technologies.
©GreenCape
UTILITY-SCALE RENEWABLE ENERGY: MIR 2021
2SUMMARY OF MARKET OPPORTUNITIES WITHIN THE UTILITY-SCALE RENEWABLE ENERGY MARKET 1
Table 1: Summary of market opportunities within the utility-scale renewable energy market
Opportunity Stakeholders Key drivers Barriers Term Macro impact
Continuation • IPPs, EPCs, OEMs, • 6 800 MW, 4th determination • Consistency and scale Short to • Energy security, load shedding
of the REIPPPP O&Ms • Expected 35 GW decommissioned of procurement medium term reduce
based on the IRP • Local coal by 2050 (1-5 years) - Economy & jobs recovery-
2019 allocations manufacturers • Eskom EAF restraints • Eskom’s dire financial situation
• Financiers • Just Transition
• South African Infrastructure
Plan
Increased local • Local manufacturers, • Increased local content requirements • Energy and industrial Medium to • Job transition for the coal
manufacturing OEMs, EPCs from upcoming REIPPPP rounds policy uncertainty long term sector
of renewable • DTIC, DMRE, IPPO • Eskom’s Just Energy Transition • The business case for (3-10 years) • Disrupted economy due
energy plans, risk of stranded assets local manufacturing still to COVID-19 impacts on
components and (repurposing sites) depends on restrictive the economy and
systems trade policies unemployment rates
• Local manufacturing support
through the REDZ, IDZs, SEZs, RE
corridors, etc.
Distributed • Municipalities • Municipalities in good financial • Policy uncertainty Short term • Increasing cost of Eskom’s
generation (1–10 • Mining companies standing can apply to procure new on third party (1–3 years) electricity
MW as per the generation capacity transactions • Eskom’s EAF: Availability and
• Industrialists
IRP 2019) • Mining sector allowed to self- • Private PPAs reliability of energy supply1
and commercial
generate, only required to register structuring
WATER: MIR 2020RENEWABLE ENERGY: MIR 2021
customers
with NERSA
• Eskom
• Wheeling opportunities
• IPPs
• Uncapped capacity from 2019 to
2022 in IRP 2019
• Hybrid solutions and competitive
tariff prices
UTILITY-SCALE
1
REIPPPP – Renewable Energy Independent Power Producers Procurement Programme; DMRE – Department of Mineral Resources and Energy; dtic – Department of Trade, Industry
and Competition; REDZ – Renewable Energy Development Zone; IDZ – Industrial Development Zone; SEZ – Special Economic Zone; MEC – Maximum Export Capacity; EPC – Engineering
Procurement Construction; OEM – Original Equipment Manufacturer; IPPs – Independent Power Producers; O&M – Operation & Maintenance; IPPO – Independent Power Producers Office;
EAF – Energy Availability Factor
03
3Opportunity Stakeholders Key drivers Barriers Term Macro impact
Utility-scale • IPPs, EPCs, O&Ms • Battery Energy Storage System • Price of batteries in Medium term • Price of battery storage
battery energy • Local manufacturers, (BESS) – (min. 80 MW/320 MWh South Africa market – (5 years) declining (global)
storage financiers usable capacity for seven months) deviates from least- • CEP (Clean Energy Portfolio)
development and • Global financing institutions cost path thus Wind, Solar, Storage
• Mining sector
deployment • Limited policy on compared to Gas as
• Grid stability use case
battery integration balancing generation
• Lack of infrastructure
and R&D studies
UTILITY-SCALE RENEWABLE ENERGY: MIR 2021
Component cleaning at
Perdekraal Wind Farm.
©Mainstream
Renewable Power
4SUMMARY OF MARKET OPPORTUNITIES
WHAT’S CLICK HERE
TO WATCH A
NEW?
SUMMARY OF THE
2021 UTILITY-SCALE
RENEWABLE
ENERGY MIR
OPPORTUNITIES
Since the publication of the 2020 Utility-Scale Renewable Energy Market Intelligence Report (MIR),
there have been several important developments in the sector and in the national government’s
Renewable Energy Independent Power Producers Procurement Programme (REIPPPP).
What happened in 2020: • March: The COVID-19 case rate • April: Eskom issues several • June: DMRE approves the
increases in South Africa. Like force majeure notices to refinancing initiative for projects
• February: The Minister of Mineral many countries, the national operators of independent bid window 1 – 3.5 IPPs (sellers)
WATER: MIR 2020RENEWABLE ENERGY: MIR 2021
Resources and Energy (DMRE), government implements wind power plants, with lower that are in operation, to reduce
Gwede Mantashe, sends two national restrictions (“lockdown demand caused by the country’s tariffs over the remainder of
draft ministerial determinations regulations”) to reduce the lockdown in response to the the PPA term. At the time
(the Proposed Determinations), spread of the virus. This included COVID-19 pandemic reported of writing, 70% of the 64
prepared under section 34 of the limiting of active business as the reason. operational IPPs have indicated
the Electricity Regulation Act, activity. The lockdown, coupled they will participate in the
to the National Energy Regulator with reduced international trade, • April: Eskom System Operator refinancing initiative.
of South Africa (NERSA). sees the South African gross and General Manager
UTILITY-SCALE
domestic product (GDP) shrink Telecommunications, Tshifhiwa • July: Request for Bids for
by 51% in quarter two of 2020. Bernard Magoro, appointed as Eskom’s first package
new head of the Independent Battery Energy Storage
Power Producers Office (IPPO). Program advertised.
03
5• August: Independent Power Rolling blackouts (load shedding) This MIR updates 2020 report • The DMRE welcomed NERSA’s
Producers Office (IPPO) issues continued throughout 2019 and highlights: concurrence to the ministerial
Request for Proposals (RFP) 2020 with Eskom being unable determination for the
for 2 000 MW Risk Mitigation to match current demand with Changes in opportunity drivers/ procurement of 11 813 MW of
Independent Power Producers available supply. In March enabling environment: power with 4 800 MW (wind),
Programme (RMIPPPP) with an 2020, the country’s electricity 2 000 MW (solar PV) and 518 MW
initial due date of 24 November; demand dropped by more than • The DMRE gazetted for renewable energy storage; and
then extends bid deadline 6 000 MW immediately after amendments to the Electricity
submission to 22 December. nationwide implementation of Regulations on New Generation • The DMRE has released a
Level 5 lockdown regulations. This Capacity, enabling municipalities Request for Proposals (RFPs)
• September: DMRE determines allowed Eskom the opportunity to in good financial standing to for a new bid window under
6 800 MW to be procured to conduct short-term maintenance procure new generation capacity REIPPPP (BW 5). The RFP calls for
be generated from renewable and repairs. A total of 9 000 MW in line with the IRP 2019; proposals from IPPs to develop
energy sources (solar: 2 000 MW generating units were taken offline new generation capacity of 2 600
and onshore wind: 4 800 MW) to preserve the integrity of the • The DMRE revised Schedule 2 MW, including 1 600 MW from
and 513 MW to be generated systems, that would be available of the Electricity Act, enabling onshore wind and 1 000 MW from
from storage. In total, this will at short notice if required. A self-generation and facilitating solar photovoltaic.
enable the development of an slight relaxation of the lockdown municipal generation under
additional 11 813 MW of power regulations from Level 5 to Level “Distributed Generation”. • Minister Gwede Mantashe
by 2030. 3 saw the bulk of industries Generation plants may only announced that the licensing
returning to business. As the require registration; threshold for embedded
UTILITY-SCALE RENEWABLE ENERGY: MIR 2021
• October: DMRE gazettes the economic lockdown eased, the generation is increased from 1
amendments to the Electricity utility immediately implemented MW to 10 MW. In order to connect
Regulations on New Generation staged load shedding to deal to the grid and/or trade surplus
Capacity, enabling municipalities with a surge in energy demand. energy capacity, there is a
in good financial standing Eskom’s CEO confirmed that there requirement for license. Self-
to develop their own power would be an increased risk of load generation plants of any size
generation projects. shedding for another 12 months do not require a license and
from August 2020. there is no limit.
6INTRODUCTION
AND PURPOSE
WATER: MIR 2020RENEWABLE ENERGY: MIR 2021
This market intelligence report is compiled for foreign direct and local investors that are
looking to invest directly in the South African green economy through project development,
asset management, equity, debt, equipment manufacturing, or support services. It highlights
UTILITY-SCALE
market opportunities in the utility-scale renewable energy market in South Africa.
03
7Globally, the impact of COVID-19 The share of renewables in capacity As shown in Figure 1, the To facilitate the uptake of
has been significant. Global expansion continued its upward introduction of renewable energy renewable energy in South Africa,
energy demand declined by 3.8% trend to reach 72% in 2019/20. in the South African context dates as detailed in the 2010 IRP, the
in the first quarter of 2020, with Similarly, the renewable share of back to 2003 with the delivery Renewable Energy Independent
most of the impact felt in March total generation capacity rose from of the 2003 White Paper on Power Producer Procurement
as confinement measures were 33.3% in 2018 to 34.7% in 2019/20. At Renewable Energy. However, only Programme (REIPPPP) was
enforced in Europe, North America, the end of 2019 and the beginning of with the release of the Integrated established. The Independent
and elsewhere. The demand for 2020, global renewable generation Resource Plan (IRP) 2010-2030 in Power Procurement Office (IPPO)
coal, gas, and oil decreased by capacity amounted to 2 537 GW. 2010 did the renewable energy was created to fulfil three specific
between 2% and 8%. Renewables Renewable generation capacity framework start to take shape. duties for the REIPPPP:
were the only source that posted increased by 176 GW (+7.4%) in 2019, The purpose of the IRP 2010 was to
growth in demand, driven by larger led by solar PV, wind energy, and determine the preferred energy mix • professional advisory services;
installed capacity compared to hydropower (IRENA 2020). Solar over the next 20 years. It included • procurement management
other generation sources and PV capacity expanded the most determinations for renewable services; and
priority dispatch (International (98 GW) (IEA Renewables, 2020). energy amounting to 14 725 MW, • monitoring, evaluation, and
Energy Agency.,2020). Meanwhile, onshore wind additions coal-fired plants of 6 250 MW, and contract management services.
totalled 59 GW, and hydropower gas-fired power plants of 3 726 MW.
growth increased by 12 GW. The
During the 2020 COVID-19 key economic drivers behind this
pandemic, renewables were global increase were government
the only source of energy policy support, dedicated
that posted a growth in procurement programmes, and
demand internationally. On continually decreasing operating
UTILITY-SCALE RENEWABLE ENERGY: MIR 2021
the back of low operating and technology costs.
costs and preferential access
to many power systems, the The South African renewable
share of renewables in the energy market is following
electricity generation mix rose a similar trend to the global
considerably, with record- breakdown detailed above in
high hourly shares of variable terms of technology choice.
renewables across the world. Solar PV and onshore wind are
dominating the market growth,
backed by a growing small-scale
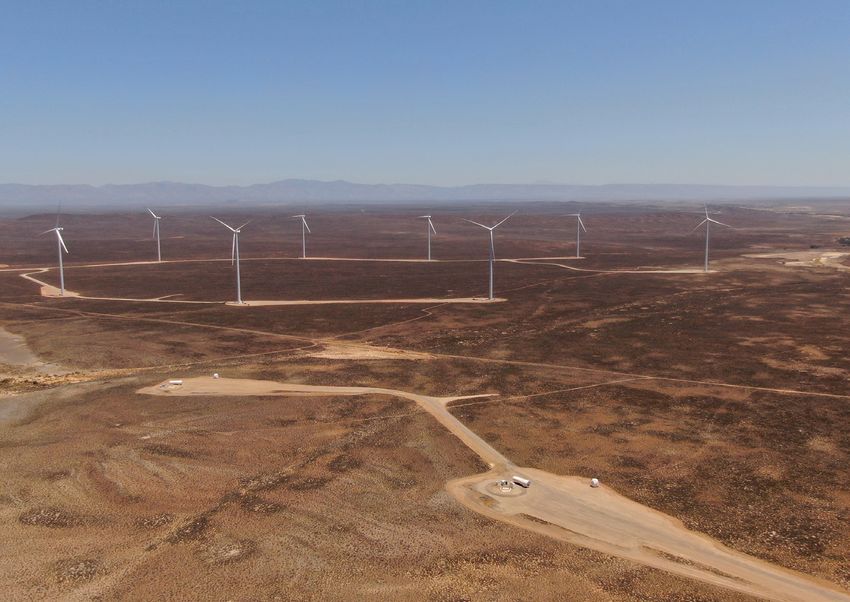
Gouda Wind Farm,
embedded generation market Western Cape.
(mostly solar for commercial ©Nicholas Fordyce
and industrial businesses).
8Figure 1: Commencement and timeline of REIPPPP in South Africa
2010
2003 -
2030
2010 2018 2018 2019 2019
White Paper Establishment IRP Determination
on RE of IPP office 22.4 GW RE of 11.8 GW RE
WATER: MIR 2020RENEWABLE ENERGY: MIR 2021
IRP Procured IRP
Energy Mix 6.3 GW of RE 24.4 GW RE
(14.7 GW RE)
UTILITY-SCALE
03
9In October 2019, the IRP 2019 Given this context, there are In what follows: Note: GreenCape’s Energy Services
with the preferred energy mix several opportunities for potential Market Intelligence Report
up until 2030 was released. The investors in the renewable energy Section 2 gives an overview of explores the energy services
plan includes determinations market in South Africa. This Market the sector and describes the market, including the embedded
for additional renewable energy Intelligence Report (MIR) provides market size and key players. generation renewable energy
amounting to 20 400 MW (excluding potential investors in the utility- Section 3 details the general market and energy efficiency.
distributed generation of 4 GW), scale renewable energy space with legislative and regulatory The energy services market is
coal-fired plants of 1 500 MW, and a greater understanding of market framework governing thus not covered in this Utility-
gas-fired power plants of 3 100 MW. opportunities in South Africa, renewable energy. Scale Renewable Energy Market
taking into account the size of Section 4 highlights emerging Intelligence Report.
To begin the procurement process the opportunities and the level opportunities, drivers,
after the publishing of the South of risk involved. and barriers.
African national IRP for electricity, Section 5 focuses on funding
the Minister of Mineral Resources The MIR is compiled for foreign and incentives.
and Energy gazetted two Section direct and local investors (persons Section 6 gives an overview of the CLICK HERE
34 determinations2 related to the or organisations) that are looking Western Cape as Africa’s growing
TO EMAIL
procurement of 2 000 MW of new to invest directly in the utility- greentech hub.
GREENCAPE’S
generation capacity under the scale renewable energy market Section 7 focuses on the services
ENERGY
SERVICES
Risk Mitigation Independent Power through project development, that GreenCape provides to
Producer Procurement Programme asset management, equity, debt, its members.
(RMIPPPP) between 2019 and 2022, equipment manufacture, or
and the procurement of a further 11 support services.
813 MW between 2022 and 2027.
UTILITY-SCALE RENEWABLE ENERGY: MIR 2021
2
Under the Electricity Regulation Act 4 of 2006
10SECTOR
OVERVIEW
WATER: MIR 2020RENEWABLE ENERGY: MIR 2021
The South African utility-scale renewable energy accounts for approximately 14% of the
available installed capacity. The industry is showing growth and potential with more than
4.3 GW of utility-scale projects connected and operational.
UTILITY-SCALE
03
11Wind turbine construction at
Perdekraal, Western Cape.
©Mainstream Renewable Power
UTILITY-SCALE RENEWABLE ENERGY: MIR 2021
12This section gives an overview Since 2010 there has been a 2.2. The development of Nevertheless, the 2011
of the market, describing the distinct decline in electricity utility-scale renewable promulgation of the IRP 2010 –
market size (present and future), demand (87% in 2010 compared energy in South Africa 2030 Policy Adjusted Plan issued
and providing a breakdown of to 79% in 2019) (Wright & Calitz, by the then Department of Energy
the basic renewable energy value 2020). A historic imbalance of The introduction of renewable (DoE) had the greatest impact on
chain and key players. The section supply and demand in South energy into national energy the renewable energy sector. The
aims to provide foundational Africa’s single buyer energy planning extends as far back Integrated Resource Plan (IRP)
information needed to explore the model over more than ten years as the 1998 White Paper on the was adopted as the official long-
investment opportunities in the resulted in intensive load shedding Energy Policy of South Africa. The term government plan for new
South African renewable energy experienced country-wide during policy committed to encouraging electricity generation capacity
market. 2019 and the first half of 2020. An private sector participation, inclusive of project timelines. It
estimated 1.3 TWh, 530 hours, were competition, and open, non- estimated planned generation
2.1. South African loadshed during these periods discriminatory access to the capacities contributing to the
electricity landscape with up to Stage 6 load shedding transmission system. overall energy mix.
implemented, which had a
South Africa’s electricity supply is significant impact on the economy The sector was further supported The IRP aims to double the
currently dominated by coal-fired (R 60 – 120 billion) (Wright & Calitz, by the 2003 White Paper on electricity capacity through a
power generation. The country has 2020). Load shedding has been Renewable Energy, by which diversified energy mix; mainly
coal-fired generation stations with driven by a combination of the government set a target of coal, gas, nuclear, and renewable
an installed capacity of between factors, including: 10 000 GWh renewable energy energy. Figure 2 on pages 14, 15
36.5 GW and 40 GW. This represents consumption by 2013, and NERSA’s and 16, illustrates some of the
more than 80% of the country’s • delayed commissioning and approval in 2009 of the policy and essential utility renewable energy
total installed capacity, amounting underperformance of new-build tariffs for a Renewable Energy developments in South Africa
WATER: MIR 2020RENEWABLE ENERGY: MIR 2021
to 48 GW (Department of Energy coal generation capacity; Feed-in Tariff (REFIT) programme. to date, with additional drivers
2019). These stations are primarily • degradation of the existing affecting the market listed in
owned and operated by Eskom, the Eskom coal fleet energy Table 2 (page 17).
national power utility. Eskom availability factor (EAF)
supplies ~95% of South Africa’s total declining from ~94% in 2002
electricity demand. The remaining to 67% in 2019/20.
5% is met through municipalities,
imports, and independent power
UTILITY-SCALE
producers (IPPs).
03
13Figure 2: Key utility renewable energy movements in South Africa to date
Dec 15
COGEN determination
1 000 MW
Aug 15
Nov 11 3rd RE
Launch of determination
REIPPPP through 6 300 MW
submission date Jun 15
Bid Window (BW) 1 13 additional
Aug 11 Aug 13 bidders – BW 4
1st RE Submission Apr 15
determination date BW 3 13 preferred
3 725 MW May 13 bidders
2011 Signing of PPA announced –
IRP 2010 to 2030 BW 2 BW 4
2003
-
2010 2011 2012 2013 2014 2015
2003 Mar 12 Mar 14
White paper on Submission Submission
RE in RSA Date BW 2 date BW 3.5
UTILITY-SCALE RENEWABLE ENERGY: MIR 2021
Nov 12 May 14
2008
Signing Tina Joemat-Peterson
Renewable
of PPA BW 1 appointed Energy
energy feed-in Dec 12 Minister
tariff (REFIT) 2nd RE determination Aug 14
consultation 3 200 MW Submission date BW 4
paper Dec 12 Nov 14
2009 Coal domestic Submission date –
COP 15 – reduce determination 2 500 MW small IPP
SA’s carbon Dec 12 Dec 14
emissions by Gas determination Signing of PPA BW 3
34% by 2020 3 126 MW
Dec 12
COGEN determination
800 MW
14Figure 2: Continued... Oct 17
David Mahlobo appointed
Energy Minister
Sep 17
Announcement to sign BW 3.5 and 4
by end Oct. Projects under 77c/kWh
End Aug
Central Energy Fund
expected to oversee IPPO
Jul 17
Acting Eskom CEO Johnny
Dladla appointed
Jun 17
Acting Eskom CEO
Koko suspended
Mar 17
Mmamoloko Nkhensani
Kubayi appointed
Energy Minister
20162017 2017 2018
Mar 16 Feb 18
Gas determination Jeff Radebe appointed
600 MW Energy Minister
WATER: MIR 2020RENEWABLE ENERGY: MIR 2021
Apr 16 Apr 18
Cross border coal Signing of 27 IPP projects
3 750 MW from BW 4 and BW 3.5
May 16 Aug 18
Signing of PPA BW 3.5 Release of IRP 2018: 8
May 16 100 MW gas/diesel
Solar parks 8 100 MW wind, 5 670
determination 1 500 MW MW solar, 2 400 MW
Aug 16
COGEN bids due distributed generation
Sep 16 End 18
Preferred bidders Power requirement for 2019
COGEN scheduled maintenance.
Oct 16 Coal and nuclear stations
UTILITY-SCALE
Two coal projects
announced 863 MW
Nov 16
Eskom CEO Brian
Molefe resigns
Dec 16
Imported hydro
determination 2 609 MW
03
Dec 16
15
Coal RFP issuedFigure 2: Continued... Dec 19 Feb 20
Medium-term Power Purchase DMRE, under revised Schedule 2 of the
Procurement (MTPPP) – Risk Electricity Act, enabled self-generation and
mitigation programme facilitating municipal generation under
“Distributed Generation”. Generation plant
Oct 19 may only require registration
Release of IRP 2019:
14 400 MW wind; 6 000 MW solar; Apr 20
1 860 MW nuclear; 3 000 MW gas/diesel; DBSA announced Tshifiwa
4 000 MW distributed generation Bernard Magoro as the new
head of the Independent
Jul 19 Power Producer Office (IPPO)
Advocate Sandra Coetzee replaces effective from 1 May
Karen Breytenbach as head of IPPO
2019 2020 2020
Jul 20
May 19
DMRE/IPPO developed and issued
DMRE publishes letter of
UTILITY-SCALE RENEWABLE ENERGY: MIR 2021
a refinancing protocol to ensure
deviation from IRP2010-30 for
a standardised approach to the
generation facilities ranging
preparation and assessment of all
above 1MW to 10MW
refinancing applications received
Aug 20
May 19 IPPO/ DMRE RFP issued for 2 000 MW
Gwede Mantashe appointed Risk Mitigation Independent Power
as Minister of Mineral Producers Programme (RMIPPPP)
Sep 20
Resources and Energy
DMRE signs off Section 4 Ministerial
determinations: 4 800 MW of wind;
2019 2 000 MW of solar; 3 000 MW of gas or
Coal plants scheduled diesel to power; 1 500 MW of new coal;
for shutdown and 513 MW of energy storage
maintenance Oct 20
DMRE gazettes amendments to
the Electricity Regulations on
Generation Capacity, enabling
municipalities in good financial
standing to buy or procure new
generation capacity under IRP
16Beyond these key milestones in the South African utility renewable energy market,
Table 2 below details additional drivers that have moved the market forward.
Table 2: Additional drivers in the South African renewable energy market
Date Movement
CSIR Energy Centre Report highlights the actual tariffs from REIPPPP and coal IPP, showing how cheap renewable energy builds
December 2016
have been.
Reason for not signing IPPs announced by the Minister of Energy — decreased growth below 2%, resulting in lower demand
January 2017
for electricity.
Western Cape High Court judgement nullifies the government’s nuclear agreements for failing to consult the public and undertake
April 2017 due processes. Minister of Energy decides to review all determinations after nuclear judgement. This is one of the main reasons for
no response on municipal section 34 requests.3
July 2017 City of Cape Town files court application to purchase from IPPs.
Public consultations for Atlantis Special Economic Zone (SEZ) for Green Technologies to inform best business practice frameworks for
Sep/Oct 2017
local manufacturing facilities keen to launch within the zone.
Launch of Atlantis SEZ for Green Technologies, with national Department of Trade, Industry and Competition (dtic) encouraging
Dec 2018
Greentech investment through incentives.
Department of Public Enterprises (DPE) announces official plan for the unbundling of Eskom into three separate entities,
WATER: MIR 2020RENEWABLE ENERGY: MIR 2021
October 2019
i.e. generation, transmission, and distribution, by 2021
The City of Cape Town has been in dispute with government and NERSA on whether it has the right to contract directly with IPPs since
August 2020 2015. The dispute was referred back to the parties in terms of section 41 of the Intergovernmental Relations Framework Act, 2005. All
efforts to settle the dispute in terms of Chapter 4 of the Act were unsuccessful
Industrial Policy Action Plan (2020); Focusing on the manufacturing aspects of the green economy, namely green industries and
2017/17 – 2019/20 industrial energy efficiency, and is aiming to support broad-based industrialisation, including more advanced manufacturing,
encouraging cleaner, lower-energy technologies and green jobs.
UTILITY-SCALE
3
A Section 34 request entails a request to the Minister of Energy to make a determination against the IRP for the procurement of energy generation as detailed under
section 34(1) of the Electricity Regulation Act 4 of 2006.
03
17Although renewable energy in the • Wind and solar energy are
South African context dates back competing on a levelised cost
to 1998 with the delivery of the of electricity basis with coal
1998 White Paper on Energy Policy, and nuclear.
it is still a relatively new market
in South Africa, with the first The biggest development
commercial utility projects coming and driver of the utility-scale
online in 2013. At the time of writing, renewable energy market in South
6 422 MW of renewable energy Africa was the establishment of
had been procured through the the REIPPPP in 2011.
Renewable Energy Independent
Power Producer Procurement 2.3. The Renewable Energy
Programme (REIPPPP), with Independent Power
4 276 MW generation capacity Producer Procurement
added to the national grid (IPPO Programme
2020). Since the first project
became operational in November Over the last two decades,
2013, 49 461 GWh of energy has the South African utility-scale
been generated by renewable renewable energy model evolved,
energy sources procured under with some refinements. These
the REIPPPP. include the IRP 2010-30, the
establishment of the IPP office,
The growth of SA’s renewable and ultimate cancellation of the
UTILITY-SCALE RENEWABLE ENERGY: MIR 2021
energy industry in recent years is renewable energy feed-in-tariff
the result of several factors: (REFIT) programme. Key policy
movements are summarised in
• Proactive government Table 3 on page 19.
policy in procuring renewable
energy capacity;
• Increases in electricity tariffs
charged by the national
utility, Eskom;
Assembling a wind turbine at
Perdekraal, Western Cape.
©Mainstream Renewable Power
18Table 3: Key policy movements in the establishment of the renewable energy sector in SA
Market
Initiation Transition Consolidation
Development
Pivotal RE policy uncertainty Programme Bid Window 1-2 [nascent market Bid Window 3-4 [competitive market]
movements development – high returns]
Timeline 1998 – 2008 2009 – 2010 2011 – 2013 2014 – present
1998 White Paper on Energy 2009 – Renewable 2011 – Department of Mineral Resources Nuclear debate
energy feed-in-tariff and Energy (DMRE)5 abandons REFIT for
(REFIT) 4 phase 2 the competitive tender process
launched by NERSA
2003 White Paper on RE 2009 – COP 15 2011 – 1st determination: 3 725 MW Delay in Bid Window 4 (BW4)
commitments announcement – job losses as a result
2007/08 load shedding IRP 2010 – 2030 Aug 2011 – Issue of REIPPPP RFP April 2018 – Sign BW4
2008 – REFIT draft guidelines issued by 2010 – Establishment Nov 2011 – Bid submission period August 2018 – Updated IRP released for
NERSA of IPP office public comment
Government 2008 – Eskom solar hot water rebate – Dec 2011 – Preferred bidder announcement October 2019 updated IRP released
programme
2008 – Energy Act enacted – 11 Dec 2011 – COP 17 in Durban 2020:
• Determination based in new IRP
WATER: MIR 2020RENEWABLE ENERGY: MIR 2021
• Issue of RMIPPPP RFP (2 000 MW)
2008 – Commissioning of Darling Wind – 2012 – 2nd determination – 3 200 MW Expected in 2021/22:
Farm • Bid Window 5 announcement
• Issue of REIPPPP RFP
– – Nov 2012 – Signing of PPA BW1 • Bid submission
• The signing of PPA BW5
– – May 2013 – Signing of PPA BW2 • BW 5 commissioning
UTILITY-SCALE
4
REFIT (renewable energy feed-in tariff) programme was a renewable energy programme launched by NERSA in 2009, which was later revised (with developers, lawyers and funders input)
to the REIPPPP, launched in 2011.
5
Previously refered to as the Department of Energy (DOE)
03
19The major goal with the by Eskom, the programme had to Department of Energy (DoE) (now the Independent Power Producer
establishment of a renewable have a clear separation of powers. DMRE) (see Figure 3), National (IPP) office.
energy programme was to Treasury (NT), and the Development
ensure fair competition and Central to South Africa’s renewable Bank of Southern Africa (DBSA) in In 2016, the MoA was extended
independence, free from undue energy programme was the 2010. A memorandum of agreement for a further three years, and
influence. With all previous establishment of the Independent (MoA) was concluded between the then again in April 2019 for
generation, transmission, and Power Producer Procurement parties, and the DBSA was directed another year. The MoA has been
share of distribution managed Programme (IPPPP) by the former to support the establishment of subsequently extended to 2023.
Figure 3: Governance structure of IPPO6
Integrated
Energy Plan & Integrated
Resource Plan
Guiding
documents National Treasury
Concurrence Department of Memorandum Development Bank
NERSA of Agreement
given by Nersa Mineral Resources and Energy of Southern Africa
UTILITY-SCALE RENEWABLE ENERGY: MIR 2021
Draft Mandate to
determination Minister of Mineral Independent
IPP office
to Nersa Resources and Energy to procure
Power Producer Office
6
DoE (Department of Energy) is now known as the Department of Mineral Resources and Energy (DMRE), established in June 2019 as a merger between the Department of Energy
20
and Department of Mineral ResourcesThe IPP office is housed in the The office is now funded from IPP Advisory Centre, manages the IPP The formation of the IPP Office’s
DBSA. It oversees staff, operations, project fees. office account. National Treasury procurement process, Figure 4,
and procurement of consultants, also provides a guarantee to back has been lauded as one of the key
goods and services. Initial The office is an agent of the DMRE the obligations of Eskom in terms elements to driving success.
funding was provided as a loan and is mandated to implement the of the Power Purchase Agreements
recoverable once an IPP project IPPPP, whilst National Treasury, (PPAs) with the IPPs.
reached its financial close stage. through the Government Technical
Figure 4: IPPO procurement process
RFP Preferred Grid
Bid Financial connection +
(request for bidder
submissions close commercial
proposals) announcement
operation
Wind turbine construction
at GRI, Atlantis.
WATER: MIR 2020RENEWABLE ENERGY: MIR 2021
©GreenCape
UTILITY-SCALE
03
21South Africa’s renewable energy
REIPPPP highlights to date: Energy supply capacity impact The economic impacts of the
market grew exponentially from
• In the Large REIPPPP, 92 of the REIPPPP (by June 2020): REIPPPP have included the
the inauguration of the
projects have reached Financial • 6 422 MW of electricity had following (IPPO 2020):
Independent Power Producers
Close. Construction has not been procured from 112 RE • Investment (equity and debt)
Office (IPPO) in 2010 until 2015 when
yet commenced on one BW3.5 Independent Power Producers to the value of R209.7 billion, of
delays slowed market growth.
project that reached Financial (IPPs) in seven bid rounds. which R41.8 billion (20%) is foreign
Close by end July 2019. • 4 276 MW of electricity investment, was attracted;
Up until 2015, the IPPO, with the
• One BW4 project started generation capacity from 68 • Created 52 603 job years1 for
support of the Department of
operations in the second quarter IPP projects has been connected South African citizens to date;
Mineral Resources and Energy
of 2020, bringing the total to four to the national grid. • Socio-economic development
(DMRE), has procured 6 422 MW
(out of 26) BW4 projects that • 49 461 GWh of energy has been contributions of R1.2 billion
of renewable energy generation
have reached Financial Close. generated by renewable energy to date;
IPPO 2019). This has been managed
• The Smalls programme sources procured under the • Enterprise development
through seven bid windows (BW)7
and future bid windows are REIPPPP since the first project contributions of R384.2 million
in the large-scale REIPPPP, and
currently on hold, pending became operational to date; and
through two bid rounds in the small
the implementation of in November 2013. • Carbon emission reductions1
REIPPPP. At the utility scale, IPPs
the IRP 2019 and NERSA’s of 50.2 Mton CO2 have been
are the mechanism through which
concurrence of the associated realised by the programme
renewable energy is currently
ministerial determinations. from inception to date.
added to the SA energy mix.
In the Western Cape, the IPPO
reports that there are 14 utility capacity, of which 452 MW (11% • Active: Onshore wind (452 MW)
scale renewable energy projects • 606 MW of renewable energy of national total) is operational, and solar PV (134 MW);
UTILITY-SCALE RENEWABLE ENERGY: MIR 2021
that have reached commercial contracted in the Western Cape; with 6 047 GWh (12% of national
operation date (COD) in the • 452 MW operational from 10 total) electricity generated • Operational8: Onshore wind (318
province between November 2013 projects; since inception. The technology MW) and solar PV (134 MW).
and June 2020 (IPPO, 2020). • 467 MW is onshore wind; and breakdown allocations are
• 134 MW of solar. as follows: These projects have attracted
According to the IPPO, The approximately R15.0 billion worth
Western Cape has been allocated The Western Cape accounts • Procured: Onshore wind (452 of investment and created more
9% of total IPPPP projects for 606 MW (9%) of the national MW), solar PV (134 MW), and than 11 000 job years in the
procured in SA to date: procured renewable energy biomass (5 MW); province (IPPO 2020).
7
Bid windows 1, 2, 3, 3.5, 4 and smalls BW1 (1S2) and BW2 (2S2).
8
Operational refers to capacity of projects that have reached COD and excludes projects in Early Operations Period (EOP)
22Table 4: The 2020 breakdown of the large-scale and small-scale REIPPPP procured, determined, and operational capacity allocations across all
renewable energy technologies (IPPO June 2020, NERSA determination)
Programmes Large-scale IPP Small-scale IPP
Technology Procured Operational Determined to date Procured Operational Determined
Wind 3 357 1 980 11 160 9 0 400
Solar PV 2 292 1 774 8 225 80
Concentrated solar 600 500 1 200 0
power
Landfill gas 13 22 540 0
Small hydro 19 0
Biomass 42 10
Energy Storage - - 513 – – –
Total 6 323 4 276 21 638 99 0 400
WATER: MIR 2020RENEWABLE ENERGY: MIR 2021
2.4. South Africa utility- The market presents both The REIPPPP has attracted The REIPPPP has attracted
scale renewable energy current and future opportunities investment from prominent investment (equity and debt) to
market size for investors. global renewable energy project the value of R209.7 billion, with
developers and Tier 1 component foreign investment constituting
The South African utility-scale 2.4.1. The current South Africa manufacturers. It has done so R41.8 billion (20%) of total
renewable energy market has utility-scale renewable energy because of the growth potential, investment attracted into SA.
grown significantly over the last market size localisation requirements, the Some of the main contributing
seven years since the first project programme’s transparency, and countries are Germany, France,
UTILITY-SCALE
came online. strong government support. Italy, Spain, and the USA.
03
232.4.2. The economic value of R4 billion more in financial benefits 2.4.3. Investments made to date R41.8 billion) investments. The
renewable energy facilities than their cost. As projects programme has been successful
from more recent rounds of the Total investments made in the not only in attracting investments
A Council for Scientific and programme come online, the programme (debt and equity) over but also in attracting them from a
Industrial Research (CSIR) study installed capacity and financial the procured bidding windows, wide variety of investment sources
(CSIR 2015) demonstrates that benefits realised will continue to excluding the expedited round, (see Figure 5.).
between January and June 2015, increase as these projects offer totalled more than R209.7 billion
REIPPPP projects with some 800 much lower tariffs and costs than as of June 2020 (IPP Office). This
MWp and 1 GWp of wind and solar their predecessors (see Table 5). is split between domestic (80%,
PV respectively, generated up to R167.9 billion) and foreign (20%,
Table 5: Tariffs offered by solar PV, wind, and CSP projects over bid windows [R/kWh]
Programmes Large IPP Small-scale IPP
Rounds Round 1 Round 2 Round 3 Round 3.5 Round 4 a, b Expedited S1 S2
(AVG R/kWh)
Wind 1.51 1.19 0.87 – 0.75 0.62 1.15 –
Solar PV 3.65 2.18 1.17 – 0.91 0.62 1.22 1.01
Concentrated 3.55 3.32 1.93 1.8 – – – –
UTILITY-SCALE RENEWABLE ENERGY: MIR 2021
solar power
Landfill gas – – 1.11 – – – – –
Small hydro – 1.36 – – 1.24 – – –
Biomass – – 1.65 – 1.61 – 1.65 –
24Figure 5: Countries from which private investments in the REIPPPP were made (GreenCape, IPPO 2020)
USA 5 617 547
Great Britain + Europe 5 167 18 546
128
Asia (China, Japan, Singapore) 8 014
814
Middle East
1 812
(Saudi Arabia, India
1 377
Africa 265
– 5 000 10 000 15 000 20 000 25 000
DEBT (R MILLIONS) EQUITY (R MILLIONS)
Allocations of generation
capacity: Table 6 presents final
capacities per round, including
WATER: MIR 2020RENEWABLE ENERGY: MIR 2021
the small IPP programme. As the
table shows, wind and solar PV
are the dominant technologies
in terms of actual capacity
procured. Future rounds of the
programme will have to adjust
their allocated technology
because of favourable bid
UTILITY-SCALE
prices as well as high (over-)
subscription rates.
Hopefield Wind Farm,
Western Cape.
©GreenCape
03
25Table 6: Actual procured generation capacities per REIPPPP bid window9 (IPPO, June 2020)
Programmes Large-scale IPP Small-scale IPP
Rounds Round 1 Round 2 Round 3 Round 3.5 Round 4 a,b S1 S2
Wind 649 559 787 0 1 363 9 0
Solar PV 627 417 435 0 813 30 50
Concentrated 150 50 200 200 0 0 0
solar power
Landfill gas 0 0 13 0 0 0 0
Small hydro 0 14 0 0 5 0 0
Biomass 0 0 17 0 25 10 0
In the large-scale REIPPPP, 91 pending a determination by the 2006 (ERA) allows the Minister of
of the 92 projects have reached Minister of Mineral Resources and The South African Mineral Resources and Energy, in
financial close. There is one BW3 Energy based on the IRP 2019. utility scale market consultation with NERSA, to make
project that has not reached 2020-2030 Ministerial Determinations for
financial close. The remaining BW 2.4.4. The integrated new generation capacity if they
UTILITY-SCALE RENEWABLE ENERGY: MIR 2021
3.5 project that reached financial resource plan The 2019 Integrated believe that it is required to secure
close by the end of July 2019 has Resource Plan provides continued, uninterrupted supply
not commenced construction. One The Integrated Resource Plan direction on how South Africa of electricity. The Ministerial
BW 4 project started operations (IRP) is a national government plans to meet its electricity Determinations may also outline
in the second quarter of 2020, document that aims to provide a demand over the next 10 years. the type of energy sources
bringing the total to four (out of 26) clear indication of South Africa’s This can give an investor a from which electricity must be
BW 4 projects that have reached electricity demand, how this good indication of the potential generated. These decisions are
financial close. The small-scale demand will be supplied, and at market that will exist and that based on the most up-to-date
programme and associated future what cost. Section 34(1)(a) of the can be accessed. Integrated Resource Plan.
bid windows are currently on hold, Electricity Regulation Act 4 of
9
Determinations were made for 6 bid windows – 1, 2, 3, 3a, 4 and the expedited round. Energy has only been procured from 4 bid windows – 1, 2, 3 and 4
26In May 2011, the then Department and demand scenarios in South Under the Eskom build Key assumptions that changed
of Energy (DoE) – now the DMRE– Africa. Since the promulgation programme, the following capacity include the electricity demand
released the Integrated Resource of IRP 2010–2030, the following has been commissioned: 1 332 MW projection (decreased by 0.6%
Plan 2010-2030 (IRP 2010) in capacity developments have of Ingula pumped storage, 1 588 since 2010), Eskom’s existing plant
respect of South Africa’s forecast taken place: MW of coal (Medupi), 800 MW of performance (ranging between
energy demand for the 20 years coal (Kusile) and 100 MW of wind 68% and 72% in 2020), and new
from 2010 to 2030. The IRP 2010 As indicated in the preceding (Sere Wind Farm). In total, 18 000 technology costs. Since 2010,
was intended to be a ‘living plan’ section, a total of 6 422 MW under MW of new generation capacity there have been several draft
that would be reviewed by key the REIPPPP has been procured, has been committed revisions of the IRP that have been
stakeholders at least every two with 4 276 MW operational and to. Besides capacity additions, distributed for public comment as
years. However, this was never made available to the grid. Also, several assumptions have tabulated in Table 7 on page 28.
done and resulted in an energy IPPs have commissioned 1 005 MW changed since the promulgation
mix that failed to adequately meet from two open cycle gas turbine of IRP 2010–2030.
the constantly changing supply (OCGT) peaking plants.
WATER: MIR 2020RENEWABLE ENERGY: MIR 2021
UTILITY-SCALE
Wind turbine base construction
at Perdekraal East Windfarm.
©Mainstream Renewable Power
03
27Table 7: Summary of the developments and revisions of South Africa’s IRP from 2010 – 2019, as well as key planning assumptions (Wright & Calitz, 2020).
IRP 2010 – 2030 IRP Update 2013 Draft IRP 2016 Draft IRP 2018 IRP 2019 (Gazetted
(Promulgated 2011) (Not promulgated) (Public consultation) (August 2018) October 2019)
Target: 2010 – 2030 Target: 2013 – 2050 Target: 2016 – 2050 Target: 2016 – 2030 Target: 2018 – 2030
Expected energy mix Scenario-based Big: Coal, Decision trees; Big: Coal, Scenario-based Big: Coal Scenario-based Big: Coal, Scenario-based; Big: Coal,
nuclear Medium: VRE, gas nuclear Medium: VRE, gas, Medium: Nuclear, Gas, VRE VRE Medium: Gas Small: VRE Medium: Gas, DG/EG
Small: Imports (hydro) CSP Small: Imports (hydro, Small: Imports (hydro), Nuclear, DG/EG imports Small: Nuclear, Imports
coal), others others (hydro), others (hydro), Storage, others
Demand 454 TWh (2030) 409 TWh (2030) 350 TWh (2030) 313 TWh (2030) 307 TWh (2030)
522 TWh (2050) 527 TWh (2050) 392 TWh (2050) 382 TWh (2050)
Emissions (CO2 eq) Peak only, EM1 PPD (Moderate) PPD (Moderate) PPD (Moderate) PPD (Moderate)
(275 Mt from 2025)
Nuclear options Commit to 9.6 GW Delay option (2025 – 2035) No new nuclear pre-2030; No new nuclear pre-2030; No new nuclear pre-2030;
1st units (2037) (pace/scale/affordability) (pace/scale/affordability)
1st units (2036 – 2037) 2.5 GW (≥2030)
Import options Coal, hydro/PS, gas (fuel) Coal, hydro/PS, gas (fuel) Hydro, gas (fuel) Hydro, gas (fuel) Hydro, gas (fuel)
Coal fleet performance >85% EAF; 50-year ~80% EAF; 72 – 80% EAF; 50-year 72 – 80%; 50-year decom. 67 – 76%; 50-year decom.
decommissioning. Life Expectancy – 10 years decommissioning. MES delay (2020/25) MES delay (2020/25)
MES delay (2020/25)
New-build coal 1st units forced earlier Displaced by LifeEx 1st 1.5 GW (2028) 0.5 GW (2023) 0.75 GW (2023)
1.0 GW (2014) 6.3 GW (2030) (10 yrs) 1.0 GW (2025) 4.3 GW (2030) 1.0 GW (2030) 1.5 GW (2030)
UTILITY-SCALE RENEWABLE ENERGY: MIR 2021You can also read