How to find areas that will double in value in just 3 years - as feature in magazine
←
→
Page content transcription
If your browser does not render page correctly, please read the page content below
How to find areas
that will double in
value in just 3 years
as feature in            magazine &
www.yourinvestmentpropertymag.com.au

                                       www.yipmag.com.au
Invest | where to buy for profit Invest | where to buy for profit
Spotting the next growth area before
everybody else would put you in the best
position to buy low and ride the impending Equity is what
boom. Property investor and author Jeremy makes properties
Sheppard shows how to find areas that will triple positively geared
the national average in under three years
A positively-geared portfolio keeps
T
here’s an overwhelming amount of a bridge across a river is a fundamental lenders happy and eventually is what
information for property investors research finding. The vacancy rate on you need to retire on. But positively-
to sift through when choosing the the other hand, is a statistic and also geared properties are hard to find.
next location to invest in. As everyone in considered technical. A 10% yield is about enough for a
the property game knows, it takes a lot Fundamental research is un- typical investor. You’ll probably need
of time to accumulate all that data and quantified and subjective. For example, to buy in a mining town to get that.
assess how relevant it is. How do you by how much will demand improve There are a few other options though:
bring it all together into a single decision once the bridge across the river has Buy and then renovate or develop
to buy in location XYZ? been built? Statistics, however, provide a to improve the yield
When looking for my next precise figure. For example, the vacancy Pay down the mortgage
investment property, I’ll follow a clearly rate is 2.1% which is better than 2.2%. Wait for rents to increase
defined procedure that I’ve developed Fundamental details about a suburb
and documented during the process of show the true nature of forces driving I didn’t mention buying properties
buying my 16 investment properties, potential growth but are time- with a high depreciation benefit
and in helping others find theirs. consuming to accumulate. Statistics like brand new apartments. That’s
My initial focus is on finding help you filter an enormous number of because you can’t retire on a portfolio
locations ripe for excellent short-term possibilities quickly but are subject to that is only cash-flow positive after
capital growth without foregoing decent anomalies in the data. tax. On the contrary, the more of
long-term growth. Both classes of research have their these you buy, the more income you
To supplement the growth I’ll also pros and cons so I use both and change must earn to claim the depreciation
look for opportunities within my target my focus depending on which phase of against. These are great to buy as
location to manufacture growth through research I’m in. early investments when you’re still in
renovation, subdivision and development There are four phases to my research a high tax bracket.
opportunities – maybe all three! process: You can buy a cash-flow positive
As for cash flow, I’m not after freakish Short-list. Filter 15,000+ Australian property right now, buying almost
yields like those found in pure mining suburbs down to a few dozen that anything, buying almost anywhere…
towns. I want to buy and relax, knowing have the most potential for growth. if you pay for it in cash. In fact, many
my investment will not be subject to the This phase is mostly a statistical properties could be positively geared
success of one industry. I want low- analysis task. if the loan-to-value ratio was only
risk, long-term options. I do, however, Compare. Perform detailed research 50%. The majority of investors with
acknowledge the importance of a good, of each potential suburb so the stand- positively-geared portfolios have low
fat yield, partly to ease mortgage stress out locations are highlighted. This is loan-to-value ratios. It is equity that
and please lenders, but more importantly largely a fundamental research task. makes most properties positively
as a pre-cursor of capital growth. My ID best streets. Determine the best geared. And equity comes fastest
procedure doesn’t prioritise the pursuit streets within your target markets in from adding value and, secondly,
of properties that will immediately be which to buy – fundamental research. from capital growth. Capital growth is
cash-flow positive. ID best properties. Determine crucial for cash flow. The same drivers
If you think cash flow is more the best properties within the best in the market that push property
important than growth, read the side box streets within the best suburbs – prices up push rents up, too.
titled, ‘Equity is what makes properties fundamental research. If you can find an area with
positively geared’ on this page. excellent potential for capital
Regardless of your strategy, I’m sure Phase 1: Short-list growth and supplement that
you’ll find something worthwhile in I use statistics to build a short-list of with renovation, or even better,
this procedure. Let’s put it to the test suburbs – a few dozen of them. If all development, within a couple of
right now and let me find your next the stats for a suburb are pointing in years of good growth, combined with
investment property for you. the right direction, then that’s a suburb adding value, you could go from an
I’ll want to do in-depth fundamental 80% LVR down to 50% paying very
The process research on. little off the mortgage in that time.
There are two classes of research: If I notice a location that has some Then you’ll have enough equity for
fundamental and technical (aka great fundamentals, I’ll check the stats the next project as well as good cash
statistical). For example, the building of to confirm its potential. For example, flow to service it.
www.yipmag.com.au
Invest | where to buy for profit
DSR Trend Red is a score < 14
50
Yellow is a score of 14–29
40
DSR Score
30 Green is a score > 30
20
10
Jannali Norlane
0 great potential. The DSR is a careful
Jan Feb mar Apr May Jun Jul Aug Sep Oct Nov Dec examination of many property statistics
2010 all combined into a single figure to gauge
the demand-to-supply ratio for a suburb.
the other day I read that Macarthur in All research you do comes back to The DSR score is made up of
Victoria is going to have the southern answering questions regarding supply eight variables explained below and,
hemisphere’s largest wind farm. So I and demand. So I use the Demand-to depending on how good or bad the
checked some stats. It had a population Supply-Ratio (DSR) score to quickly variable is, they are given a weight or
of 804 in 2006. If just 80 workers and easily identify suburbs with score. For example, if ‘Days on market’
come into town, that’s a 10% growth
in population! Unfortunately, the Areas with potential to triple the national average
amount of statistical data available was
a little light in terms of reliability and Post Dwelling type Typical DSR
State code Locality preference value Score
didn’t really point in the right direction
anyway. No problem, there’s thousands NSW 2226 Jannali Houses $476,000 42
more suburbs to choose from. VIC 3219 Newcomb Houses $260,500 39
To supplement my research, I use SA 5044 Somerton Park Units $177,500 35
Terry Ryder’s www.hotspotting.com.
TAS 7000 North Hobart Houses $302,500 34
au reports and Peter Koulizos’ (the
Property Professor) book Top Australian VIC 3216 Belmont Houses $308,500 36
Suburbs. Their focus on fundamental VIC 3218 Geelong West Units $208,500 35
research to uncover potential hot spots NSW 2176 Greenfield Park Houses $427,500 37
nicely complements my statistical
research. Residex’s recommendations are ACT 2615 Charnwood Houses $362,500 36
less detailed and more statistical. They TAS 7021 Lauderdale Houses $364,000 34
cover a wider number of suburbs which NSW 2763 Acacia Gardens Houses $489,000 38
is handy when you need to go back to
NSW 2516 Bulli Houses $477,250 35
the drawing board for more hot spots.
NSW 2077 Waitara Units $440,000 33
Statistics to short-list VIC 3215 Hamlyn Heights Houses $327,875 36
I’ve compiled a short-list detailed in the ACT 2603 Griffith Units $427,000 35
table on the right, and I’ll explain how I
NSW 2011 Rushcutters Bay Units $451,250 33
arrived at this list.
Prices move when there is an ACT 2904 Gowrie Houses $473,500 37
imbalance in supply and demand. End VIC 3116 Chirnside Park Houses $450,250 37
of story. Supply changes as the number NSW 2761 Glendenning Houses $343,750 33
of available dwellings change. Demand
changes when one or more of the VIC 3158 Upwey Houses $382,500 38
following change: SA 5163 Huntfield Heights Houses $252,500 33
The nature of the location changes. VIC 3214 Norlane Houses $194,250 34
For example, a new shopping centre
SA 5087 Klemzig Units $136,000 33
opens; a school closes down; prices go
up too much. SA 5091 Tea Tree Gully Houses $345,000 33
People change their mind about what NSW 2145 Wentworthville Units $325,000 35
they want. For example, as Baby SA 5039 Edwardstown Units $201,800 36
Boomers’ superannuation funds
NSW 2141 Berala Houses $457,500 33
recover from the GFC, they’ll finally
be able to retire. Their attitude about SA 5159 Happy Valley Houses $356,500 33
their current location will change as VIC 3912 Somerville Houses $411,250 34
proximity to work is no longer NSW 2233 Engadine Houses $437,875 38
a priority. Some will move out of
our cities. NSW 2018 Eastlakes Units $382,750 35
Source: www.dsrscore.com.au
www.yipmag.com.au
Invest | where to buy for profit

     or DOM is very good, it might be given                The table below shows an example                maximum score of 48. Perhaps the yield
     a weighting of, say, six out of six. If            of a poor DSR score:                               is high because of falling values – a trap
     it is very bad then it might be given a                                                               for yield-crazy investors.
                                                        Port Augusta, SA           DSR Score: 5
     weighting of two out of six.                                                                             There are a lot of variables that
                                                        Statistic            Benchmark         Value
         The totals given to each variable                                                                 make up the DSR and a lot of
     are added up out of a maximum of 48                Days on market                 92         235      calculations for each one too. That’s
     to get the DSR score. We then put the              Discount                      6%         11%       what makes the score so convenient – it
     suburb into one of three ‘buckets’ –               ACR                          65%         43%       combines multiple statistics into one
     green, yellow or red – depending on                Yield                      4.50%       4.63%       meaningful, objective figure. And
     their score.                                       SOM                           3%     19.33%        even better, as of this issue, hundreds
         Each of these buckets represent a              Online search DSR              26         2.9      of the top DSR suburbs around
     growth projection of 11%+, maximum                                                                    Australia are now published at the back
                                                        Vacancy                    3.25%     10.02%
     8% and maximum 4% respectively.                                                                       of this magazine.
                                                        Renters                   37.50%         43%
         Some of the simpler statistics                                                                       It’s possible to get the complete DSR
                                                                             Source: www.dsrscore.com.au
     considered in the DSR are explained in                                                                list Australia-wide (5,000+ DSR scores)
     the table on the right.                            There’s only one figure that is better             from www.dsrscore.com.au as well as
                                                        than the benchmark: yield. Port                    on the Your Investment Property website
     Understanding the scores                           Augusta’s housing market at the time of            www.yipmag.com.au. With the complete
     So, what is a good figure for ‘Days on             writing had a DSR of only five out of a            list you can sort and filter by some of
     market’? What is a low stock on market
     figure? Which is more important,                           DSR components explained
     vacancy rate or yield?
        The answers come with experience                Statistic           The meaning                             The ideal
     in the market and close examination of
     the data and its impact on capital growth.         1. DOM              Days on Market. This is the             The lower this figure, the
                                                                            number of days a property has           more quickly property is
     For example, see the make-up of the                                    been listed for sale.                   snapped up by buyers,
     DSR score for Charnwood, ACT. The                                                                              showing high demand.
     ‘Benchmark’ column will give you some
                                                        2. Discount         This is the percentage                  The lower this figure, the
     idea of what a good statistic is for the                               difference between the                  more demand there is since
     DSR components.                                                        original asking price requested         sellers don’t need to be as
        The DSR carefully considers each                                    by the seller and the eventual          open to negotiation in order
     figure and compares it to a range of                                   sale price agreed by the buyer.         to get their property sold.
     values: very poor, poor, below average,            3. ACR              Auction Clearance Rate. The             The higher this figure, the
     average, above average, good and very                                  percentage of auctioned                 more demand there is from
     good. And then each statistic’s rating is                              properties that actually sell.          buyers since fewer properties
     also calibrated and given a weighting                                                                          are passed in.
     based on its influence on capital growth.          4. Yield            The percentage of rental                The higher this figure, the
        The table below shows an example of                                 income to property value.               more demand there is from
     a good DSR score:                                                                                              renters to live in the location.

      Charnwood, ACT           DSR Score: 36            5. Vacancy          This is the percentage of               The lower this figure, the
                                                                            properties that are vacant.             lower the supply of rentable
      Statistic           Benchmark         Value                                                                   accommodation or the
      Days on market                92          35                                                                  higher the demand for it,
      Discount                      6%         4%                                                                   or both.
      ACR                         65%         93%       6. SOM %            Stock On Market. This is the            The lower this figure, the
      Yield                     4.50%       5.51%
                                                                            number of properties for sale           lower the supply of property
                                                                            as a percentage of properties           or the more demand for it,
      SOM                           3%      1.08%                           in the area.                            or both.
      Online search DSR             26         5.7
                                                        7. Renters          This is the proportion of               The lower this figure, the
      Vacancy                   3.25%       0.33%                           renters to owner-occupiers              less supply of rentable
      Renters                  37.50%         27%                           that live in a suburb.                  accommodation there is.
                          Source: www.dsrscore.com.au
                                                                                                                    Owner-occupiers tend to
                                                                                                                    take better care of their
     As you can see there is only one                                                                               properties than tenants
     component that is worse than the                                                                               and are usually of a higher
     benchmark: that’s the online search                                                                            income demographic.
     DSR. The online search DSR is a                    8. OSI              Online Search Interest. This is         The higher this figure, the
     comparison between the number of                                       the ratio of people searching           more demand for property
     people searching for property in a                                     for property online to the              compared to supply for
     specific location and the number of                                    number of properties for sale.          would-be buyers searching
                                                                                                                    online.
     properties for sale in that location.
                                                                                                                                 www.yipmag.com.au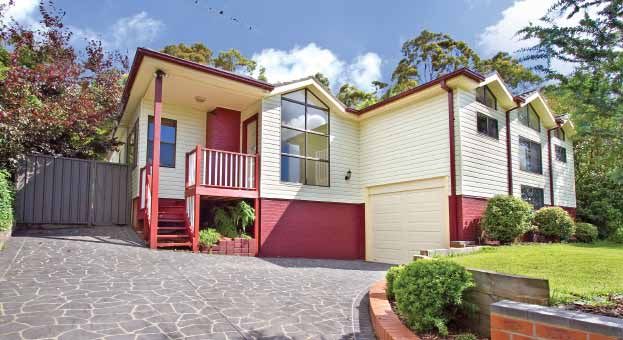
Invest | where to buy for profit
Norlane sales cycle over time Jannali sales cycle over time
Nov 2000 to Nov 2010 Nov 2000 to Nov 2010
250 $250,000 250 $700,000
Num sales (12 months) House median price Num sales (12 months) House median price
Unit median price $600,000
200 $200,000 200
Num sales (12 months)
Num sales (12 months)
$500,000
150 $150,000 150 $400,000
100 $100,000 100 $300,000
$200,000
50 $50,000 50
$100,000
0 $0 0 $0
Nov 00
Nov 00
Nov 04
Nov 04
Nov 06
Nov 06
Nov 08
Nov 08
Nov 09
Nov 09
Nov 05
Nov 05
Nov 03
Nov 03
Nov 02
Nov 07
Nov 02
Nov 07
Nov 01
Nov 01
Nov 10
Nov 10
Source: rpdata.com Source: rpdata.com
the other variables like price or yield. I’ve also given greater preference to the typical value mentioned in the stats.
When calculating the DSR, not all data is suburbs whose DSR appears to be on This may affect the assumptions we
available. What’s more, some of the data the rise. Prices will still rise if the DSR made about affordability and yield.
is not accurate. In creating my short-list is falling so long as the DSR is still high. You can use www.domain.com.au
I weeded out all suburbs with a statistical Remember that the DSR represents or www.realestate.com.au to check the
reliability that wasn’t well above average. an imbalance in the market right now. properties for sale. Sort them by price
I’ve also used other novel The trend just gives some idea of the and see if there is a significant difference
statistics along with the DSR to longevity of potential future growth. between the stats and the asking prices.
identify imbalanced markets ripe for See the DSR Trend chart for Jannali and A significant difference would be
capital growth. I used these to further Norlane above. around 7% or more. Keep in mind that
filter and order my short-list. That’s The top 30 suburbs I picked asking prices are almost always above
why the suburbs aren’t ordered by contained three suburbs within the actual sale prices.
DSR and why some only have a score Sutherland Shire in Sydney. But there You should do the same for properties
of 33. Some of the extra statistics I’ve were plenty more that I could’ve for rent. Usually the median price
used include: included. I don’t know much about quoted is well below the lowest price
Sutherland, but clearly something is of any property currently for sale.
Unit-to-House price ratio (U2H). going on in ‘The Shire’. Similarly, rents are higher than anything
This is a comparison of unit prices to Please don’t base your entire currently for rent. So make sure you
house prices. Beware that an effective investment decision purely on these check the stats.
use for this statistic needs to consider the stats. They act as a filter to identify Based on the available data, it looks
average block size. suburbs where you can start your like the typical value for Jannali houses
fundamental research. The next section in the statistics is a little lower than the
Ripple Effect Potential (REP). explains some of the steps involved in asking prices currently. This is even
This is a figure to identify suburbs fundamental research. when considering a decent discount.
that are cheap compared with their This means we need to adjust our yield
neighbours, or suburbs that have not Phase 2: Comparing short-listed for Jannali. Norlane prices are about
experienced the recent growth their locations right, both in yield and value.
neighbours have … yet. The next step after getting a short-list Check the vacancy rate, too, by getting
is to conduct fundamental research on a count of the number of properties for
Market Cycle Timing (MCT). each one to compare them. I’ll only rent. If there are dozens of properties
Growth happens in short spurts followed research Jannali in NSW and Norlane for rent in a small suburb, but your stats
by longer flat periods. This statistic in Victoria to illustrate the process. (In are telling you vacancy is very low, then
helps identify suburbs that have had an finding my next investment I’d research clearly your stats are wrong.
extended flat period versus those that more than just these two, but there You can check stock on market
have already had excellent recent growth. simply isn’t enough room in this article.) by getting a count of the number of
See the growth charts for Jannali and properties for sale. Keep in mind that
Norlane.
As you can see, both suburbs have
had relatively flat house prices from
1 Stats check
The first thing to do is perform a
quick check of the statistics. Note that in
a large market will always have dozens
of properties for sale. So check the
population to accurately compare.
about 2004 to 2008. But both are thinly traded markets it’s very difficult to Be sure in all these online searches
starting to trend upwards now. accurately determine a typical value. So that you don’t include surrounding
Affordability itself can identify a market. see if the typical asking price
So I’ve filtered out the suburbs from of properties for sale
my short-list with typical values matches
above $500,000.
www.yipmag.com.au
Invest | where to buy for profit
3 Background check
You can easily find out the basics of
a suburb by doing some ‘Googling’ or
using Wikipedia. Here’s what I found:
Jannali
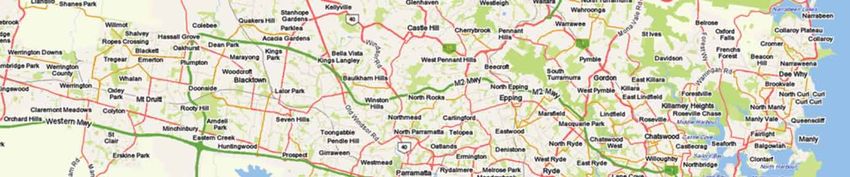
Sydney suburb Jannali is around
22km south of the CBD, in the
Sutherland Shire. Transport-wise,
it is one of the best-placed suburbs
in the area with its own rail station and
regular direct trains to the city, and
regular bus services link Jannali
to surrounding suburbs.
Sutherland Shire As well as offering good transport
links to Sydney, Jannali is also within
easy reach of Wollongong. Admittedly,
See if the typical asking price of the southern satellite city is a little more
than twice the distance from Jannali
properties matches the typical value as is the Sydney CBD, but the lower
flow of traffic moving southwards –
mentioned in the stats. This may affect and the presence of a rail link – makes
Wollongong commutable.
the assumptions made about affordability It’s also got a reputation as a ‘nature
haven’. The suburb is surrounded by
suburbs and that you select the correct insurance is applicable. You should also bushland and has access to the Georges
dwelling type: either house or unit. check that you can comfortably borrow River, a major waterway. There are also
enough money to buy a typical property a number of parks and sporting areas as
2 Finance check
It’s a terrible waste of time to spend
hours performing in-depth research on a
in this location.
Short-listing is an iterative process.
After researching each location on
well as boat ramps.
The geographical constraints of the
Sutherland Shire and Jannali’s location
little town you believe is a hot spot only the short-list more thoroughly with within it point to good capital growth
to discover you can’t get finance for that fundamental research in phase two, you in future. The Sutherland Shire is
location. So once you have your short- may decide that not enough of them are somewhat landlocked by water to the
list, make sure you check with your worthy of a visit. If that’s the case, go north, west and east, and the Royal
lender that the post code is acceptable. back to phase one and extend your short- National Park to the south, and the
This is especially true when mortgage list by another dozen suburbs. suburbs surrounding Jannali all feature
water views and bushland. This positions
20 suburbs with poor DSR scores Jannali as a potential beneficiary of
the ripple effect, as there is essentially
Post Typical DSR nowhere else to go on the eastern shore
State Suburb Type
code Value Summary
of the Woronora River. Indeed, original
QLD 4877 PORT DOUGLAS H $497,500 V poor older style homes are already making
SA 5710 PORT AUGUSTA H $191,000 V poor way for more modern residences as
WA 6285 MARGARET RIVER H $479,000 V poor the suburb becomes recognised for its
NSW 2627 JINDABYNE H $382,000 V poor transport links and lifestyle potential,
QLD 4804 COLLINSVILLE H $212,500 V poor
QLD 4677 AGNES WATER H $460,000 V poor and RP Data lists annual average growth
SA 5254 MURRAY BRIDGE H $228,900 V poor over the year leading up to November
SA 5453 CLARE H $310,500 V poor 2010 as a solid 11.98%.
NSW 2350 ARMIDALE U $264,000 V poor
NSW 2365 GUYRA H $898,750 V poor Norlane
TAS 7330 SMITHTON H $274,500 V poor Geelong suburb Norlane is just 6km
WA 6281 DUNSBOROUGH H $629,750 V poor north of the CBD and 60km from the
QLD 4212 HOPE ISLAND H $705,000 V poor centre of Melbourne.
QLD 4802 CANNONVALE H $447,500 V poor
Geelong, in general, has been
WA 6536 KALBARRI H $479,750 V poor
QLD 4879 PALM COVE U $304,250 V poor highlighted as one of Victoria’s areas to
QLD 4879 TRINITY BEACH H $410,000 V poor watch, due to large-scale redevelopment
NSW 2428 FORSTER U $330,000 V poor of the city centre, gentrification of inner
WA 6401 NORTHAM H $446,000 V poor suburbs and, most importantly, a high-
QLD 4810 TOWNSVILLE CITY U $545,500 V poor speed rail link to Melbourne that will
Source: www.dsrscore.com.au
www.yipmag.com.au
Invest | where to buy for profit

deliver you to Southern Cross station in
less than an hour. Norlane’s rail station,
North Shore, lies on this high-speed
link. Avalon airport is also within easy
reach of the suburb, and provides air
travel to most major east and south
coast destinations.
    Admittedly, Norlane has had a
somewhat chequered reputation in               Where to get $349,440
the past due to its housing commission
origins but it has shrugged this off
                                               capital growth in 3 years!
in recent years, at least partly thanks
to families buying their rental homes
                                               (TIP! Go south)
and extending or renovating – with             Jannali, NSW
resulting capital growth averaging 11%
per annum over the last two years,             This property below was listed online at the time of writing. It was
according to RP Data. Still, prices are        marketed as having a great investment potential. So we crunched the
                                               numbers to see if the top line analysis stacks up. These calculations
very reasonable, with the same data            are based on assumptions and the available information online.
provider recording median house prices
at just $186,000.                              Property on market
    Amenity-wise, one of Geelong’s two         • 3-bedroom house
water parks, Waterworld, is located in         • 1 bathroom
the north of Norlane, which features           • 1 car park
an Olympic-sized indoor swimming               • land area: 610m2
pool, a gymnasium, two water slides and
                                               • floor boards throughout the property
                                               • mostly flat block with grassed backyard
children’s pools. It’s within easy reach
of Corio Bay and North Shore Beach,            Price:................................................................................................ $480,000
and there are several boat ramps offering      Potential rent:........................................................................................$420
access to Port Phillip Bay. The suburb         Gross yields:........................................................................................ 4.55%
is served by several primary schools, a
secondary school and an Isik College           Assuming:
and primary school campus.                     Interest rate @7%
                                               Loan-to-value ratio (LVR) @80%
Get suburb profiles                            Loan amount:................................................................................. $384,000
Some of the well-known data providers          Deposit:............................................................................................. $96,000
have created suburb profiles for               Prediction of 20% pa occurs
investors. You can download a suburb
profile for free from www.myrp.com.            Property value in 2014:................................................................. $829,440
au that gives a nice little background to a
suburb. It has loads of demographic data       Costs over 3 years
which you may find of interest. The best       Loan repayments (7% interest only)............................................. $80,640
part though is the map.                        Miscellaneous expenses (1% of property value)..........................$14,400
   You can see from the map of Jannali         20% deposit..................................................................................... $96,000
that without even knowing the suburb,          Total costs........................................................................................$191,040
the streets between the park on the left
and the railway station on the right look      Rental income & capital growth over 3 years
ideal. A Google Earth fly-by and a visit       Rental income ($420 x 50 x 3) ........................................................ $63,000
to the location are required though to         Capital growth @20% pa.............................................................. $349,440
confirm this.                                  Total................................................................................................. $412,440
   Google Maps are pretty good too. You        Less total costs................................................................................$191,040
can zoom out to see where the location
lies within its city and state. You can also
                                               POTENTIAL PROFIT.................................................... $221,400
switch to satellite view to see if reserves
are ovals, bushland or ‘wasteland’.
                                               Please note that all important due diligence discussed earlier in the article hasn’t been

4
                                               conducted. These calculations are based on a series of assumptions and approximations,
    Businesses in the area
                                               and are for illustrative purposes only. As it is not possible to accurately predict economic
    The Yellow Pages can be used to find       changes to interest rates, inflation and other indicators, or the manner in which individu-
where various businesses are. You might        als will conduct their personal financial affairs, it is impossible to determine the exact
also like to try entering search terms like    outcome of the investment. As such, readers should obtain their own investment advice
‘supermarkets’ and use Google to find          from a suitably qualified expert before undertaking any investment.

www.yipmag.com.au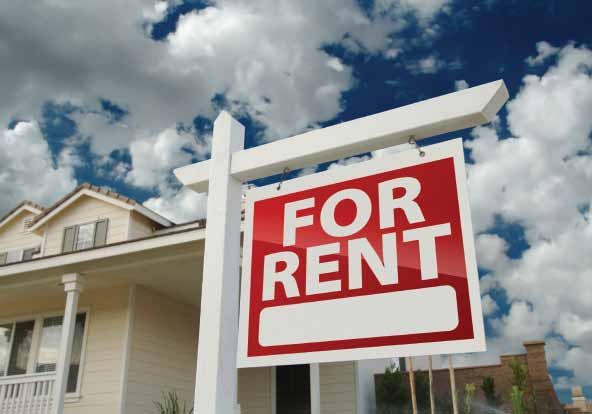
What’s on market?
Invest | where to buy for profit
bus routes. Walk Score (www.walkscore.
com) is also a great resource for finding
the sort of information below:
Jannali has eight restaurants, seven
Norlane, VIC cafés, six schools, 16 parks (covering
16% of the suburb), eight pubs, seven
banks and about 20 shops.
Norlane has eight restaurants, eight
cafés, six schools, 11 parks (covering
9% of the suburb), eight pubs, seven
banks and 10 shops.
Property 1
125 Novara Crescent, Jannali
5 Demographics
Free demographic data is
available from SQM Research
Listed price: $599,000 (www.sqmresearch.com.au) as
Rent: $650 per week well as www.domain.com.au and
Features: www.realestate.com.au.
• 4 bedrooms, 2 living areas On the opposite page is a sample of
• includes a garden shed a demographic report that would help
• room for trailer or boat your research.
As you can see, there are very few
• single lock up garage
units in Norlane (postcode 3214). This
• close to schools, train station
may represent an opportunity if you
and shops
can verify that the demographic want
to live in units. Check the population.
Agent: David Adron, Ray White If it’s a rural town and the population is
Sylvania/Jannali 0403937787 less than 5,000, your research needs to
be very diligent. There is lesser margin
for error in small towns. Simply having
a small location means data about it can
be scarce. However, these will have the
most potential for phenomenal growth.
It’s unlikely, at this stage, that the
suburb profiles will reveal anything
tremendously good or bad about a
suburb. But if something does pop up,
don’t feel like you have to finish your
in-depth research. There are thousands
of suburbs, so cull whenever you can to
save time.
6 Agent feedback
You should contact agents in the area
Property 2 and find out why the demand and supply
are out of balance.
Kagoola Court, Norlane
Jannali
Listed price: $175,000+
According to Greg Calderwood of
Rental: $200 per week
Sanders Property Agents the strong
Features:
capital gains projections for Jannali can
• spacious living area be attributed to the shortage of land for
• gas log heater further densification or development.
• combined kitchen and dining As a result of the undersupply and a
• large secure backyard, approx growing population, as many as 30
562m2 groups attend rental property inspections
• tenant in place until 23/11/2011 with properties being snapped up the
paying $200 per week same weekend.
Agent: Natalie Collier, Ray White He says there are known cases of
Corio, phone: 1300 308 831 auction bidding from tenants desperate
www.yipmag.com.au
Invest | where to buy for profit
to secure a property. This is in contrast
with $50 per week rent discounts being Age group of population
offered as little as five years ago. He
confirmed that there is strong demand
across all property types, from one bed
apartments to family homes renting for
3214 Greater Geelong LGA
$850 per week or more. With regards 40 to 59 - 26.1% 40 to 59 - 27.3%
to the vacancy rate of 0.9%, Sanders 20 to 39 - 25.5% 20 to 39 - 25%
Property manages 440 properties with 5 to 19 - 22.6% 5 to 19 - 21%
almost 0% vacancies across the portfolio. Other 25.7% Other 26.6%
So when the data suggests there is a
big imbalance between the availability
of property and the desire to live in Country of birth
Jannali due to its proximity to water and
transport to the city, and when our initial
fundamental research corroborates this,
Redwerks Research property experts
suggests it warrants your attention. 3214 Greater Geelong LGA
Australia - 72.3% Australia - 79.4%
United Kingdom - 5.2% United Kingdom - 5.1%
Norlane Croatia - 1.6% Italy - 0.9%
According to PRD Nationwide, there Other - 20.9% Other - 14.5%
are a number of reasons why demand
is outstripping supply in the Norlane
housing market:
There is keen interest from Dwelling structure
Melbourne investors
It is within close proximity to the
growing Heales Road industrial park
and another local industrial precinct 3214 Greater Geelong LGA
Separate House - 90.1% Separate House - 86.3%
which is great for local workers
Flat - 6.9% Flat - 8.3%
People who have been priced out of Semi/Terrace - 2.9% Semi/Terrace - 4.7%
the Melbourne market can commute Other - 0.2% Other - 0.7%
from Norlane
$10m announced in the state budget Source: Domain.com.au
for the Corio-Norlane Regeneration
Project, affecting schools in the area quickly, with a good return and more at $230 per week and we leased it straight
importantly good quality tenants. The away. “The rental prices have increased
PRD Nationwide-Lara (Vic) says that most popular properties would be three- in the area but this hasn’t slowed the
the Norlane market is a seller’s market. It bedroom houses under that $250 per rental market as there aren’t many areas
slowed up pre-Christmas, but is picking week range. We’ve just leased an as-new, left in Geelong that are affordable for a
up again. They expect at least 10% two-bedroom unit at $230 per week. The lot of families, so it’s keeping the market
growth for the coming year. “It really previous tenant had being paying $195 very active all-round for investors and
is a great market. Properties are leasing with another agent and we’ve advertised tenants,” says the agency.
www.yipmag.com.au
Invest | where to buy for profit
7 What locals say
The ninemsn website has some
comments made by locals and a rating.
8 Public spending
Public spending is the investment
the government is making on the
There is a similar score and comments suburb. This might include a widening
provided at: http://localvoices.realestate. of the rail line, a rejuvenation of local
com.au parks, etc. There are federal projects,
As you’ll see from the comparison state projects and local council projects
below, Jannali is loved by its residents that come under this umbrella.
and Norlane is a bit of a battle between The government website (www.
good and evil. Not knowing an area is
one of the biggest concerns for interstate
infrastructure.gov.au) and local council
websites are a great resource.
$
investors. See how these comments can So far, there was nothing to report
give you a general insight without even on regarding Jannali in terms of public
hearing of the suburb previously. spending. However, Norlane has a
couple of big projects going on:
What the locals say
Rejuvenation project
$10m will be spent on the education
rejuvenation project for Norlane. This
is not a huge amount of money, but project in the area as part of our ‘Investor
Jannali certainly something for a town with not Circle 100’ program.”
Comments by locals: much else going for it.
Norlane
“Great views on the east side. Close Armstrong Creek Large areas of land along the Princes
to the city and close to water, There is a large land release happening Highway have been allocated recently
beaches…” south of Geelong at Armstrong Creek. for commercial development and have
This will house an estimated 55,000 seen the large multi-national franchises
“Jannali is a great place to live. people. When combined with the operate in the area, such as all the
Nice and quiet with great access to Keystone Business Park in the same major fast food chains and the large
transport and the city. Nice, leafy region, there will be an anticipated thrifty stores.
atmosphere…” 22,000 jobs available.
http://finance.ninemsn.com.au
Rating: 8.5 out of 10. 9 Private spending
This includes development projects
10 Get the walk score
You can gauge the proximity
of facilities in a suburb by using www.
as small as a set of townhouses or as walkscore.com. It gives an overall score
http://www.rs.realestate.com.au large as a mine opening. Check the local out of 100 in terms of convenience.
Score: 96.82 out of 100. council website for any DAs and what Jannali has a walk score of 77 (http://
phase each project is at. www.walkscore.com/report/jannali-nsw).
Norlane Norlane has a walk score of 25 (http://
Comments by locals: Jannali www.walkscore.com/report/norlane-vic).
The Sutherland Shire Council has placed
“I had my car broken into and have a heavy emphasis on keeping as much Comparison conclusion
seen people trying to break into natural bushland as possible for the use At this point, we compare all the
shops…” and enjoyment of the residents. This localities we’ve researched. In our case,
means development in Jannali is very we’ve only researched two suburbs from
“Very affordable housing. One hour limited. The housing need for more the short-list. If none of the suburbs
to Melbourne, 7km to Geelong residences was addressed to some extent stand out, we may like to return to phase
city centre, beach, hospital, Deakin by a growth in dual occupancy dwellings one and extend our short-list.
waterfront campus. Accessible and some smaller medium residential Usually when you have dozens of
and reliable public transport. developments (8–10 townhouses). There suburbs it’s hard to pick between them.
Wonderful community spirit in are few high-density projects so this So I make up a spreadsheet, listing the
my street.” undersupply will continue to put upward pros and cons of each suburb. Then I
pressure on prices according to Michael give each ‘pro’ a positive figure out of 10.
http://finance.ninemsn.com.au Fuller, founder of Redwerks Research. This should reflect how well the suburb
Rating: 4.6 out of 10. “Agents in the area tell me small meets this positive attribute and how
residential townhouse projects in Jannali important the positive attribute is. For
http://localvoices.realestate. sell out off-the-plan almost immediately example, Jannali has a train line. That’s
com.au due to the demand/supply imbalance the a transport pro of at least seven. Then I
Score: 67.65 out of 100. DSR Score tells us. In fact, we will be give a negative to each ‘con’. For example,
looking to develop a small townhouse there is not much public or private
www.yipmag.com.auInvest | where to buy for profit
spending in Jannali. That’s a negative appreciated suburb of Sydney. Perhaps national factors affecting all housing,
of about eight. Add them up and you’ve the next few years will see it priced a such as the global economy, interest
got your fundamental research figure. little more fairly. However, there are no rate rises, changes to lending policies
This helps me maintain objectivity in new works nearing completion or even and government intervention such as
my appraisals and outlines clearly to a in the pipeline. There are no dramatic housing incentives, tax changes, etc. So
client or joint venture partner why I’ve drivers of growth apart from people it would be easier for me to say:
made my decision. realising Jannali is under-valued and Jannali will outperform the national
the strong tenant demand. I do believe average growth rate by 2.5 times
So where would I buy? Jannali will experience good capital over the next three years
Norlane has some positives despite growth, but I would return to my Norlane will outperform the
the stigma. If the affordability crisis short-list and research more suburbs to national average growth rate by 1.5
accelerates, there may be more see if they’re even better than Jannali. times over the next two years
pressure on homebuyers to settle for Further research of the remaining 28
what they can get. Given the projects Growth predictions suburbs in the short-list may uncover
about to take off in the area, there I would not be surprised if Jannali an even better opportunity. So go on
should be some short-term growth experienced 20% growth per annum and find it now you know how to.
in yields. Although these usually over the next two to three years.
pre-date capital growth, the long-term However, I would be surprised if Next steps
options for Norlane may not be that growth exceeded 30% for any one of Once you’ve found a target location
great with potentially better locations those years. set for capital growth, the next step is
being built at Armstrong Creek. I Despite the negative sentiment for familiarising yourself with the location
wouldn’t buy in Norlane. Not that I Norlane, I think there’ll be growth in to find where the best streets are. And
think it’s a no-go zone for investors, excess of 10% per annum for the next the final phase is to determine the best
but rather because I think there are 18 months at least. And I wouldn’t be properties.
better locations elsewhere. surprised if growth exceeded 20% for a
Jannali has a lot of excellent short period.
features. It truly is an under- These predictions haven’t considered
gOES DigiTAL!
interactive data that you
can sort the way you want
the latest property news
delivered instantly
exclusive iPad®-only
content & more
DOWNLOAD THE
iPad®APP FROM THE iTunes® STORE
www.yipmag.com.auInvest | researching hot spots
How to find areas that will
double in value
within 3 years
Finding the next growth hot spot involves
thorough understanding and closely part 1
monitoring the different variables
that affect price growth. This month,
L
ast month I introduced the
Jeremy Sheppard explains ‘demand to supply ratio’, or DSR
how to use ‘days on market’ stats score, which is a measure of the
to pin-point your next target, gap between demand and supply for
Australian property markets. The DSR
and analyses which score considers all sorts of property
growth drivers are statistics such as auction clearance rates,
vacancy, vendor discounting, yield
worth watching and so forth, and then comes up with
a summary figure representing the
imbalance of demand and supply for
any given suburb.
This month I start part one of
an eight-part series examining the
variables that make up the DSR score.
With a better understanding of what
each statistic means, you’ll be able to
examine your target suburb in a new
light and get your research off to a
flying start.
What is DOM?
‘Days on market’ data, or DOM for
short, is a count of the number of days
a property stays on the market before
it sells.
www.yipmag.com.auInvest | researching hot spots
A property is considered ‘on the
market’ as soon as the real estate agent
lists the property for sale. They’ll
usually do this by advertising on one
of the property search portals like
www.realestate.com.au. Once the
property has sold, the agent will remove
the listing from the property search
website. That time of advertising
represents the DOM. Statistical facts that should
be used with caution
Where do you get DOM data? Population growth
You can access this information from Migration data
a variety of sources including the RP Long-term growth stats
Data stats at the back of Your Investment Proposed developments
Property. RP Data tracks these listings Supply of dwellings
from online sources as well as from real
estate agents.
Websites such as www.domain.com.
au also keep track of when a listing was
first made and when the same listing A low DOM means there’s pressure on
was removed in order to measure the
number of days the property spent on prices to go up to rebalance the demand
the market. They then publish this
information on their website under to supply ratio. The lower the DOM, the
the Property Reports section. See the
box below for an example relating to
more potential for immediate capital growth
Beverley in South Australia. You can see
that houses take about 96 days to sell. of them to sell. That means the DOM A low DOM means there is pressure
figure will be high. on prices to go up to rebalance the
Why is the DOM important? So the DOM figure reflects the demand to supply ratio of the market.
In a hot market properties are snapped demand to supply ratio of a property The lower the DOM, the more
up quickly by eager buyers. Clearly, the market. Since supply and demand are potential there is for immediate
seller is able to get the price they want the only things affecting property capital growth.
without waiting too long. So a small prices, you can see that the DOM is an
DOM figure is a sign that demand is important statistic. Is the DOM reliable?
exceeding supply. It’s quite possible the agent is a little
Conversely, if there is no buyer How can investors use the DOM? tardy in removing the property from
interest in a particular suburb, Checking the DOM should be one of the website once it has sold. It’s also
properties will sit on the market for the first things you research as part of possible that properties are sold without
a long time. Even with strong buyer your due diligence. Given how quick even listing. A property may be listed
interest, if there are too many properties and easy it is you really have no excuse for some time with one agent and then
for sale, it will take a long time for all not to. the seller decides to use a different
agent and so the property is delisted and
relisted. Also, a sale may fall through,
Suburb profile page for Beverley SA resulting in the relisting of a property.
Property prices - 12 months to December 2010 These circumstances can muck with
HOUSES UNITS the figures a bit. But they’re generally
LGA LGA infrequent and can sometimes balance
Beverley Beverley each other out anyway.
Charles Sturt Charles Sturt
Median Prices $380,000 $380,000 SNR $310,000 If you can find a market with more
than a handful of sales per quarter then
long Term Trend 10.9% 11.4% SNR 11.7%
it’s likely the DOM figure is reliable.
Auction Clearance Rates 100% 58.6% SNR 72.7% For example, the DOM for units in
Days on Market SNR 96 days SNR 83 days Beverley SA was 83. But only one unit
Discounting SNR 6.2% SNR 5.3% had sold in the last 12 months. So I
wouldn’t rely on that DOM figure.
SNR - Statistically Not Reliable
*Based on sales reported to Australian Property monitors You must not make investment
LGA = Local Government Area Source: www.domain.com.au
decisions based purely on statistics and
www.yipmag.com.au 49Invest | researching hot spots
Top 10 suburbs in Australia, by lowest DOM
State Postcode Suburb Type DOM
NSW 2113 MACQUARIE PARK House 20
NSW 2232 KIRRAWEE Unit 21
NSW 2046 RUSSELL LEA Unit 21
ACT 2604 NARRABUNDAH House 21
NSW 2068 WILLOUGHBY Unit 21
NSW 2096 FRESHWATER Unit 22
NSW 2232 LOFTUS House 23
VIC 3188 HAMPTON EAST House 24
NSW 2137 NORTH STRATHFIELD Unit 24
ACT 2603 GRIFFITH House 24
definitely not on a single stat
Source: DSRscore.com.au, Feb 2011
like the DOM. There are loads of
other statistics you can use. We’ll Bottom 10 suburbs in Australia, by highest DOM
look into them in more detail in
future issues. State Postcode Suburb Type DOM
VIC 3636 NUMURKAH House 391
What is a good DOM figure? VIC 3959 SANDY POINT House 381
The suburbs in the ‘Top 10’ table (right) VIC 3737 MYRTLEFORD House 379
are exceptional cases. These are the
best figures out of many thousands NSW 2551 EDEN House 369
Australia-wide. Don’t use those figures WA 6281 QUINDALUP House 356
to gauge a good DOM, or nothing will NSW 2324 TEA GARDENS House 353
appeal to you. SA 5276 ROBE House 351
As a rough guide it takes about
three months to sell a property. The QLD 4660 CHILDERS House 347
DSR score spreadsheet calculated the TAS 7215 BICHENO House 344
Australia-wide median DOM at 96 in SA 5214 GOOLWA NORTH House 343
February 2011. For a typical suburb, a
Source: DSRscore.com.au, Feb 2011
DOM of less than 60 is pretty
good and a DOM of greater than
120 is something to be cautious of. A large number of corporations have The major industries are dairy, fruit,
See the ‘Bottom 10’ table (right) for a found the area appealing and as a result grazing and farming. The economy is
list of the poorest DOM figures. Macquarie Park has one of the highest dependent on water.
Also, note that in some locations concentrations of jobs per suburb in At the time of writing, 106 of
it takes longer to sell than in others – NSW. In 2009 Macquarie Park and the 175 properties for sale in
regardless of the state of the market. For Macquarie University received access to Numurkah are houses. Perhaps many
example, it’s a big decision spending a the Sydney rail network with their own of the properties for sale are on very
few million dollars on a property. Few train stations. This adds a significant large lots and may be farms in dire
buyers in markets this expensive will transport link in addition to the nearby financial circumstances.
rush in. So the ritzy suburbs will have M2 motorway. A large DOM like this represents a
a higher DOM figure on average than When I jumped on Domain’s website buyer’s paradise in terms of negotiation.
cheaper locations. I found 22 properties for sale. None of Vendors’ eyes will light up if you show
them were houses. With demand for any interest. They’d be desperate for
Good DOM example accommodation from both students and a sale by now. Locations like these are
Houses in Macquarie Park in NSW workers, houses on large blocks may be perfect for the bargain-hunter. But
spend a very short time on market eyed by developers for a higher use. don’t expect much capital growth in the
before being sold – about three weeks. short term.
Macquarie Park is about 12km north- Bad DOM example Ideally, you’d like to buy into those
west of the Sydney CBD. Macquarie Houses in Numurkah, Victoria, spend suburbs around Australia with low
University is located in Macquarie Park over a year on market. Numurkah is DOMs. With 15,000-plus suburbs it
and is one of the largest universities in a rural town about 200km north of will take you a while to find them. But
Australia. Macquarie Park also has a Melbourne sitting on Broken Creek. of course, there are many more statistics
large shopping centre servicing the area. It has a population of a few thousand. to consider beyond the DOM.
www.yipmag.com.auInvest | researching hot spots
and numerous suburbs within each postcode. So the data is not
localised enough to know which suburb to invest in.
3 There is no breakdown of the data
We need to know the birth rate, the death rate and
the movement of people into and out of a location. Say,
for example, there were no deaths in a location, no people
moving in and none moving away. But the population
increased by 10%. Then the only contributor would be births.
Here’s a hot tip: babies don’t buy properties. You’d be better
off setting up a shop that sells prams.
Yes, it’s true that young families may look to upgrade their
dwelling type from a house to a unit. If so, they leave behind an
empty unit. They may even choose to move out of the area if it
Growth drivers: truths and myths doesn’t have houses. So a high population growth in this case
would actually represent a decrease in demand for property.
Population growth
Despite population growth being one of the biggest
drivers of demand for housing, the data available has some
4 The data is behind the 8-ball
When people move into a new location, they don’t live
on the street waiting for developers to build houses and units
shortcomings. So personally, I don’t for them. Instead, the dwellings are already available prior to
use it much. the residents moving in. They move in, then data is collected
and the stats show an increase in population. You’d think that
1 The sampling rate is too infrequent
The Australian Bureau of Statistics (ABS) conducts a
census once every five years. This is most likely what you hear
increasing population means increasing demand, but they’ve
already found accommodation.
when an ‘expert’ is telling you a location has good population
growth. But five years is far too infrequent to establish a trend.
Look at the chart below and imagine all you had were figures
5 Population growth is only one side of the equation
The other side of the equation is the supply of dwellings.
The population could be growing at 10% in an area, but if the
for 2001 and 2006. You’d think population was growing when supply of housing is growing at 15%, then you should expect
in fact it’s declining. prices to actually drop.
The ABS even mentions on its website that the census
is not the best measure of population growth. But so many
commentators use it. 6 There are better statistics
Vacancy rate and stock on market are much better gauges
of the imbalance between demand and supply regarding
2 The data is not localised enough
The ABS recommends the ERP (Estimated Resident
Population) as a better gauge of population growth. This is
accommodation and population.
Don’t misunderstand my comments here. Population
growth is essential for capital growth. But the data provided is
sampled quarterly, which is frequent enough to establish a not as valuable as other statistics.
trend. But the ERP is calculated for a Local Government Area
or LGA. There can be numerous postcodes within an LGA Migration data
Like population growth statistics, the data available for Net
Overseas Migration (NOM) and interstate migration is not that
Misleading population growth
helpful. The Department of Immigration releases figures of how
ABS population figures are only collected every five years; if you many migrants settle in each state. They don’t even go down to
took samples in 2001 and 2006, it would appear that population
was growing when in fact it’s declining the LGA level. So again the data is not localised enough.
6000
Change factor
5800 A suburb that has all the good attributes like transport,
5600 proximity to employment, shopping, schools etc but has had
them for many years, may not outperform the national average
Population
5400
growth rate. This may be because the price has already factored
5200 in these attributes over the years. This is what makes new
5000
infrastructure or new business in an area more important than
the existing attributes when looking for high growth rates.
4800
This doesn’t mean Bondi for example won’t outperform the
4600 national average unless it changes. As Sydney grows, Bondi
2001 2002 2003 2004 2005 2006
is part of a smaller and smaller percentage of suburbs that
Year
have a beach. It is also getting closer to the CBD compared
www.yipmag.com.auInvest | researching hot spots
It’s unlikely that one suburb Sustained above-average growth is not
possible long term
will outperform others over I often hear experts claim that some locations will always
beat the rest of the market long term. Truly long term,
a long timeframe. Eventually, they’re plain wrong.
Imagine 100 years ago apples were worth 1c and so were
it will get too expensive and the oranges. Then assume oranges grew at 8% per year and apples
at only 6%. Clearly oranges are the long-term outperformer. In
market will balance 100 years of growth apples would be worth $3.40 while oranges
would be worth $22 each!
to the average Sydney suburb. The change isn’t happening Long before oranges ever got to that ridiculous price,
to Bondi, but to its surrounding suburbs, slowly making it people would choose to buy apples instead – even people
comparatively more attractive. This is the scarcity factor at who preferred oranges. That would decrease the demand for
work. oranges and increase the demand for apples. Apples would
One more point on change: you don’t need rapid change have a spurt of growth and would catch up with oranges.
to get rapid growth. Sometimes the market gradually eases The housing market may get out of balance for short
into a state of imbalance until people suddenly realise good periods, but it’s always naturally moving towards a balanced
value for money, and then there’s a buying frenzy. The state. In general, it is highly unlikely that one suburb will
demand and supply statistics should easily identify these outperform others over a very long timeframe. Eventually, it
imbalances. will get too expensive and the market will balance. Toorak
My point about change is that you should value it above may always be more expensive than its neighbours, but the
existing attributes of a location. A new shopping centre is growth rates will eventually be the same.
better than an old one. A new bus route is better than an
old one. Inner city vs outer suburbs or rural
Like with the apples and oranges comparison, inner city
suburbs will not outperform outer suburbs or regional
ne
w
your online investment partner
• suburb data & profiles • daily property news
• investment calculators • expert advice
• real life success stories • interactive forum & more
www.yourinvestmentpropertymag.com.au
www.yipmag.com.auInvest | researching hot spots
where to invest. They think investors
would be interested in this kind of
data. I don’t look much at the state
economy to filter my list. The micro-
economy is far more relevant than the
macro. A local economy can easily
buck a state trend. In every issue of this
magazine, there are examples of suburbs
experiencing strong growth within states
experiencing poor growth. Focus instead
on local information, preferably at the
suburb level.
Proposed or planned development
Proposed or planned developments
by local, state or federal government
should be ignored. At least wait until
work has commenced. Even once work
has commenced, homebuyers will not
suburbs long term. The longer the congestion prevents construction buy in that location until the work
timeframe of comparison, the more of new roads or train lines. Scarcity is complete. Even when the work is
closely the growth rates will match. works slowly for inner city suburbs, complete it will take them some time
I’ve heard experts say again and again: but a new train line, road, school, to realise the development is of benefit
“These inner city locations will always shopping centre, etc can pop up within and then get finance organised and then
be in high demand and low supply”. Yes, a year in an outer-lying suburb, adding make the move. Keep your eye on the
it’s true that people will always ‘want’ instant value. DSR score and you’ll know when it’s
them and there is a limited supply. But time to enter a market.
often these appraisals miss one of the key Residential development
components that contribute to demand. New residential developments are Houses vs units
Another fruit example is needed to not necessarily a plus for a suburb. Everyone knows that houses
explain this… Quite often I see them mentioned outperform units for growth long
Imagine you had a choice between a as part of the positive change that a term because they have a higher land
mango and an apple. Messiness aside, suburb is going through. Any increase component and it’s the land that
most people would choose the mango. in supply will reduce the demand appreciates. But the major occasion
Mangoes will always be more desirable. to supply ratio and put a softener on where this holds true is where the land
Now, what if I told you apples cost $1 price growth. In some circumstances, has not been fully developed.
and mangoes cost $180? Has that had any however, a new development may I wouldn’t buy a house on a tiny 300m2
impact on what fruit you end up buying? turn a sleepy old suburb into a trendy, block simply because it’s a house and has a
The quality of a suburb’s attributes vibrant one. Examine the nature of higher land component. If it was a 600m2
is not the only factor affecting demand. new developments carefully to gauge block and zoned such that I could build a
Price affects demand too. It’s the very the impact. As a general rule: more duplex, then it’s more attractive. Houses
thing we’re basing our decision to invest development means less price growth. generally outperform units because the
on – that the market will balance out land they’re on has not been fully utilised.
the imbalance in the demand to supply Long-term growth stats I’m not saying that a 300m2 house
ratio via price increases. I’m amazed at the number of times a would be a bad investment though.
So truly long term, inner and outer high 10-year average growth is quoted In fact, if it were in a suburb with
suburbs must grow at roughly the same as a positive for a suburb. It’s almost the units everywhere, it may be the only
rate. You’re virtually breaking the law opposite actually. Growth happens in accommodation suitable for dog lovers
of supply and demand otherwise. One spurts followed by flat periods. Unless – the scarcity factor.
caveat on this point: you may have to there are lots of new drivers of growth
wait 50-plus years to see this come like infrastructure, above-average Strategy vs research
true. Some of us don’t have 50 years to growth can’t be sustained. The longer a Regardless of whether you
invest. We want growth now! suburb has experienced above-average choose houses or units, city or
Outer suburbs have more potential growth, the more likely the start of its country, cash-flow or capital, one thing
for rapid growth than inner ones next flat period is just around the corner. will make any controversial strategy
because outer suburbs have more irrelevant: excellent research. Consider
potential for rapid change. This is Macro vs micro economics each topic, but don’t let an inferior
because the infrastructure is already Many commentators refer to state and strategy interfere with your superior
in place for inner city locations and national economic data as a guide for research.
www.yipmag.com.auYou can also read