SRI LANKA DEVELOPMENT UPDATE - MORE AND BETTER JOBS FOR AN UPPER MIDDLE-INCOME COUNTRY - World ...
←
→
Page content transcription
If your browser does not render page correctly, please read the page content below

SRI LANKA
                  DEVELOPMENT
                     UPDATE
             MORE AND BETTER JOBS FOR AN
            UPPER MIDDLE-INCOME COUNTRY

June 2018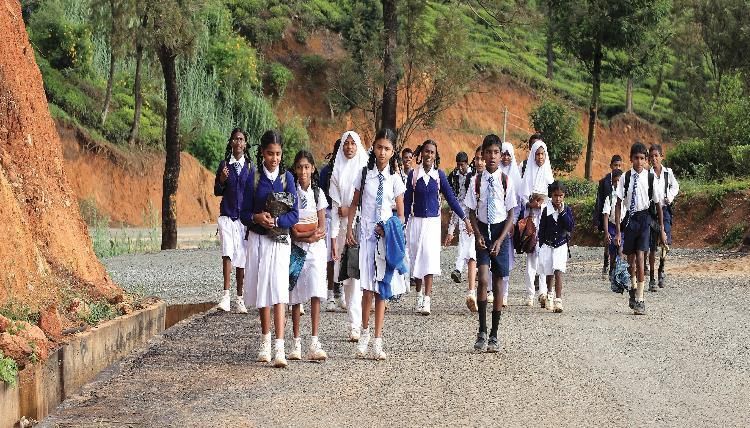
Standard Disclaimer:

      This volume is a product of the staff of the International Bank for Reconstruction
      and Development/ The World Bank. The findings, interpretations, and conclusions
      expressed in this paper do not necessarily reflect the views of the Executive Directors
      of The World Bank or the governments they represent. The World Bank does not
      guarantee the accuracy of the data included in this work. The boundaries, colors,
      denominations, and other information shown on any map in this work do not imply
      any judgment on the part of The World Bank concerning the legal status of any
      territory or the endorsement or acceptance of such boundaries

Copyright Statement:

      The material in this publication is copyrighted. Copying and/or transmitting portions
      or all of this work without permission may be a violation of applicable law. The
      International Bank for Reconstruction and Development/ The World Bank
      encourages dissemination of its work and will normally grant permission to reproduce
      portions of the work promptly.

      For permission to photocopy or reprint any part of this work, please send a request
      with complete information to the Copyright Clearance Center, Inc., 222 Rosewood
      Drive, Danvers, MA 01923, USA, telephone 978-750-8400, fax 978-750-4470,
      http://www.copyright.com/.

      All other queries on rights and licenses, including subsidiary rights, should be
      addressed to the Office of the Publisher, The World Bank, 1818 H Street NW,
      Washington, DC 20433, USA, fax 202-522-2422, e-mail pubrights@worldbank.org.

Photo Credits:

      Cover: Anuki Premachandra; Executive Summary: Sashikala Jeyaraj; Recent
      Developments: Joseph C. Qian; Outlook, Risks and Policy Options: Janaka
      Thilakaratne; Special Focus: Creating Jobs and World Bank Group Assistance:
      Luxshmanan Nadaraja.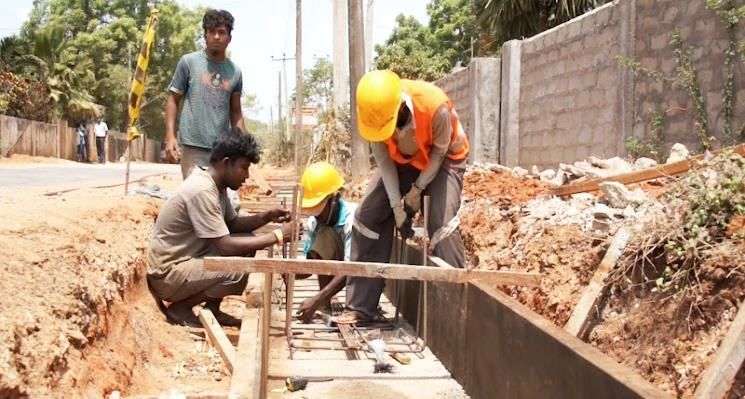
Preface
          The Sri Lanka Development Update has two main aims. First, it reports on the key
          developments over the past six months in Sri Lanka’s economy, and places these in a
          longer term and global context. Based on these developments, and on policy changes
          over the period, it updates the outlook for Sri Lanka’s economy and social welfare.
          Second, the Update provides a more in-depth examination of selected economic and
          policy issues, and analysis of medium-term development challenges. It is intended for
          a wide audience, including policymakers, business leaders, financial market
          participants, think tanks, non-governmental organizations and the community of
          analysts and professionals engaged in Sri Lanka’s evolving economy.

          The SLDU was prepared by a team consisting of Ralph van Doorn, Kishan
          Abeygunawardana, Tiloka de Silva (Macroeconomics, Trade and Investment), with
          inputs from David Newhouse, Nandini Krishnan, Ani Silwal (Poverty and Equity),
          Fabian Seiderer, Manela Karunadasa (Governance), Gladys Lopez-Acevedo, Robert
          Beyer, Milagros Chocce Falla (South Asia Chief Economist’s Office), Rafael
          Dominguez (IFC) and Juri Oka (Country Management Unit), with overall guidance
          from Idah Pswarayi-Riddihough (Country Director for Sri Lanka and Maldives),
          Valerie Layrol (Senior Operations Officer), Tatiana Nenova (Program Leader
          Equitable Growth, Finance and Institutions), and Manuela Francisco (Practice
          Manager Macroeconomics, Investment and Trade for the South Asia Region).
          Dilinika Peiris provided support on the dissemination of the report, and Sashikala
          Jeyaraj provided report design and formatting support. The report was prepared
          based on published data available on or before May 31, 2018. Data sources included
          World Bank, International Monetary Fund, Central Bank of Sri Lanka, Ministry of
          Finance, Department of Census and Statistics, and press reports. For questions, please
          contact: infosrilanka@worldbank.org

          This report, additional material and previous reports can be found at:
                  www.worldbank.org/sldu

          Previous editions:
              • November 2017: Creating opportunities and managing risks for
                  sustained growth,
                  openknowledge.worldbank.org/handle/10986/28826
              • June 2017: Unleashing Sri Lanka’s trade potential,
                  openknowledge.worldbank.org/handle/10986/27519
              • October 2016: Structural challenges identified in the Systematic
                  Country Diagnostic,
                  openknowledge.worldbank.org/handle/10986/25351

          Stay in touch with the World Bank in Sri Lanka and South Asia via
                 www.worldbank.org/en/country/srilanka
                 @WorldBank, @WorldBankSAsia, follow hashtag #SLDU2018
                 www.facebook.com/worldbanksrilanka
                 instagram.com/worldbank/
                 www.linkedin.com/company/the-world-bank
Table of Contents

   EXECUTIVE SUMMARY ................................................................................................... 5

        1.               Recent Developments .................................................................................................... 5
        2.               Outlook, risks and policy priorities ................................................................................ 7
        3.               Special focus ................................................................................................................... 8
   A. RECENT DEVELOPMENTS ...................................................................................... 10

   B. OUTLOOK, RISKS AND POLICY PRIORITIES ....................................................... 24

        1.               Outlook ......................................................................................................................... 24
        2.               Risks ............................................................................................................................. 27
        3.               Challenges and policy priorities ................................................................................... 28
   C. SPECIAL FOCUS: MORE AND BETTER JOBS FOR AN UPPER MIDDLE
   INCOME COUNTRY ........................................................................................................ 33

        1.               The state and structure of jobs in Sri Lanka ................................................................ 34
        2.               Is Sri Lanka an employment outlier in South and East Asia? ...................................... 39
   D. WORLD BANK GROUP ASSISTANCE...................................................................... 52

   KEY ECONOMIC INDICATORS .................................................................................... 54

   LIST OF TABLES
   Table 1: Growth prospects for key partners of Sri Lanka ........................................................................................................ 26
   Table 2: Keeping employment rates constant would require massive job creation. ............................................................ 43
   Table 3: South Asian countries have created large numbers of jobs. ..................................................................................... 43
   Table 4: The annual job creation needed in Sri Lanka depends on the age of the working population. ......................... 44
   Table 5: More jobs will be needed in particular in the post-conflict areas. ........................................................................... 48
   Table 6: Balance of payments ........................................................................................................................................................ 55
   Table 7: Budget and fiscal outcomes ............................................................................................................................................ 56

   LIST OF BOXES
   Box 1: Sri Lanka: country context ................................................................................................................................................... 9
   Box 2: Drivers of the interest bill .................................................................................................................................................. 13
   Box 3: Debt management ............................................................................................................................................................... 15
   Box 4: Cost-reflective pricing of fuel ........................................................................................................................................... 18
   Box 5: Global economic context................................................................................................................................................... 25
   Box 6: Public Expenditure Review ............................................................................................................................................... 29
   Box 7: National Audit Act .............................................................................................................................................................. 31
   Box 8: What is the informal sector in Sri Lanka? ....................................................................................................................... 36
   Box 9: The job creation challenge in South Asia ....................................................................................................................... 42
   Box 10: Exports and jobs ............................................................................................................................................................... 50

Jun e 2 01 8                                                                                                                                     THE WOR LD B A NK
                                                                                                                                                                 4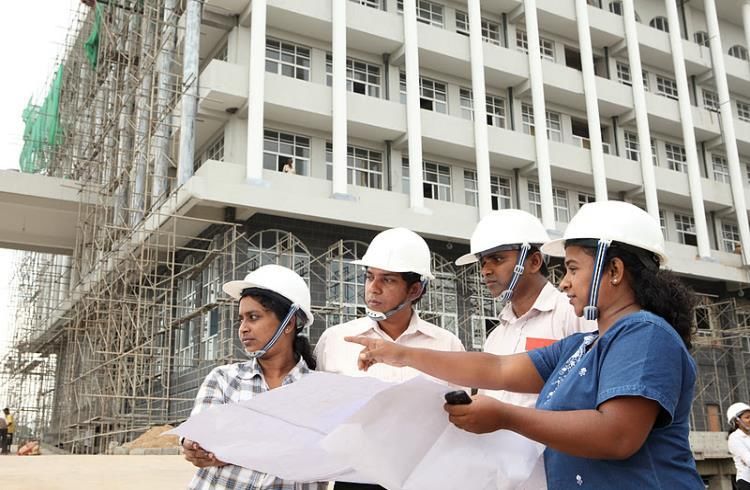
Sri Lanka Development Update

 Executive Summary

                       Recent policy measures have contributed to macroeconomic stability. However, with significant
                       risks stemming from both domestic and external fronts, the balance of risks is tilted towards
                       downside. To sustain growth, create more and better jobs and reduce poverty Sri Lanka needs
                       to implement and sustain structural reforms to improve competitiveness.

               1. Recent Developments
Improved               In 2017, Sri Lanka’s improvement in its macroeconomic performance was masked by
macroeconomic          inclement weather. Fiscal and monetary policy measures contributed to stabilization;
performance was        however, a prolonged drought took a toll on growth while contributing to raising
masked                 inflation. Despite a widening deficit of the external current account, exports
by inclement           recovered after shrinking for two consecutive years. Strengthened capital flows
weather                improved external buffers. The overall improvement in macroeconomic performance
                       was recognized by rating agencies.

Reform               Authorities pursued the economic reform agenda presented in the government policy
implementation is    statements, albeit at a slower pace, due to a complex political environment and
progressing although institutional constraints on policy implementation.
slower than expected • The new Inland Revenue Act passed in 2017 came into effect in April 2018,
                           which marks a key milestone towards sustainable revenue-led fiscal
                           consolidation.
                      • Fuel price reforms in May 2018 will reduce fiscal risks from SOEs.
                      • Government passed the Active Liability Management Law to deal with
                           heightened external debt refinancing risks in 2019 and beyond.
                      • The phase-out of 1,200 para-tariffs in December 2017 is expected to make Sri
                           Lanka more competitive.

Jun e 2 01 8                                                                           THE WOR LD B A NK
                                                                                                       5
Sri Lanka Development Update

                           •A new single web portal for investors called SWIFT was launched to facilitate
                            investments, and a Trade Information Portal1 will be available soon to provide
                            import and export related information on regulations and processing steps.
                        • Various additional regulatory simplification in the business environment have
                            been carried out such as the procedures for property registration and
                            construction permits.
                        • Work on the Excise reform is well advanced.
                        • A new Public Finance Act is being drafted to strengthen management of public
                            finances.
                       However, some other vital reforms were lagging; these include, passing of the Audit
                       Act, progressing on establishing a unified debt management office, SOE reforms, and
                       reforms to improve the investment climate such as the legislation on Secured
                       Transaction Registry, the Customs Ordinance and revisiting the Companies Act.

Improvement in         Albeit small, the government recorded a primary surplus in 2017, in line with the IMF
public finance         supported government program. The achievement that came as a first-in-decades was
continued; however,    thanks to improved tax collection and controlled non-interest current expenditures.
fiscal risks remain    Nevertheless, a sharp increase in interest expenditure led to a marginal increase in
high                   overall deficit as share of GDP to 5.5 percent in 2017. Fiscal risks emanating from
                       public debt (77.4 percent of GDP, 2017) and treasury guarantees issued mainly for
                       SOEs and state agencies (6.8 percent of GDP, 2017) remained high in 2017 as well.

Economy suffered       In 2017, inclement weather took a toll on real and external sectors. Despite important
from continued         contributions from some service sectors, growth decelerated to 3.3 percent mainly
natural disasters in   because of weak performance of agriculture and related sectors. On the external front,
2017                   the favorable impact of recovery of exports led by tea was offset by an increased
                       petroleum bill as reservoirs ran dry due to drought while global oil prices increased.
                       Along with the changes in VAT, inclement weather exerted upward pressure on food
                       prices leading to relatively high inflation.

External buffers       Gross official reserves reached an all-time-high in April 2018 thanks to proceeds from
improved thanks to     term-financing facilities, Eurobonds issued in 2017 and 2018 and FDI inflows
capital flows;         including the proceeds from the long lease of Hambantota port. The central bank
however, currency      remained a net buyer of foreign exchange in 2017 supporting the accumulation of
pressures were seen    reserves. While the Sri Lankan rupee depreciated by 2 percent in 2017, elevated
in 2018                pressures were seen in 2018 amid recent emerging market interest rate pressures
                       (Argentina and Turkey) and expectations of further US rate hikes in the backdrop of
                       a reduction of domestic policy rates.

IMF successfully       With the implementation of the cost-reflective fuel price formula in May 2018, the
completed the fourth   fourth review of the IMF Extended Fund Facility (EFF) program was successfully
review of the EFF      completed. The key fiscal and monetary policy measures aimed at reinstating stability
program                were supported by this program.2 The program also calls for significant SOE reforms
                       and the move towards an inflation targeting monetary management regime.

Poverty reduction      Sri Lanka has seen strong poverty reduction in recent years, which continued between
continued to be        2012/13 and 2016. Using the international poverty line for lower-middle income
strong                 countries at USD 3.20 per day poverty between 2012/13 and 2016 fell from 16 to 9.5

                       1 The portal is expected to go live on July 5, 2018: http://srilankatradeportal.com/.
                       2 The reforms in the program   are mainly focused on revenue led fiscal consolidation; transition to flexible
                       inflation targeting; and reforms in SOE oversight and trade and competitiveness.

Jun e 2 01 8                                                                                       THE WOR LD B A NK
                                                                                                                   6
Sri Lanka Development Update
percent, lifting roughly 1.5 million persons out of poverty. There has been remarkable
poverty reduction in some previously poor districts between 2012/13 and 2016.
Continued structural transformation, urbanization, growth in tourism, and focus on
the remaining pockets of poverty should sustain poverty reduction in the future.
2. Outlook, risks and policy priorities
A stable outlook is The outlook will remain stable, provided the government is committed to the reform
projected in the agenda aimed at improving competitiveness, governance and public financial
backdrop of policy management. Together with the IMF program, these reforms will add to confidence
reforms and support fiscal consolidation efforts.
Growth is expected The economy is expected to rebound from a low base and grow around 4.3 percent
to pick up with in the medium term, driven by private consumption and investment. Inflation will
manageable inflation stabilize around mid-single digit level, although the upward trend in oil prices may
exert some upward pressure with the implementation of fuel-price formula. The move
towards flexible inflation targeting will help keep inflation in the single digits, while
the exchange rate is left to adjust to market forces.
Fiscal consolidation Implementation of the new Inland Revenue Act, further reforms to the VAT Act and
will improve overall the Excise law and improvements in tax and excise administration are expected to
fiscal balances expand revenues. Primary surpluses supported by the implementation of revenue
measures will narrow the overall fiscal deficit to 3.9 percent of GDP by 2020.
Continued fiscal consolidation is projected to bring the public debt burden to a
downward path from 2018. Under the baseline scenario, debt-to-GDP ratio will come
down to 74.8 percent of GDP by 2020.
The external current With healthy growth in the US and Euro Area and a recovery in a few key Middle
account deficit will Eastern countries, the external environment for Sri Lanka has improved, which would
widen in 2018 and be favorable for exports. The country will continue to benefit from tourism growth
beyond in line with and the EU’s GSP+3 in the medium-term. However, rising oil prices and external
increase in interest payments along with decelerating remittances flows will lead to a widening
commodity prices external current account deficit in 2018 and beyond. Foreign capital inflows to
government securities and FDI inflows will help closing the external financing needs
with no Eurobond falling due in 2018.
With emphasis on FDI inflows and other debt creating flows in IMF EFF program, external term-
market forex financing and project loans will elevate external buffers to a historical-high in 2018
purchases, external while the central bank will help accumulation of reserves with emphasis placed on
buffers are to purchasing foreign exchange and maintaining a more market-determined exchange
improve in 2018 rate using monetary policy. A part of the increased reserves is expected to be used for
liability management purposes given refinancing risks in 2019 and beyond. However,
in the medium-term, unless export and FDI growth accelerates, more external
borrowing will be needed when large repayments in Eurobonds continue.
Risk balance is tilted The challenging political environment has already slowed the reform agenda and
towards downside; remains the key risk to a favorable medium-term outlook. With the impending
the key one being election cycle, which elevates this risk, the window for further reforms is narrowing.
the domestic On the fiscal and debt management front, risks include the delay in implementing
political risk revenue measures, slower than expected improvement in tax administration, and
3 Provides duty free access for about 7,200 tariff lines to the EU
Jun e 2 01 8 THE WOR LD B A NK
7Sri Lanka Development Update
delays in implementing the Active Liability Management Act. The increasing
occurrence and impact of natural disasters could have an adverse impact on growth,
the fiscal budget, the external sector and poverty reduction.
External risks include disappointing growth in key countries that generate foreign
exchange inflows to Sri Lanka: exports, tourism, remittances, FDI, and other
financing flows. Tighter than expected global financial conditions would increase the
cost of debt and make rolling over the maturing Eurobonds from 2019 more difficult;
however, the Active Liability Management Act will help mitigate this refinancing risk.
Faster than expected rises in commodity prices would increase pressure on the
balance of payments and could make further fuel price reforms more difficult.
Tackling challenges Sri Lanka faces a number of challenges to sustain future economic growth, create
through reforms is more and better jobs and reduce poverty; which must be addressed through
crucial for sustained determined reforms. These challenges can be addressed through four sets of priority
and equitable growth reforms:
1. staying on the fiscal consolidation path and creating fiscal space for health,
education, social protection and other public investments;
2. improving Sri Lanka’s competitiveness and promoting trade and FDI to facilitate
a shift in the growth model driven more by private investment and exports;
3. making progress on and completing the already started governance reforms such
as Right to Information, the Audit Act and the Public Finance Act and SOE
reforms; and
4. reducing vulnerability and risks in the economy: (a) managing refinancing risks of
Eurobonds beyond; (b) improving the debt management function with requisite
institutional, legal and strategy frameworks; (c) mitigating the impact of reforms
on the poor by replacing untargeted effective subsidies to the non-poor by
targeted spending; and (d) enhancing the country’s resilience and disaster
preparedness to deal with frequent natural disasters more pro-actively.
These key challenges are inter-linked and require a comprehensive and coordinated
approach. Although domestic political considerations and institutional constraints on
policy implementation make it challenging, a strong political will and support of the
bureaucracy could help advance the reform agenda. Steps are needed to ensure the
support of private sector, civil society and other stakeholders through improved
communications on costs and benefits of its Vision 2025 agenda.
3. Special focus
Creating job Sri Lanka’s employment rate is low given its income level due mainly to low female
opportunities is labor force participation. As the country is ageing, it is important to increase the
important to sustain contribution from women and youth to sustain growth and development. Sri Lanka
growth and is also faced with high unemployment among youth. Accordingly, the country needs
development to create jobs opportunities appropriate for its labor force, in particular for youth and
women. The government has set an ambitious target to create 1 million jobs in its
Vision 2025. The Special Focus Section of this Edition is devoted to a discussion of
issues and priorities in jobs creation in Sri Lanka and the Northern and Eastern
Provinces.
Jun e 2 01 8 THE WOR LD B A NK
8Sri Lanka Development Update
Box 1: Sri Lanka: country context
Sri Lanka is a Lower Middle-Income country with a GDP per capita of USD 4,073 (2017) and a total population of 21.4
million people. Following 30 years of civil war that ended in 2009, Sri Lanka’s economy grew at an average 5.8 percent
during the period of 2010-2017, reflecting a peace dividend and a determined policy thrust towards reconstruction and
growth; although there were some signs of a slowdown in the last few years. The economy is transitioning from a
predominantly rural-based economy towards a more urbanized economy oriented around manufacturing and services.
The country has made significant progress in its socio-economic and human development indicators. Social indicators rank
among the highest in South Asia and compare favorably with those in middle-income countries. Economic growth has
translated into shared prosperity with the national poverty headcount ratio declining from 15.3 percent in 2006/07 to 4.1
percent in 2016. Extreme poverty is rare and concentrated in some geographical pockets; however, a relatively large share
of the population subsists on slightly more than the extreme poverty line. The country has comfortably surpassed most of
the MDG targets set for 2015 and was ranked 73rd in the Human Development Index in 2015.
The economy’s weak competitiveness is an issue to address. Restrictive trade policies over the past decade have created a
strong anti-export bias, which has been reflected in a dramatic decline in trade. While growth in Sri Lanka has been strong
over the past few years, it has been inward-oriented and based on the growth of non-tradable sectors. Sri Lanka also attracts
a much lower volume and quality of FDI than peer economies and the shortcomings of the investment climate pose obstacles
for new firms. Moreover, significantly high state participation in the economy has implications on competitiveness in several
sectors and labor market dynamics.
Low revenues and high debt as a share of GDP are key macroeconomic concerns. The major causes of low revenues as a
share of GDP are the low number of number of tax payers (less than 7 percent of the labor force and formal establishments
pay income tax), reductions in statutory rates without commensurate efforts to expand the tax base, inefficiencies in
administration and numerous exemptions. Low revenues combined with largely non-discretionary expenditure in salary bill,
transfers, and interest payments has constrained critical development spending and squeezed expenditure on health,
education and social protection, which is low compared to peers.
Sri Lanka has a 3-year Extended Fund Facility (EFF) program with the IMF, which is primarily focused on increasing
revenues. The program calls for fiscal consolidation, transition to flexible inflation targeting, and reforms in public financial
management, state enterprises and trade and competitiveness. The IMF announced that it had reached staff-level agreement
with the government on completing the fourth review of the EFF in April 2018.
The government that came to power in 2015 envisions promoting a globally competitive, export-led economy with an
emphasis on inclusion. It has indicated keenness to undertake reforms in the areas of public finance, competitiveness,
governance and education sectors. Recently, the government presented Vision 2025, a policy document encompassing key
structural reforms to address the above challenges.
Figure 1: Growth and inflation Figure 2: Sri Lanka’s fiscal position compared to peers
(Percent annual change)
GDP growth 2
10 Korea
Average GDP growth of the period
Fiscal balance (percent of GDP
8.5 Inflation, annual average 0 Philippines
Thailand
8
-2 Indonesia
2011-2017)
Malaysia
6
-4
-6 Pakistan
Sri Lanka
4 4.2
-8
2 -10 Egypt
-12
0 -10 0 10 20 30 40 50
2010 2011 2012 2013 2014 2015 2016 2017 Gross financing need (percent of GDP, 2018)
Source: Department of Census and Statistics and staff calculations Source: World Economic Outlook, IMF Fiscal Monitor
Note: Bubble size corresponds to the gross debt as a share of GDP.
Jun e 2 01 8 THE WOR LD B A NK
9Sri Lanka Development Update
A. Recent Developments
Growth performance of 2017 was affected by inclement weather
Floods and drought Growth decelerated to a 16-year low of 3.3 percent in 2017 due mainly to adverse
affected growth weather conditions, with floods in May in the South and West, and prolonged drought
across the country.4 Agriculture contributed negatively to growth for the second
consecutive year, while an adverse impact on related industry and service sectors was
also observed. The construction sector, which was one of the biggest contributors to
growth in 2016, saw a slowdown5 along with the transportation sector. As in 2016,
the financial services, wholesale and retail trade, real estate, and other personal
services sectors contributed significantly to growth. However, this contribution was
insufficient to keep overall growth from falling from 4.5 percent in 2016 (Figure 3).
GDP per capita reached USD 4,073 and GNI per capita reached USD 3,851.
Capital formation Reflecting the impact of inclement weather and VAT reforms, the contribution to
was the key growth from private consumption remained subdued6 while it was negative for
contributor to government consumption due to tight control over the wage bill and purchase of
growth goods and services. Investment demand reflected by the contribution to growth from
gross capital formation was high thanks to some key projects driven by FDI
progressing well.7 Exports contributed positively to growth with strong growth in tea,
garments and tourism sectors; however, increased imports in food and petroleum
4 Despite a rebound in agriculture sector, a decline in construction decelerated the growth of the first
quarter of 2018 to 3.2 percent.
5 The contribution to growth from construction fell to 0.2 percentage points in 2017 from 0.6 in 2016.
6 For 2017, the contribution to growth from private consumption and government consumption were
0.8 and -0.4 percentage points respectively.
7 The contribution to growth from gross capital formation was 7.3 percentage points in 2017. Included
in this was a 6.0 percentage point contribution to growth from changes in inventories.
Jun e 2 01 8 THE WOR LD B A NK
10Sri Lanka Development Update
products amid drought resulted in a significantly large negative contribution to growth
from the overall external sector8 (Figure 4).
Figure 3: Contributors to growth (production side) Figure 4: Contributors to growth (demand side)
(Percentage points) (Percentage points)
Agriculture Construction Imports
10 Other industry Services Exports
Gross capital formation
Net taxes Overall growth Government consumption
8 Private consumption
15
Overall growth
10
6
5
4
0
2
-5
0 -10
2011 2012 2013 2014 2015 2016 2017
-2
2011 2012 2013 2014 2015 2016 2017
Source: Department of Census and Statistics and staff calculations Source: Department of Census and Statistics and staff calculations
Annual average inflation was high in 2017 due to inclement weather and VAT changes but has eased
since then.
Inflation was high in A combination of factors including food inflation due to adverse weather, past
2017 but has eased currency depreciation and increased indirect taxes contributed to a rise in inflation in
since then 2017. Accordingly, year-on-year inflation measured by the widely-watched Colombo
Consumer Price Index (CCPI, 2013=100) recorded its highest value since it was
introduced in 2014 at 7.8 percent in October 2017 before closing the year at 7.1
percent. In addition to food, large contributions to the rise in prices came from health,
education, restaurant and hotel segments with the increase in the VAT rate.9
However, inflation eased during the first few months of 2018, reaching 4.0 percent in
May, as the effects of the weather-related food shocks and VAT changes wore off.
Annual average inflation followed suit, closing the year 2017 at 6.6 and decelerating
to 5.7 percent by May 2018. On a similar note, core inflation measured excluding
food, energy and transport declined to 3.2 percent by May 2018 once the level effect
of VAT increase dissipated amid tight monetary policy (Figure 5 and 6).
The national price The National Consumer Price Index (NCPI, 2013=100) that reflects price
index echoed the movements of all provinces in the country based on the Household Income and
same trends Expenditure Survey (HIES) also reported a similar trend. After peaking at 8.8 percent
in October 2017, year-on-year inflation eased to 1.6 percent by April 2018.
8 The negative contribution to growth from the external sector was 4.6 percent, the highest negative
contribution to growth in the last three years.
9 2017 inflation reflected the first full-year impact of VAT reforms. The VAT net was broadened
removing exemptions on selected private health-related items while the rate was increased to 15
percent (from 11 percent) in May 2016; the related legal process was completed in November 2016.
Jun e 2 01 8 THE WOR LD B A NK
11Sri Lanka Development Update
Figure 5: Inflation Drivers (CCPI: 2013=100) Figure 6: Inflation movements
(Percent) (Percent)
Others Alcoholic beverages CCPI Core-yoy
Restaurants & Hotels Communication CCPI Headline - yoy
Education Health 10.0 NCPI Headline y-o-y
10 Housing, Water & Energy Food CCPI Headline - Annual average
Headline (YoY) Core-yoy
8.0
8
6.0
6
4.0
4
2.0
2
0.0
0
-2.0
Nov-17
Sep-17
Mar-17
Mar-18
Jul-17
May-18
May-17
Jan-17
Jan-18
Mar-16
Mar-17
Mar-18
Jul-16
Sep-16
Nov-16
Jul-17
Sep-17
Nov-17
May-16
May-17
May-18
Jan-16
Jan-17
Jan-18
Source: Department of Census and Statistics and staff calculations Source: Department of Census and Statistics and staff calculations
The fiscal improvement was masked by a sharp rise in interest cost; the new Inland Revenue Act is
expected to pave the way for sustainable, revenue-led fiscal consolidation.
The fiscal The government recorded a small primary surplus in 2017, in line with the IMF
improvement was supported government program. The achievement that came as a first-in-decades was
masked by a sharp due to improved tax collection and controlled non-interest current expenditures. Tax
rise in interest cost revenues increased10 thanks to VAT reforms in its first full-year of implementation,
while dividend flows to the government from State Owned Business Enterprises
(SOBEs) were significantly lower compared to the previous year, leading to a lower
total revenue. On the expenditure front, despite the increase in spending on natural
disasters, tight control helped reduce non-interest current expenditures as a share of
GDP.11 A lower capital budget execution ratio resulted in a lower than budgeted
public investment level.12 These factors collectively contributed to turning a negative
primary balance to a positive one in 2017. However, a sharp increase in interest
expenditure13 led to widening of the overall deficit to 5.5 percent in 2017 from 5.4
percent of GDP in the previous year (Figure 9 and 10) (Box 2).
Foreign commercial Foreign sources provided about 60 percent of net financing, equivalent to 3.3 percent
sources played a key of GDP. This consisted mainly of external commercial sources, which included
role in deficit sovereign bonds and foreign currency term finance facilities amounting to USD 2.5
financing billion, equivalent to 2.9 percent of GDP in total. The remaining 40 percent was
financed through domestic sources; predominantly by the banking sector. As in the
past, Employees’ Provident Fund, National Savings Bank and other savings and
insurance institutions made a significant contribution to the domestic non-bank
financing component.
10 Tax revenue increased to 12.6 percent of GDP in 2017, a 0.3 percentage point increase over the
previous year.
11 Non-interest current expenditures reduced by 0.6 percentage points during the same period.
12 Public investment recorded a 0.1 percentage point increase to 4.9 percent of GDP in the previous
year.
13 As a share of GDP, interest rose from 5.1 percent in 2016 to of 5.5 percent in 2017.
Jun e 2 01 8 THE WOR LD B A NK
12Sri Lanka Development Update
Box 2: Drivers of the interest bill
The government’s interest cost has risen fast in the past few years. Between 2014 and 2017, the interest cost grew
at a compounded annual growth rate of 18 percent and reached a seven-year high at 5.5 percent of GDP in 2017, up
from 4.2 percent of GDP in 2014. The interest bill, which continues to be the single largest expenditure item in the
budget, was equivalent to over 40 percent of the government total revenue. Moreover, it exceeded the total public
investment for the first time in more than a decade, in 2017.
Rising domestic interest costs was the key reason behind the past growth. Domestic interest payments accounted
for almost 70 percent of the total growth in the interest bill for 2017. This was mainly driven by a relatively high interest
environment amid a tight monetary policy aimed at stabilization. Average interest cost on domestic debt rose across
maturities in 2016; for example, average interest rate of 8.9 percent on 5-year bonds issued in 2015 increased to 12
percent in 2016 – a much higher increase than the total policy rate tightening - and remained high at 11.5 percent in
2017. Meanwhile, the local currency debt stock is estimated to have grown by around 9 percent in 2016 and 4 percent
in 2017. Moreover, the move towards relatively longer maturities, which is reflected by an increase in the Average Time
to Maturity (ATM) in domestic debt,14 also contributed to the rise in average interest cost on domestic debt.
Interest cost on external debt could become challenging, going forward. On the external front, the interest bill
rose by 32 percent although its contribution to growth was less important compared to the domestic bill in the year
2017. However, the interest bill on external debt will be challenging in the coming years given the country’s shift towards
commercial borrowing while the global financial conditions are expected to tighten. Continued fiscal consolidation and
improved debt management are even more important in the context of rising interest costs (Figure 7 and 8).
Figure 7: Interest payments Figure 8: Domestic interest bill, average interest cost
(Contribution to growth, percentage points) (Percent of GDP) (Percent of GDP) (Percent)
25.0 5.0
Interest cost (domestic)
5 Average interest rate (RHS) 13
20.0
4.0 Average policy rate (mid-point, RHS)
12
15.0
4
10.0 3.0 11
5.0 3 10
2.0
0.0
1.0 2 9
-5.0
8
-10.0 0.0
2010 2011 2012 2013 2014 2015 2016 2017
1
Domestic External 7
Total interest Domestic (RHS)
External (RHS) 0 6
2010 2011 2012 2013 2014 2015 2016 2017
Source: Central Bank of Sri Lanka, staff calculations Source: Central Bank of Sri Lanka, staff calculations
Fiscal risks remain The central government debt to GDP ratio declined to 77.4 percent thanks to
high emanating from relatively high real growth effect - albeit smaller compared to the previous year - and
central government low real interest rates on debt effect in a year of relatively high inflation. However,
and SOE debt the country’s debt profile highlights many important risks. Moreover, SOE debt,
which is not included in the public debt, is high and has been growing in the recent
past mainly due to the absence of cost reflective pricing formulae (CPC and CEB)
and weak operational performance (Sri Lankan Airlines). Debt guaranteed by the
Treasury for SOEs is high while the composition of guarantees highlights heightened
risks (Figure 12, 14 and 15).
The new Inland The new Inland Revenue Act came into effect on April 1 of 2018.15 The new law that
Revenue Act is builds on international best practice, aims to broaden the tax base by removing
14 ATM of domestic debt rose from 3.2 years in 2012 to 6 years in 2016.
15 Passing of the Act was a key structural benchmark of the IMF supported government program.
Jun e 2 01 8 THE WOR LD B A NK
13Sri Lanka Development Update
expected to support excessive tax exemptions; rationalize corporate tax incentives toward an investment-
revenue-led fiscal oriented regime; simplify the tax system; and strengthen powers of the tax
consolidation administrator. If well implemented, the new law would serve as the foundation for
sustained revenue-led fiscal consolidation over the medium term and provide
resources for essential social services and productivity-improving public investments
while making the budget more resilient to natural disasters.
Figure 9: Change in total expenditure Figure 10: Overall Fiscal Balance
(Percent of GDP) (Percent of GDP) (Percent of GDP) (Percent of GDP)
Capital expenditure Interest Overall balance (RHS) Primary balance (RHS)
4 Others Transfers 25 25 Total revenue and grants Total expenditure 2
Salaries Change in expenditure
Total expenditure (RHS)
3
20 20 0
2
15 15 -2
1
10 10 -4
0
5 5 -6
-1
-2 0 0 -8
2013 2014 2015 2016 2017 2012 2013 2014 2015 2016 2017
Source: Ministry of Finance, staff calculations Source: Ministry of Finance, staff calculations
Figure 11: Eurobond maturities Figure 12: Drivers of central government debt
(USD million) (Percentage points of GDP) (Percent of GDP)
Real interest effect Growth effect
Sovereign bonds Banks and SLA Primary deficit effect Exchange rate effect
2000
Residual Change in debt
1800 15 Public debt (RHS) 80
1600 78
1400 10 76
1200
74
1000 5
72
800
70
600 0
68
400
-5 66
200
64
0
2023
2024
2012
2013
2014
2015
2016
2017
2018
2019
2020
2021
2022
2025
2026
2027
2028
-10 62
2011 2012 2013 2014 2015 2016 2017
Note: SLA is Sri Lankan Airlines Source: Ministry of Finance, staff calculations
Source: Ministry of Finance, annual reports staff calculations
Passing of a Liability To deal with the refinancing risks of maturing Eurobonds starting from 2019, the
Management Act is a government enacted the Active Liability Management Act, which provides the legal
key step but more framework for active liability management operations. The Act allows raising new
needs to be done to debt of an amount up to 10 percent of the total outstanding debt beyond maturing
improve debt debt within the year, which can be used to buy back debt maturing in future years.
management While this is a key measure towards managing an immediate risk, many other
important reforms are essential for improving the debt management function given
the significant risks in the debt portfolio (Box 3).
Jun e 2 01 8 THE WOR LD B A NK
14Sri Lanka Development Update
Box 3: Debt management
Sri Lanka’s debt portfolio shows significant risks. While Sri Lanka’s debt level (total central government debt - 77.4
percent of GDP, 2017) and debt service (87.5 percent of revenue, 2017) are high compared to its peers, the debt portfolio
has deteriorated in several indicators in the recent past; especially, in relation to external debt. The total external debt stood
at 59.5 percent of GDP while the government external debt stock was 35.4 percent of GDP as of end 2017. Foreign-currency
denominated external debt of the central government was 50 percent of its total debt, out of which 30 percent is expected
to fall due within the next three years. Sri Lanka has the third largest gross financing requirement in 2018 at 20 percent of
GDP among emerging market economies (IMF 2017).16 Moreover, as the country approaches Upper Middle-Income
Country status, it is borrowing on more commercial terms with increased the cost and risk. The non-concessional and
commercial component of government foreign debt rose from 1 percent in 2000 to 55 percent in 2017. The interest rate
risk on foreign currency debt has risen with the share of floating-rate debt as a share of outstanding debt rising from 17 to
32 percent between 2010 to 2016. The Average time to maturity (ATM) declined while average interest rates increased.
Moreover, adequacy of reserve cover of foreign currency commercial debt deteriorated (Figure 13 and 16).
Eurobonds rollover could become a key challenge starting from 2019. Sri Lanka faces external sovereign bond
maturities from 2019 to 2023 and from 2025 to 2028 (USD 12.15 billion) (Figure 11). The situation is exacerbated by
maturing bonds of commercial banks and Sri Lankan Airlines during the period from 2018 to 2019 (approximately USD 1.8
billion). Given that large bullet repayments of more than USD 500 million are new to Sri Lanka, such payments could expose
the country to refinancing risk and could lead to higher spreads on Sri Lankan debt compared to benchmarks. Similarly,
partial rollovers of the bonds would lead to loss of reserves and exchange rate pressures.
SOE debt is a key fiscal risk. Based on available data, by end 2015, total SOE debt excluding the financial institutions was
estimated at over LKR 1.3 trillion or 12 percent of GDP (2015). While SOE financial institutions borrow both locally and
overseas based on the strength of their respective balance sheets, non-financial SOEs receive financing predominantly from
the domestic banking sector. To facilitate SOE borrowings, the Treasury issues guarantees and letters of comfort on a case-
by-case basis. In the recent years, the treasury guaranteed debt rose fast, and remained high at 6.8 percent of GDP at end-
2017. Moreover, the composition of guarantees has changed over time, with the share of guarantees given to commercially
oriented state-owned business enterprises with revenue capacity declining from 90 percent in 2006 to 40 percent in 2017
while guarantees given to state establishments, primarily dependent on the state budget for expenditures have risen. Since
the latter receive current and capital transfers to service this guaranteed debt, the government is effectively servicing this
debt. On a similar note, letters of comfort issued by the Treasury have also increased in the past few years; as of end 2017,
the total value of letters of comfort amounted to 0.7 percent of GDP (Figure 10).
In addition to portfolio related challenges, there are important structural challenges that require attention. The
fragmented institutional framework and lack of a comprehensive debt management strategy leaves the public sector exposed
to a debt portfolio with high cost and risk in the domestic market as well. The decades-old legal framework falls short in
providing a comprehensive framework for modern debt management. The Private Public Partnership (PPP) agenda may
move the direct fiscal cost of investment to the private sector, but may require the public sector to assume more fiscal risk.
Improvements in debt management will help develop the domestic financial market, and improve access to
finance. Reforms in debt management and SOEs are crucial for macroeconomic stability. Improved debt management may
better manage the interest cost and risks of government debt and support fiscal consolidation while reducing fiscal risks.
Managing liabilities actively will mitigate refinancing risks, contribute to improved investor perceptions and possible
upgrading of credit ratings. Improved debt management will also lead to deeper, more liquid domestic debt markets that
support private capital market development. Less fiscal pressure on financial markets will reduce market interest rates and
thereby the cost of financing for households and firms. Together with the expected presentation of the Secured Transactions
Registry Act, which will allow firms to pledge movable collateral for loans, this would support access to finance on reasonable
terms for the struggling SME sector. Improvement in SOE governance may reduce fiscal pressures and improve service
delivery.
The government has taken some important steps to deal with the refinancing risks; however, the progress of other
key structural reforms on debt management has been slow. To face the refinancing risks of maturing Eurobonds in
2019 and beyond, the government enacted the Active Liability Management Act and formulated a strategy. While these are
important measures to mitigate a key risk of the portfolio, other reforms need to progress. An integrated risk management
approach is needed for debt and contingent liabilities in relation to the central government, SOEs, PPPs and natural disasters.
The establishment of a unified debt management office is an important step in this direction although it has experienced
16 http://www.imf.org/en/Publications/CR/Issues/2018/01/12/Sri-Lanka-Third-Review-under-the-
Extended-Arrangement-under-the-Extended-Fund-Facility-and-45541
Jun e 2 01 8 THE WOR LD B A NK
15Sri Lanka Development Update
significant delays. A comprehensive Medium-Term Debt Strategy (MTDS) – covering both external and domestic debt – is
needed to provide guidance to manage the costs and risks of the portfolio.
Figure 13: External debt indicators Figure 14: Components of public sector debt
(Years) (Percent) (Percent of GDP)
Share of foreign currency commercial 90
debt/official reserves (RHS)
10 Average time to maturity (exernal) 250
80
9
70
8 200
60
7
6 150 50
Non-guaranteed debt of 7 SOBEs
5 40
Letters of comfort
4 100 30 Other guaranteed debt
3 20 Guaranteed debt of 7 SOBE
2 50 RDA guaranteed debt
10
1
0
0 0
2010 2011 2012 2013 2014 2015 2016 2012 2013 2014 2015 2016
Source: Central Bank of Sri Lanka Source: Ministry of Finance, annual reports of respective SOEs
Note: RDA – Road Development Authority; 7 SOBEs included in the graph are Ceylon Petroleum Corporation, Ceylon Electricity Board,
Sri Lankan Airlines, Sri Lanka Ports Authority, National Water Supply and Drainage Board, Ceylon Fertilizer Company, Airport and
Aviation Services Company.
Figure 15: Trends in the guarantee composition Figure 16: Composition of external debt stock
(LKR billion) (Percent of GDP) (Percent of total)
Concessional Non-concessional Commercial
CPC CEB 100%
1000 8
RDA Others 90%
900 Share of GDP 7 80%
800
6 70%
700
60%
600 5
50%
500 4 40%
400 3 30%
300 20%
2
200 10%
100 1
0%
2011
2005
2006
2007
2008
2009
2010
2012
2013
2014
2015
2016
2017
0 -
2011 2012 2013 2014 2015 2016 2017
Source: Ministry of Finance, Central Bank of Sri Lanka, Sri Lankan Source: Central Bank of Sri Lanka
Airlines, staff calculations.
Note: CEB – Ceylon Electricity Board, CPC – Ceylon Petroleum
Corporation, RDA - Road Development Authority. RDA and other
entities may not have stable revenue streams.
Mixed external sector performance, but recent capital inflows led to improvement of reserves.
A rise in imports and Rising oil prices and increased imports of food and petroleum due to the drought
decelerating offset the growth in exports, which was led by a recovery of the tea industry. In fact,
remittances widened the non-oil trade deficit improved; however, the sharp rise in the oil bill masked this
the current account improvement and resulted in a widened trade deficit for 2017. Although growth in
deficit
Jun e 2 01 8 THE WOR LD B A NK
16Sri Lanka Development Update
tourism flows, albeit at a slower pace,17 continued to ease external pressures, the
decline in worker remittances and an elevated trade deficit led to an expanded deficit
in the current account at 2.6 percent of GDP in 2017, up from 2.1 reported in 2016.18
Debt-creating flows Although FDI reached an all-time high at USD 1.7 billion19 from a low base thanks
dominated the to the long leasing of the Hambantota port and the Colombo Port City project, loan
financial account receipts and portfolio receipts continued to be the main sources of financing the
deficit. While the government securities market started attracting net inflows after a
period of outflows, issuance of sovereign bonds worth of USD 1.5 billion,20 receipts
of USD 1.5 billion in project loans and foreign currency term financing of USD 1.0
billion were the key inflows to the financial account in 2017 (Table 6).
Figure 17: External reserves Figure 18: Exchange rate depreciation
(USD million) (Percent)
Gross official reserves
Reserves net of swaps and ISBs 16 2018 April (month-on-month)
12,000 Reserves net of short-term liabilities
12 January 2017 to March 2018
10,000
8,000 8
6,000 4
4,000
0
2,000
- -4
(2,000) -8
(4,000) -12
Pakistan
Thailand
India
South Korea
Sri Lanka
Malaysia
Philippines
Indonesia
(6,000)
(8,000)
Sep-14
Sep-15
Sep-16
Sep-17
May-14
May-15
May-16
May-17
Jan-14
Jan-15
Jan-16
Jan-17
Jan-18
Source: Central Bank of Sri Lanka, staff calculations. Source: Bank of International Settlement, Central Bank of Sri Lanka,
staff calculations.
Note: Negative numbers represent depreciation.
Reserves reached an Supported by increased capital inflows, the central bank continued to strengthen
all-time-high in April reserves through purchases in the forex market21 helping the gross official reserves to
2018 on account of reach USD 8 billion by end-December 2017.22 With a further boost received from
capital flows new sovereign bonds issued in April 2018,23 official reserves reached an all-time-high
at USD 9.9 billion by end-April. However, foreign exchange obligations for the 12
months starting from May 2018 are estimated at USD 8.0 billion (including a
Eurobond of USD 1.0 billion maturing in January 2019), implying that official
17 Growth in tourism receipts decelerated to 12 percent, year-on-year, in 2017 compared to 18 percent
in 2016, reportedly due to the limited access provided by the country’s main airport through to April on
account of renovation activities and a Dengue breakout that kept tourists away.
18 During the year, remittances shrank on a year-on-year basis, indicating the adverse economic
conditions in the Middle East. This region generates over 50 percent of Sri Lanka’s remittances.
19 Equivalent to 2.0 percent of GDP.
20 Sri Lanka issued its eleventh sovereign bond worth USD 1.5 billion (10-year) in May 2017. The coupon
rate of 6.20 percent reflected a spread of 380 bps over the US Treasury rate for a 10-year security. The
issuance rated ‘B1’, ‘B+’ and ‘B+' by Moody's Investors Service, Standard and Poor’s and Fitch, attracted
bids over USD 11 billion achieving an oversubscription ratio of over 7 times.
21 Between March 2017 and April 2018, the central bank purchased over USD 2.4 billion.
22 Equivalent to 4.6 months of merchandise imports.
23 Sri Lanka issued its twelfth sovereign bond worth USD 2.5 billion in two tranches of 1.25 each with
maturities of 5-years (coupon at 5.75 percent) and 10-years (coupon at 6.75 percent) in April 2018. The
issuance rated ‘B1’, ‘B+’ and ‘B+' by Moody's Investors Service, Standard and Poor’s and Fitch attracted
bids over USD 6.5 billion together.
Jun e 2 01 8 THE WOR LD B A NK
17Sri Lanka Development Update
reserves net of short-term liabilities are low. About USD 1.0 billion of these liabilities
represent swap arrangements with domestic banks (which issued medium-term
international bonds), some of which will be maturing later this year (Figure 17).24
Rating agencies Citing the progress made on fiscal consolidation, the continuation of the IMF
revised Sri Lanka’s program and expected reforms on liability management, Fitch and S&P revised the
outlook to stable country’s outlook from negative to stable. Previously, both rating agencies
downgraded Sri Lanka in 2016 on fiscal and external imbalances. However, Moody’s
continues to have a negative outlook.
Box 4: Cost-reflective pricing of fuel
Introduction of the fuel price formula is an important measure towards reducing fiscal risks. In May 2018, the
government approved a price formula, which adjusts retail fuel prices every two months, in line with a key structural
benchmark of the IMF supported program. In the past, fuel retail prices were administratively fixed with the cost per liter –
mainly determined by the global oil prices - often above the retail price. This led to an implicit subsidy, which mainly benefits
the top-30 percent of the population through direct and indirect consumption, funded by accumulating losses at the Ceylon
Petroleum Corporation (CPC).25 The losses that accumulate at the CPC have been reflected in large borrowings from the
state banks, leading to implicit and explicit contingent liabilities for the government. As of end 2017, the total debt of CPC
was equivalent to 2.5 of GDP, of which 1.5 percentage points of GDP was guaranteed by the state Treasury, while it had
accumulated operational losses amounting to 1.6 percent of GDP.
Cost-reflective pricing of fuel will make the CPC less vulnerable to global oil shocks and bring in additional
benefits to the economy. While it was negative due to low global prices in 2016, the CPC estimates the total subsidy on
fuel products for 2017 at LKR 31.7 billion, equivalent to 0.2 percent of GDP, due to increased prices in global markets.
Given global oil prices that have been on the rise since the second half of 2017, 26 after three years of muted growth, the
switch to cost-reflective prices that adjust every two months will result in a significantly lower subsidy (there will still be a
positive subsidy as long as market prices trail continuously increasing global prices) while washing out high frequency price
movements. By lowering the borrowing requirements of the CPC, the price reforms will significantly reduce the fiscal risk
posed by the CPC.
Implementation of the formula will mainly have positive externalities. As the retail prices increase in line with the
global market, producers and consumers will be encouraged to use fuel more efficiently and explore alternative sources of
energy, which may reduce greenhouse gas emissions. Importantly, any reduction in the volume of petroleum imports will
help reduce the import bill and the country’s vulnerability to global oil shocks. In the past, increased volumes of petroleum
imports due to droughts and increased motor vehicle fleet worsened external balances. For example; in 2017, the rise in
petroleum imports was the key contributor to the expansion of trade deficit leading to a larger current account deficit.
Moreover, with the implementation of the formula, fiscal policy will become more progressive as the benefit accrued to the
top-30 percent is removed.
The removal of the fuel subsidy is a progressive measure, even after accounting for indirect effects, but the poor
and vulnerable (the bottom 40 percent) still face an increase in the cost of living. With the introduction of the pricing
formula, prices increased by 15.6 percent for petrol 92, 14.1 percent for auto diesel, and 106 percent for kerosene, though
the price of kerosene was subsequently revised downward from LKR 101 per liter to LKR 70. The overall impact of the
price shocks is progressive, with higher income groups bearing a larger share of the burden, given their higher consumption
24 The central bank has already indicated that it plans to settle some of the swaps, which were rolled over
in the past. Some of the underlying Eurobonds expected to mature in the coming year include National
Savings Bank USD 750 million, Bank of Ceylon USD 500 million, and DFCC Bank USD 100 million.
25 The state petroleum duopolist, which has a share of 86 percent in the retail market.
26 An agreement between most of the members of the Organization of the Petroleum Exporting
Countries (OPEC) and some non-OPEC oil producers to extend production cuts to the end of 2018
boosted global oil prices in late 2017 and early 2018. Accordingly, oil prices increased above USD 65 per
barrel (bbl) reaching a three-year high over the first five months of 2018. While the reinstatement of
sanctions on Iran by the United States in May 2018 has already added upward pressure, geopolitical
tensions in the Middle East and North Africa could further increase oil prices. Downside risks reflect
the possibility of faster-than-expected U.S. shale production due to further technological improvements,
or an earlier-than-anticipated end to the OPEC/non-OPEC cuts, which could be decided at the
upcoming June 22 OPEC meeting.
Jun e 2 01 8 THE WOR LD B A NK
18You can also read