The River Club: An analysis of the potential of the property market (update to 2016 report)
←
→
Page content transcription
If your browser does not render page correctly, please read the page content below
The River Club:
                      An analysis of the potential
                        of the property market
                       (update to 2016 report)

                                  Prepared for:
                     SRK Consulting (South Africa) (Pty) Ltd.
                                           28 November 2017

EG Rode
BA MBA (Stell)
Registered as a Professional Valuer with the SA Council for the Property Valuers Profession
Fellow of the SA Institute of Valuers
Eminent fellow of the Royal Institution of Chartered Surveyors

S van der Walt
MA (Stell)

JS Lottering
M.Com (UWC)

JNB Gericke
BA, BA Hons, B Ed, MBA (Stell)

C Jacobs (Exquisite Hotel Consultants)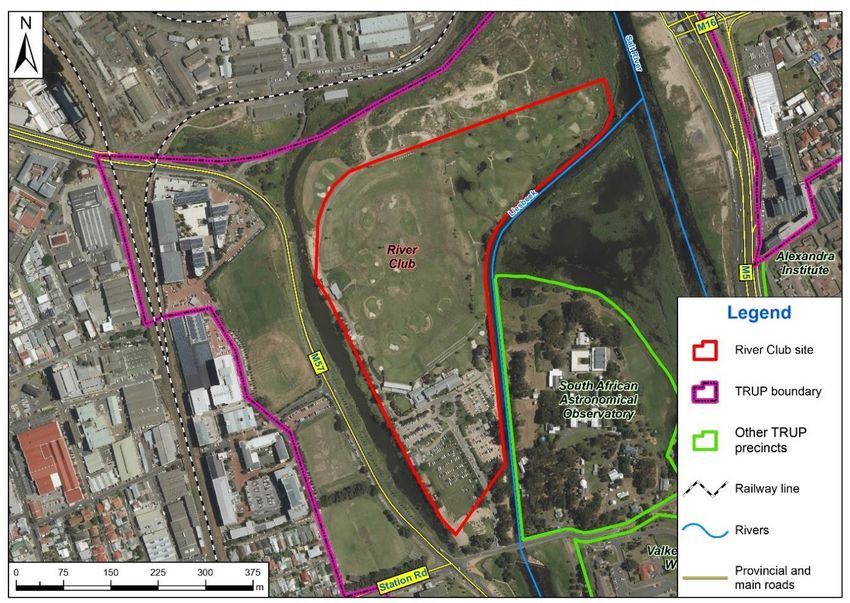
Contents
1. Introduction .............................................................................................................. 1
2. Report structure ........................................................................................................ 1
3. Brief and scope of work .............................................................................................. 1
4. Methodology and sources of data ................................................................................. 2
5. Location of the River Club within Two Rivers Urban Park (TRUP) ...................................... 3
6. Socio-economic and demographic profile of the population in the study area ..................... 6
6.1 Aligning the study areas and available statistics ..................................................................................................... 6
6.2 Socio-economic and demographic profile ................................................................................................................ 6
6.3 Dwellings and tenure status ..................................................................................................................................... 8
6.4 Economic and employment base of the City of Cape Town ..................................................................................... 8
7. Property-market analysis .......................................................................................... 10
7.1 Where are we in the long property cycle?.............................................................................................................. 10
7.1.1 The office and industrial property cycles ....................................................................................................... 11
7.1.2 The residential-property cycle ....................................................................................................................... 13
7.2 Office property market ........................................................................................................................................... 14
7.2.1 Site context .................................................................................................................................................... 14
7.2.2 Current size and vacancy rates of the Cape Town office-property market.................................................... 15
7.2.3 Historic office-rental growth rates ................................................................................................................. 16
7.2.4 Current office rentals ..................................................................................................................................... 17
7.2.5 Capitalization rates ......................................................................................................................................... 18
7.3 Residential market ................................................................................................................................................. 18
7.3.1 Site context .................................................................................................................................................... 18
7.3.3 Trends in Cape Town flat rentals.................................................................................................................... 22
7.3.4 Current property market conditions in the vicinity of the River Club ............................................................ 23
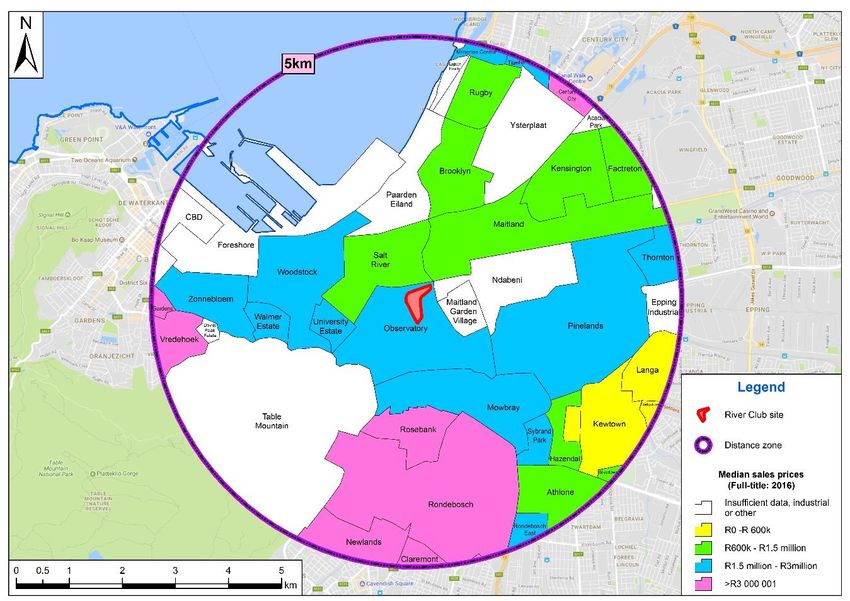
7.3.5 Residential transfers in the study area ........................................................................................................... 24
7.4 Student-housing potential...................................................................................................................................... 28
7.5 Retail analysis ........................................................................................................................................................ 30
7.5.1 Site context .................................................................................................................................................... 30
7.5.2 The operating environment ........................................................................................................................... 31
7.5.3 Determining retail supply and demand.......................................................................................................... 33
7.5.3.1 Retail supply-side ........................................................................................................................................ 33
7.5.3.2 Retail demand ............................................................................................................................................. 35
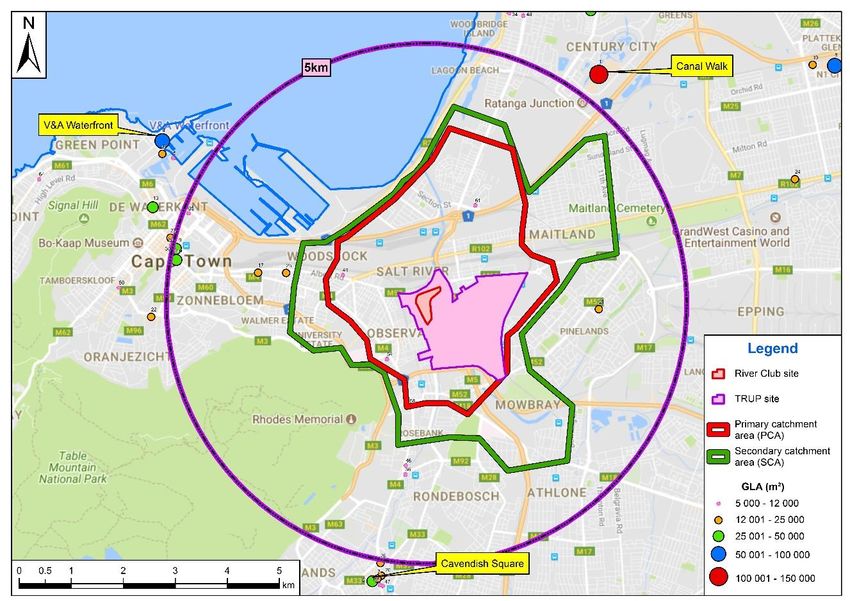
7.5.3.3 Delimiting catchment areas ........................................................................................................................ 36
7.5.3.4 Demographic characteristics of the catchment areas ................................................................................. 37
7.5.3.5 Potential for upward mobility through house price growth and property development ........................... 38
7.5.3.6 Market potential assessment ...................................................................................................................... 39
7.5.3.7 Development potential summary ............................................................................................................... 39
7.6 Suitability of the site for a hotel ............................................................................................................................. 40
8. Property market forecasts ......................................................................................... 42
8.1 Introduction............................................................................................................................................................ 42
8.2 Office market forecasts .......................................................................................................................................... 44
8.2.1 Forecast of office vacancies and rentals ........................................................................................................ 44
8.2.2 Office demand and take-up for the River Club site’s vicinity ......................................................................... 45
8.3 Residential market forecasts .................................................................................................................................. 47
8.3.1 Forecast of house prices and flat rentals ....................................................................................................... 47
8.3.2 Forecast demand for residential property in the vicinity of the River Club ................................................... 47
   8.4 Factors that may affect our property forecasts ..................................................................................................... 51
      8.4.1 General factors ............................................................................................................................................... 51
      8.4.2 Impact of the new economy and the Fourth Industrial Revolution ............................................................... 51

9. Opportunity cost of development at the River Club site ................................................. 54

10. Conclusions ........................................................................................................... 55

11. References ............................................................................................................ 58
Figures

Figure 5.1 Location of the River Club site within the greater Two Rivers Urban Park (TRUP) ................... 3

Figure 5.2 The various precincts of Two Rivers Urban Park (TRUP), including the River Club ................... 4

Figure 5.3 The River Club site ........................................................................................................ 5

Figure 6.1 CoCT planning districts and the 5-km concentric zone surrounding the River Club ................. 6

Figure 7.1 Why such a long property cycle? ................................................................................... 11

Figure 7.2 The office property cycle .............................................................................................. 12

Figure 7.3 The industrial-property cycle ......................................................................................... 12

Figure 7.4 Growth in real GDP: Consensus vs Junk scenario ............................................................. 13

Figure 7.5 National house-price cycle ............................................................................................ 14

Figure 7.6 Location of office nodes in the vicinity of the River Club .................................................... 14

Figure 7.7 Share of total grades A and B office stock in Cape Town (a) 2007, and (b) 2017 ................. 16

Figure 7.8 Capitalization rates in prime Cape Town decentralized office nodes .................................... 18

Figure 7.9 Growth in national house prices vs growth in value of new mortgage loans ......................... 20

Figure 7.10 Growth in value of new mortgage loans vs yearly change in unemployment rate ............... 21

Figure 7.11 Movement in national nominal flat rentals ..................................................................... 22

Figure 7.12 Historic and forecast flat rental growth in suburbs close to the River Club site ................... 23

Figure 7.13 Median days listed before residential property is sold ..................................................... 23

Figure 7.14 Median difference between sales and listed price ........................................................... 24

Figure 7.15 Residential transfers (2016) in the 5-km zone for all price categories ............................... 25

Figure 7.16 Median full-title sales prices (2016) in the 5-km zone ..................................................... 26

Figure 7.17 Median sectional-title sales prices (2016) in the 5-km zone ............................................. 27

Figure 7.18 Median residential (full and sectional-title) sales prices (2016) in the 5-km zone ............... 27

Figure 7.19 Retail supply in 5km and 10km radii from the River Club ................................................ 34

Figure 7.20 Retail supply and connectivity within 2 km and 5 km from the River Club ......................... 35

Figure 7.21 Retail (a) expenditure (rands); (b) GLA (m²); and (c) expenditure per m² ........................ 36

Figure 7.22 The primary and secondary catchment areas (PCA & SCA) .............................................. 37

Figure 8.1 Growth in office demand and services sector output ......................................................... 44

Figure 8.2 Growth in office demand and business confidence............................................................ 44

Figure 8.3 Office rental forecasts .................................................................................................. 45

Figure 8.4 Cumulative demand (a) and take-up (b) forecasts for grades A and B office space .............. 46

Figure 8.5 Historic and forecast new residential demand (flats) in the CoCT ....................................... 48
Tables

Table 6.1 A socio‐demographic profile of the study areas ................................................................... 7

Table 6.2 Tenure status of households by type of main dwelling ......................................................... 8

Table 6.3 Historic and forecast CoCT sectoral GDPR growth................................................................ 9

Table 7.1 Real GDP forecasts: Consensus vs Junk scenario .............................................................. 13

Table 7.2 Cape Peninsula office stock and vacancies by node as in 2017 (Q2) .................................... 15

Table 7.3 Cape Town 5-and 10-year grade A office-rental growth rates ............................................. 17

Table 7.4 Cape Peninsula grade-A market-rental rates for office buildings .......................................... 17

Table 7.5 Growth in nominal house prices by city (ex FNB) .............................................................. 19

Table 7.6 Growth in nominal house prices at Cape Town suburb level ................................................ 20

Table 7.7 Estimated monthly rentals for student accommodation in 2017 .......................................... 29

Table 7:8 Retail types, GLA and distance to the River Club by zone ................................................... 34

Table 7.9 Households & population by household income group ........................................................ 38

Table 7.10 Population of the catchment areas by income group ........................................................ 38

Table 7.11 Total River Club Mall market potential estimate for turnover and trading space ................... 40

Table 8.1 Survey of macroeconomic forecasts ................................................................................ 42

Table 8.2 Forecast summary of the critical variables ....................................................................... 43

Table 8.3 Forecast of real growth .................................................................................................. 43

Table 8.4 Forecast summary of the critical variables ....................................................................... 43

Table 8.5 Summary of office space forecasts for the River Club site’s vicinity ..................................... 46

Table 8.6 Proposed office space area schedule ............................................................................... 47

Table 8.7 City of Cape Town: residential space completed (1997-2016)............................................. 48

Table 8.8 New residential demand (flats) forecasts (m2) .................................................................. 49

Table 8.9 City of Cape Town residential demand apportionment for the various zones ......................... 50

Table 8.10 Proposed residential space schedule .............................................................................. 50
i

                    Acronyms and abbreviations

BER     Bureau for Economic Research (at Stellenbosch University)
BCI     Building Cost Index
CBD     Central business district
CoCT    City of Cape Town
GDPR    Regional gross domestic product
GBA     Gross building area of a building
GLA     Gross lettable area (rentable area as defined by Sapoa)
mn      million (to differentiate it from the abbreviation of metre)
PCA     Primary catchment area
PRASA   Passenger Rail Agency of South Africa
SACSC   South African Council for Shopping Centres
SCA     Secondary catchment area
TRUP    Two Rivers Urban Park, which includes the River Club when broadly defined
WCG     Western Cape Government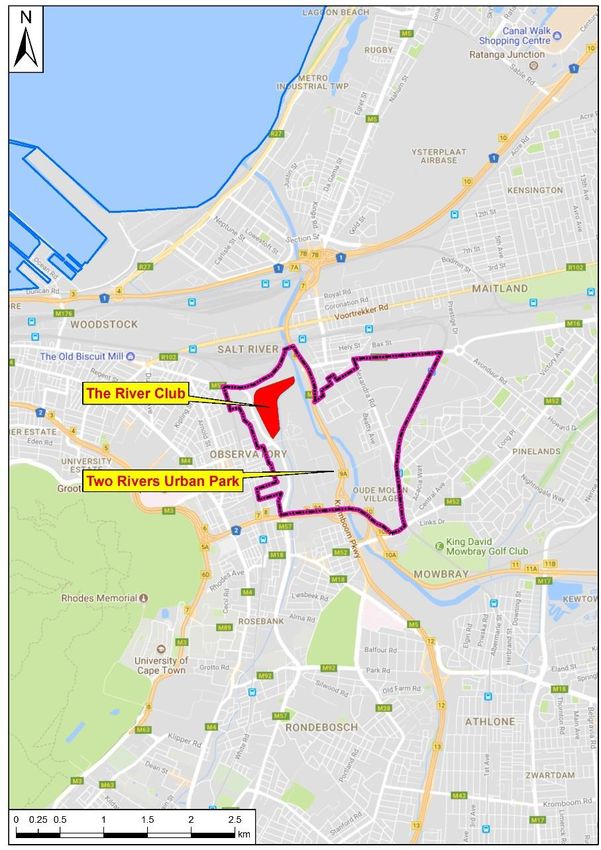
ii

                                Executive Summary

This report is an update of a similar report completed in May 2016 for the River Club. It
deals with the proposed redevelopment of the River Club, which in turn forms part of the
proposed greater Two Rivers Urban Park (TRUP) development. It provides an updated
analysis of the short- and long-term market conditions that are expected to influence the
proposed River Club property development in the Cape Town metropolitan area.

The analysis focuses on the location and the socio-demographic characteristics of people
within a 5-km radius of the subject development. The study also examines the economic
base of Cape Town and the possible implications for the city’s built environment (indirectly
including the River Club site).

The study concludes that the River Club redevelopment offers an opportunity to potentially
absorb an unknown share of a forecast 27 000 m2 of new office space per annum. The
extension of the M16 (Berkley Road) would hypothetically positively influence the capture
rate of this space as it would potentially provide excellent frontage to office buildings and
improve general accessibility to the site.

The proposed residential component would also complement proposed uses on the site in
a mixed-use environment. The analysis reveals that under respectively base-case and
highly-optimistic scenarios annually upwards of between 14 000 m2 and 48 000 m2 of
residential space could be taken up in the subject development. However, potential nega-
tive perceptions, emanating from the flooding potential, could possibly negatively affect
the sales tempo (irrespective of whether the latter would be addressed by the devel-
oper(s)).

The study also found that the site is suitable to accommodate retail space in the order of
20 000 m2 and a 150-room full-service 4-star hotel.

The River Club redevelopment would be complementary to the greater TRUP development
(of which it forms part). Thus, it would assist in providing jobs, shopping space and hous-
ing to the broader TRUP population and could become a desirable destination to live and
work. A successful, well-maintained development would also improve the utility of, and
the perception regarding, TRUP. It is thus the view of the researchers that the proposed
development would on a net basis greatly add qualitative value to society compared to
keeping the site as it currently is.

On the balance of factors and considering the available information, the development of
River Club development would thus be desirable.

It is important that the analysis provided in this report should be seen as a market estimate
based on general market trends. The study does not attempt to test the marketability or
financial viability of specific highest-and-best-use scenarios.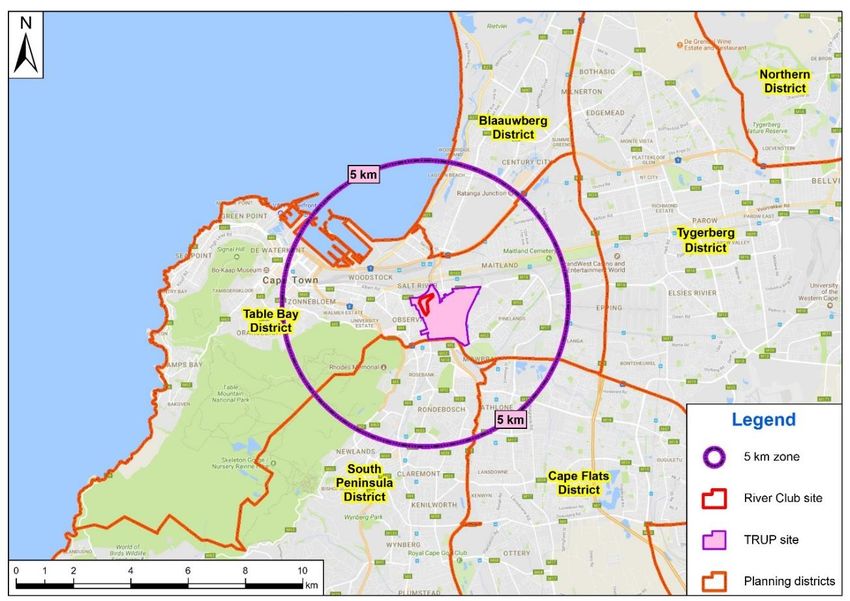
1

1. Introduction

In May 2016, we completed a report which addressed the prospects for various property
types foreseen to be erected on the redeveloped River Club site located in the Table Bay
District of the City of Cape Town (CoCT)

Given the changes in macro-economic conditions since our original report was prepared, it
was deemed necessary to update it in order to ascertain the impact of current market con-
ditions on certain sectors of the property market in general and the River Club site in partic-
ular.

The current report again considers the property-market potential of the River Club develop-
ment. The development is a partnership between Indigo Properties and Zenprop. These two
entities have formed a partnership called the Liesbeek Leisure Properties Trust (LLPT) as a
development vehicle to undertake the project. The overarching aim of the River Club devel-
opment is to transform the site into a dynamic mixed-use precinct. It is anticipated that the
development will become a ‘destination place’ and thus contribute in a catalytic fashion to
the greater Two Rivers Urban Park (TRUP) development, of which it also forms part (see
Figure 5.1).

2. Report structure

This report is structured in the following manner:

Section 3:    Setting the scene by describing the brief and indicating the scope of work;
Section 4:    An overview of the methodology utilised and the sources of data in the compi-
              lation of the report;
Section   5: Providing a brief description of the study area, i.e. contextualising the ‘lie of
              the land’;
Section   6: Analysing and discussing the socio-demographic profile of people and house-
              holds in the vicinity of the River Club site;
Section   7: Analysis of the property market, nationally and also specifically to the site and
              its catchment area;
Section   8: Providing property market forecasts, where appropriate;
Section   9: Determining the (non-quantified) opportunity cost of the development from a
              societal point of view if development were not to proceed
Section   10: Conclusions

3. Brief and scope of work

The River Club in Cape Town is currently engaged in an environmental impact assessment
(EIA) in terms of the National Environmental Management Act (NEMA), as well as a rezoning
process for the redevelopment of the River Club site. As part of the EIA process, a property
market analysis is required to ascertain the prospects for various property types foreseen to
be erected on the site. The proponent (LLPT) seeks to use the report to motivate the eco-
nomic desirability of the site in terms of location and time.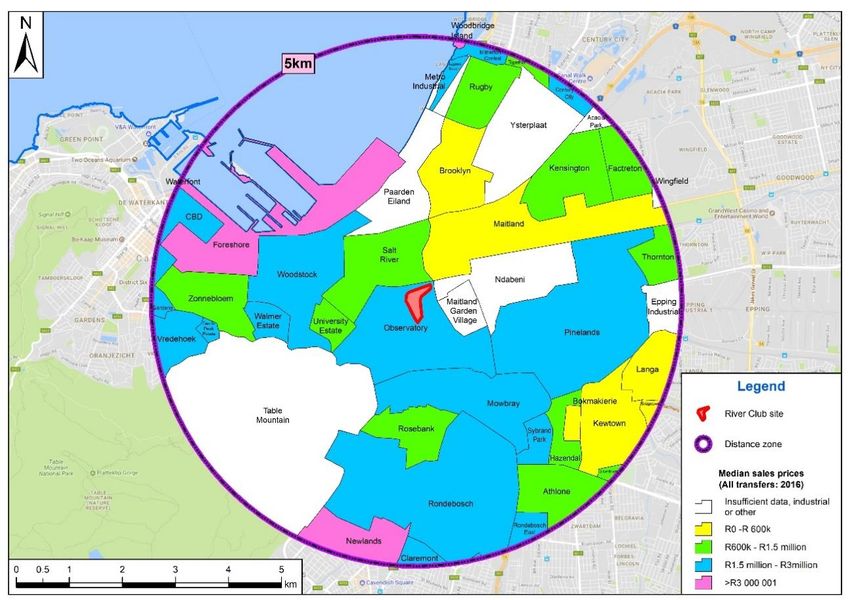
2
This report thus provides an analysis and assessment of property market activities appropri-
ate to the site, given the vision for the River Club, and includes the following objectives:
Analyse the market demand for the amount of commercial, retail, hotel, office and
residential bulk proposed (i.e. is there, in this part of the city, demand for the pro-
posed development or, with the anticipated growth of the City, is there expected to
be a demand over time);
Investigate the delivery to the market of the proposed bulk in phases over time, and
give an indication of the development/ bulk quantum that can be absorbed by the
market in the various phases;
Analyse the River Club’s suitability as a location for new development to meet this
demand;
Investigate the effect on property prices and rent in surrounding areas;
Research the opportunity cost of not developing the site (i.e. lost benefit of the site
as a publically accessible open space used for recreational activities, as compared with
the status quo, i.e. the under-utilisation of valuable well-located, highly accessible
land within the urban edge);
Consider the link between the site and the TRUP (narrowly defined), and comment on
the (commercial) development potential of the site in relation to TRUP (narrowly de-
fined); and
Consider the development of the site as a catalyst to develop TRUP (narrowly defined).
4. Methodology and sources of data
In fulfilling the study objectives stated above, our research methodology is in brief as follows:
Analysis of the River Club’s locational characteristics and its relationship to the greater
Two Rivers Urban Park (TRUP) site;
Exploration of the economic and demographic base of the relevant catchment area;
Examination of national economic trends;
Discussion of long office-, industrial- and residential-property cycles
Analysis of current and historic property prices and rentals;
Investigation of the current and historic demand of various property types;
Investigation of the current and historic supply of various property types;
Forecasts of demand, take-up and market rentals
This work is based on an analysis of the following data sources:
The Population Census 2011 and other socio-demographic data;
Determining where we are in the property cycle. This was sourced from Rode’s SA
Property Trends (June 2017), a publication compiled through Rode & Associates’ own
primary research;
Interrogating Rode & Associates’ in-house database and also analysing SAPOA data
to ascertain the prevailing market conditions (rentals and vacancy rates) for the office
nodes and residential areas closest to the subject property, and to perform forecasts
of key variables. The retail analysis was performed using Census 2011 statistics and
data from the SA Shopping Centre Directory (2015). Regarding the residential market,
we also sourced residential sales prices and trends from Lightstone and PropStats;
Obtaining the research inputs of property specialists in the retail and hospitality fields;
and
Conducting structured interviews where required with property specialists.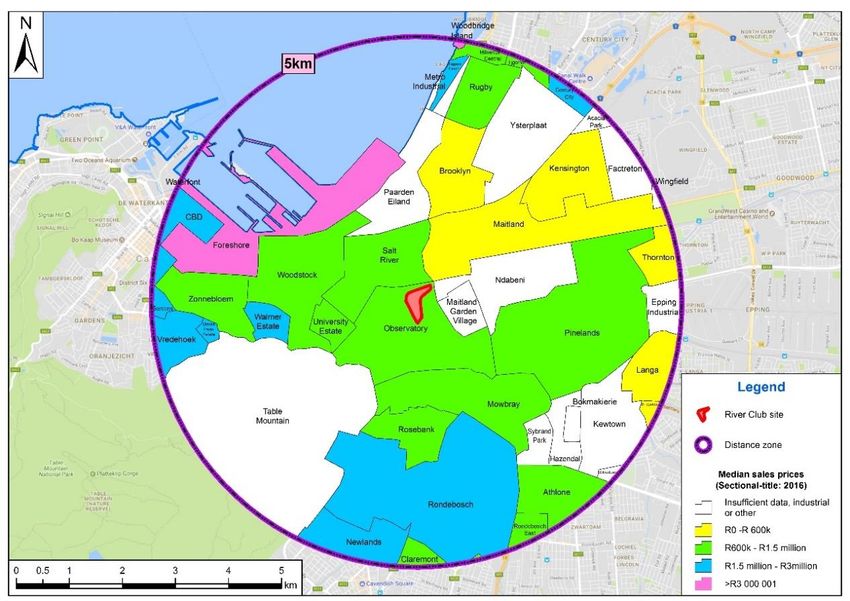
3
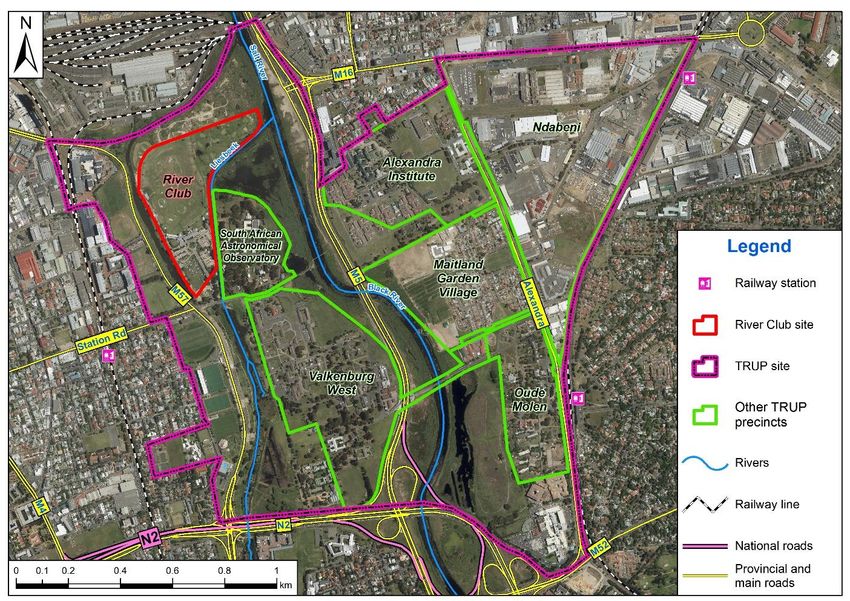
5. Location of the River Club within Two Rivers Urban Park (TRUP)
The River Club is located within the greater TRUP site about 8 km from the Cape Town CBD
(see Figure 5.1). TRUP includes various precincts and areas with diverse, and mainly unre-
lated, functions. These are (see Figure 5.2):
The River Club;
Alexandra Precinct (WCG-owned with Alexandra Hospital as primary tenant);
Maitland Garden Village (a local residential suburb);
Oude Molen Precinct (owned by the WCG and includes a wide range of uses in the old
hospital buildings such as private schools, lodges, and restaurants.);
Ndabeni Precinct (this is mainly an industrial area. However, there are properties in
this precinct which are owned by the CoCT and that present development opportuni-
ties); and
Floodplains and wetlands forming the Liesbeek and Black River Green Corridors. Land
within these corridors are mainly owned by the CoCT.
Figure 5.1 Location of the River Club site within the greater Two Rivers Urban Park (TRUP)4
Many of these precincts are occupied by long-established tenants. The relatively permanent
and functionally fragmented occupancy of the site would possibly complicate future planning
of TRUP as a whole.
Figure 5.2 The various precincts of Two Rivers Urban Park (TRUP), including the River Club
Natural and man-made barriers formed by the rivers and the M5 motorway split TRUP in
various distinct areas. There are no generally accessible major roads that link these seg-
ments, and rapid internal movement between the various areas on the site is thus not pos-
sible. The mooted extension of the M16 (Berkley Road) westwards over the Black/Salt rivers
to the northern extremity of the River Club would be a key intervention that would greatly
improve accessibility to and from the River Club site.
Other than the M5, TRUP (wider definition) is intersected and bounded by various other im-
portant roads, which are depicted in Figure 5.2. These are the M57 (Liesbeek Parkway), the
M16 (Berkley Road), Alexandra Road and the M52 (Forest Drive). External access to the site
is thus relatively easy from all directions. There are also two railway lines on the eastern and
western boundaries of the site and three train stations (Ndabeni, Observatory and Pinelands)
in the vicinity.
Although it is located within an urban setting, the TRUP site is inextricably tied to the natural
environment as well. The natural elements include the scenic views of Devil’s Peak and the
Table Mountain range, the Black and Liesbeek Rivers and associated Raapenburg, Valkenburg
and Vincent Pallotti wetlands, the topography of the landscape, which includes the river val-
leys and middle ridges which spatially divide TRUP (CoCT 2003: 11). These natural amenities
afford the site a unique character. Additionally, the TRUP (broad definition) has significant5
heritage value in that it forms part of, or borders on, the first free-burgher farms allocated
in 1657. As such, it can be argued, this is where the colony of the Cape of Good Hope, and,
therefore, South Africa, started.
The River Club site itself is located at the confluence of the Black and Liesbeek Rivers (see
Figure 5.3) and is about 15 hectares in extent. The site is well located in light of its proximity
to the CBD, the Tygerberg area and southern suburbs.
Figure 5.3 The River Club site
The River Club site creates the impression of being an island in the middle of the neighbouring
built-up area as it is surrounded by water almost on all sides and is relatively undeveloped.
The only access to the site currently is at the southwestern boundary of the property via the
M57 (Liesbeek Parkway). The site is relatively close to the Observatory railway station (see
Figure 5.2), which serves the busy Simon’s Town line. Directly to the east of the site lies
the South African Astronomical Observatory set of buildings, while to the west lies the original
Liesbeek River course, which was cut off when the river was canalized along the site’s eastern
boundary, and now forms a stagnant backwater of the Black River.
Beyond this channel are sports fields and the Black River Park business park (Planning Part-
ners 2016:2), while further north of the River Club site lies vacant land owned by PRASA,
beyond which is the PRASA railyard (outside the boundaries of TRUP). The site is currently
occupied by The River Club Golf & Conference Centre, which includes a number of confer-
ence/function facilities, a restaurant, a nine-hole mashie course, golf shop and driving range,
as well as internal roads and parking areas. The largest part of The River Club site comprises
open, partly landscaped areas with grass and planted trees, i.e. the golf driving range and
golf course (Planning Partners 2016: 2).6
6. Socio-economic and demographic profile of the population in the
study area
6.1 Aligning the study areas and available statistics
The approach adopted for the preparation of the socio‐economic and demographic profile of
communities within the area that surrounds the River Club site entailed analysis of Census
2011 sub-places within a 5-km concentric circle from the centre point of the River Club site.
We used this approach because of the need to understand the socio-demographic impact of
residents within the immediate vicinity of the site. Our choice of the 5-km zone as a study
area is based on the observation of population distribution, economic activities and likely
sources of procurement and labour in the areas surrounding the proposed River Club devel-
opment. We have also included data for the Table Bay District of the City of Cape Town for
purposes of comparison (the River Club site is located in this administrative district).
Figure 6.1 is a depiction of the River Club site’s location in the TRUP, the various planning
districts surrounding the site (including the Table Bay District) and the 5-km concentric zone.
Figure 6.1 CoCT planning districts and the 5-km concentric zone surrounding the River Club
6.2 Socio-economic and demographic profile
The following socio‐demographic profile of the various areas surrounding the study area is
based on data from the 2011 Census. A summarised socio‐demographic profile is presented
in Table 6.1.1
1
The analysis by race group may, in principle, be unacceptable to some readers. However, we take the pragmatic
route, considering that it is national policy to promote ‘inclusionary’ housing, which presumably means greater
integration of race groups and socio-economic strata. Thus, we feel the data in Table 6.1 are of practical value.7
It is apparent that the 5-km zone has a lower total population compared to the Table Bay
District, namely around 162 000 versus 206 000. The population of the CoCT was estimated
at 2 892 243 in 2001 and 3 740 026 in 2011, representing an average annual growth of
2,6%.
An analysis based on the 5-km concentric zone suggests that over 75% of the population
residing within this area are non-white, while in the Table Bay District non-whites comprise
a similar proportion (about 73%) of the population. In the CoCT, almost 39% of people are
Black, slightly more than 42% Coloured, and nearly 16% White. Males and females are al-
most equally split in the 5-km zone, the Table Bay District and the CoCT. It is evident in the
5-km zone that 52% of the population is below 30 years of age, while this figure is mirrored
in the Table Bay District at 51% and the CoCT at almost 56%.
Based on the above analysis it is thus evident that the River Club site is located in a relatively
young, multi-racial area. This is important as it provides an indication of the socio-demo-
graphic characteristics of the population that would at least partially underpin the demand
for space at the River Club.
Table 6.1 A socio‐demographic profile of the study areas
(based on Census 2011)
5-km zone Table Bay District CoCT
Population group Number % Number % Number %
Black 36 890 22,8% 86 469 41,9% 1 444 939 38,6%
Coloured 73 780 45,5% 53 505 25,9% 1 585 286 42,4%
Asian 5 389 3,3% 4 657 2,3% 51 786 1,4%
White 40 177 24,8% 54 981 26,7% 585 831 15,7%
Other 5 831 3,6% 6 685 3,2% 72 184 1,9%
Total 162 067 100% 206 298 100% 3 740 026 100%
Gender Number % Number % Number %
Male 79 531 49,1% 100 859 48,9% 1 830 699 48,9%
Female 82 536 50,9% 105 439 51,1% 1 909 327 51,1%
Total 162 067 100% 206 298 100% 3 740 026 100%
Age classification Number % Number % Number %
0-18 38 548 23,8% 47 273 22,9% 1 161 374 31,1%
19-30 46 050 28,4% 58 147 28,2% 926 123 24,8%
31-40 23 741 14,6% 35 440 17,2% 592 673 15,8%
41-50 19 360 11,9% 24 004 11,6% 454 916 12,2%
51-65 21 177 13,1% 25 444 12,3% 415 435 11,1%
Over 65 13 191 8,1% 15 990 7,8% 189 505 5,1%
Total 162 067 100% 206 298 100% 3 740 026 100%8
6.3 Dwellings and tenure status
An examination of Table 6.2 reveals that only 2,4% of households in the 5-km zone live in
informal housing,2 while slightly more than 97% reside in formal housing.3 A significantly
larger percentage (11,3%) of households in the Table Bay District live in informal housing
and nearly 88% in formal housing. Compared to these two areas, the CoCT has a substantially
larger proportion (almost 21%) of people living in informal housing, and as a result a smaller
percentage staying in formal housing (about 78%).
Regarding tenure, it is apparent that about 47% of households in the 5-km zone rent their
dwellings, a proportion matched in the Table Bay District. Interestingly, in the CoCT only
about 30% of households rent their homes.
Table 6.2 Tenure status of households by type of main dwelling
5-km zone
Informal % Formal % Other % Total %
Rented housing
570 1,2% housing
21 788 45,2% 125 0,3% 22 483 46,6%
Owned but not yet paid off 46 0,1% 10 457 21,7% 32 0,1% 10 535 21,9%
Occupied rent-free 268 0,6% 829 1,7% 3 0,0% 1 100 2,3%
Owned and fully paid off 176 0,4% 12 929 26,8% 18 0,0% 13 123 27,2%
Other 86 0,2% 842 1,7% 29 0,1% 957 2,0%
Total 1 146 2,4% 46 845 97,2% 207 0,4% 48 198 100,0%
Table Bay District
Rented 1 976 2,8% 30 935 44,1% 192 0,3% 33 103 47,2%
Owned but not yet paid off 110 0,2% 11 424 16,3% 117 0,2% 11 651 16,6%
Occupied rent-free 3 457 4,9% 2 635 3,8% 174 0,2% 6 266 8,9%
Owned and fully paid off 2 224 3,2% 15 687 22,4% 31 0,0% 17 942 25,6%
Other 180 0,3% 1 003 1,4% 36 0,1% 1 219 1,7%
Total 7 947 11,3% 61 684 87,9% 550 0,8% 70 181 100,0%
City of Cape Town
Rented 54 503 5,1% 261 607 24,5% 3232 0,3% 319 342 29,9%
Owned but not yet paid off 7 034 0,7% 215 354 20,2% 1046 0,1% 223 434 20,9%
Occupied rent-free 71 636 6,7% 66 528 6,2% 1061 0,1% 139 225 13,0%
Owned and fully paid off 78 705 7,4% 274 479 25,7% 2061 0,2% 355 245 33,2%
Other 11 258 1,1% 19 563 1,8% 503 0,0% 31 324 2,9%
Total 223 136 20,9% 837 532 78,4% 7 904 0,7% 1 068 572 100,0%
The preceding analysis indicates that the River Club is located in a built-environment char-
acterised by households that overwhelmingly live in formal housing, and that a substantial
proportion rent their accommodation.
6.4 Economic and employment base of the City of Cape Town
Within the CoCT, the FIRE (finance, insurance, real estate and business services) sector and
trade (wholesale and retail trade, catering and accommodation) contributed 67% of GDPR to
its economy in 2013 (WCG 2015: 34).
2
Informal housing includes caravan/tent; informal dwelling (shack; in backyard); informal dwelling (shack; not in
backyard; e.g. in an informal/squatter settlement or on a farm); traditional dwelling/hut/structure made of tradi-
tional materials.
3
Formal housing includes cluster house in complex; flat or apartment in a block of flats; house or brick/concrete
block structure on a separate stand or yard or on a farm; house/flat/room in backyard; room/flatlet on a property
or larger dwelling/servants quarters/granny flat; semi-detached house; townhouse (semi-detached house in a com-
plex).9
Regarding economic growth measured by GDPR, Table 6.3 indicates that between 2005 and
2013 the economy of the CoCT grew at 3,4% per annum.
Concerning historic sectoral growth, Table 6.3 shows that agriculture, forestry and fishing,
FIRE, and construction were the top three performing sectors in terms of real GDPR growth
between 2005 and 2013. Although the agricultural sector expanded at remarkable 9% per
annum over this period, its contribution to the CoCT’s GDPR was a meagre 1,6 (WCG 2015:
34).
The importance of the FIRE and trade sectors for the CoCT economy has been stated previ-
ously. These sectors’ consistently strong performance as measured by GDPR growth (see
Table 6.3) over the recent past has managed to sustain the CoCT economy over this period
(WCG 2015: 34).
The outlook for the CoCT’s economy is positive with expected GDPR for 2015-2020 growth
to average 2,6% per annum (Table 6.3), which, however, is well below the 2005-2013 av-
erage of 3,4%. However, it must be pointed out that these forecasts were made in 2015, and
the prospects for the national economy has undergone a sea change since then; however,
the property market in Cape Town seems to be benefiting from this slow-down through semi-
gration, which may to a degree cancel out the negative effect of the stalling national econ-
omy.
Table 6.3 Historic and forecast CoCT sectoral GDPR growth
Real GDPR
Real GDPR growth
Sector forecast (%)
(2005-13)
(2015-2020)
Agriculture, forestry and fishing 9,0 2,8
Mining and quarrying -0,2 2,3
Manufacturing 2,3 2,0
Electricity, gas and water 1,7 1,8
Construction 5,1 3,6
Wholesale and retail trade, catering & accommodation 3,4 2,6
Transport, storage and communication 3,5 3,1
FIRE (finance, insurance, real estate and business services) 4,0 3,2
Community, social and personal services 2,3 1,6
General government 3,0 1,2
CoCT average 3,4 2,6
Source: Western Cape Government (2015: 34) and Quantec
The River Club development will benefit from the expected growth in the construction sector
of 3,6%, as well as the FIRE and trade sectors, which are expected to show growth of re-
spectively of 3,2% and 2,6% (see Table 6.3) over the forecast period (2015–2020). These
benefits will accrue because the FIRE sector favours corporate offices and business-process-
outsourcing centres that are flexible, secure, accessible, and close to suburbs, clients and
services. The trade sector generally prefers locations that are accessible to consumers and
close to transport networks, have high market visibility, consumer density and buying power
(CoCT 2012: 24). The River Club site meets all these locational criteria.10 7. Property-market analysis 7.1 Where are we in the long property cycle? In this section, we interpret and analyse time-series data to provide a better understanding of the property cycle, which serves as an important investment tool for buyers, sellers and, specifically from the perspective of this study, also for developers. The property cycle has a duration of approximately 15-20 years. Because the cycle is so long, it has an even greater significance than the shorter business cycle. Like any cycle, the prop- erty cycle can serve as an important investment tool for buyers, sellers and developers. Buyers should ideally enter the market when the property cycle is still near its trough, simply because of the fact that from that point onwards, the probability is greater that real rentals and prices will rise rather than decline. Sellers, on the other hand, should aim to leave the market when the property cycle is near its peak. Developers normally enter the property market in droves during the latter phase of an up- swing. This is so because prices and real rentals are now high, making new developments lucrative. However, to enter into new developments close to either side of the peak could be risky, especially on the downside of the peak — the more so if the developments are done on a speculative basis. It is convenient to represent the office and industrial cycles by considering the trajectory of real rentals.4 "Real" is calculated by deflating nominal rentals by a building cost index — normally either the JBCC CPAP Haylett Index (Haylett) or the BER Building Cost Index (BER BCI). The difference between these two indices in a nutshell is that Haylett measures build- ing-construction input costs only, viz. labour, capital and materials, whereas the BER BCI not only measures physical inputs, but also the profit margins of building contractors as well. Hence, any deviation between these two indices is the result of contractors either stretching or contracting their profit margins. During the upswing phase of the property cycle, contrac- tors are increasingly committed, which results in tendering competition becoming weaker, which in turn allows the contractors that do tender to stretch their profit margins. In the downswing phase the converse applies. With this as background, we can now consider some historic characteristics of the South African non-residential property cycle. Real office and industrial rentals exhibit a long cycle in South Africa (see Figure 7.1 for a brief explanation), with an average duration of about 17 years. The idealised cycle has an upswing phase of about 10 years (real rentals rising) and a downswing phase of about 7 years (real rentals declining). 4 Note: we do not use real market values, but rather real rentals as a proxy for the office- and industrial-property cycles. We can do this because market rent is a critical determinant of market value. Furthermore, the other critical variable in determining market value, namely capitalization rates, is generally inversely related to market rentals in any case. In fact, a strong argument can be made that rentals are a superior proxy for the property cycle, because market value sometimes reacts to a rerating of property (i.e. a change in capitalization rates), which is unrelated to underlying property fundamentals. And, of course, it is fundamentals that cause new developments to be occupied, not falling capitalization rates.
11
The matching of supply and demand in the property market is a formidable task, for essentially two
reasons, Firstly, building construction has a long gestation period, Secondly, property has a longer
economic life than even durable consumer goods, This implies that, once an oversupply has devel-
oped in the property market, it will take many years to be rectified since the existing stock is con-
sumed over decades, leaving only growth in demand to restore equilibrium, This partially explains
the long cycle in property,
Semi-durable goods Property
Non-durable goods Durable goods
Few days ±3 years ±10 years 30 years plus
to weeks
Economic life in years (not to scale)
Figure 7.1 Why such a long property cycle?
Note that we use Johannesburg decentralised office rentals as a proxy for the South Af-
rican decentralised office-property cycle. However, we could also have used the office rentals
of Pretoria, Cape Town, or Durban decentralised as they all generally move in synchrony. Of
course, this is not to say that the magnitude of the change in rentals in the various areas
does not differ. Similarly, we use industrials rentals on the Central Witwatersrand as a
proxy the South African industrial property cycle.
7.1.1 The office and industrial property cycles
At the end of 2016, Rode proposed two property cycle scenarios that could possibly eventu-
ate, viz. a Consensus scenario (based on our panel of economists’ then baseline macroeco-
nomic forecasts) and a Junk scenario (compiled by Rode, because we had our doubts about
the realism of the Consensus scenario). As it turned out, Rode was right, and what had been
the Rode Junk scenario in December 2016, has effectively become the Consensus scenario
in June 2017. However, in order to cover all bases, we hereby introduce a new Junk scenario,
which follows an even lower growth path than the December scenario. Thus, the new sce-
narios are:
A Consensus scenario based on our panel of economists’ 6-year macroeconomic
forecasts as in June 2017. It is a reasonable assumption that our panellists, in dotting
down their forecasts, assumed further sovereign debt de-ratings, including domestic
debt.
A Junk scenario compiled by Rode, in terms of which we assume very-low, stagnant
economic growth. Note that the term ‘junk’ is purely used as a name tag (as in ‘very
bad’), as the June Consensus scenario also implies further de-ratings of ZA debt.
Under the Consensus scenario, our panel of economists surveyed in June 2017, expects real
GDP growth of only 0,7% for 2017 (see Table 7.1). Therefore, we foresee the possibility of
continued weak demand for office and industrial space, and continued upward pressure on
vacancy rates during the year. On average, the economists surveyed do, however, foresee
an acceleration in economic growth from 2018 onwards. By implication this could mean im-
proved growth in service sector output (driving demand for office space) and improved12
growth in manufacturing output (driving demand for industrial space), not to mention the
possibility of improving business sentiment on demand for space to rent.
The outcome of all of this could be declining vacancy rates, which in turn bodes well for
nominal market office and industrial rentals. Nonetheless, under the Consensus scenario,
nominal office and industrial rentals are forecast to at first show growth below the expected
growth in building costs. During the second half of the forecast period, however, market
office and industrial rentals are likely to show growth in excess of building-cost inflation. The
outcome of this is expected to be a somewhat south and sideways trend in real office and
industrial rentals over the next few years (see Figures 7.2 and 7.3).
Office property cycle:
Real Johannesburg office rentals
35
Nominal rentals deflated by BER BC I
Forecast
30
(1990 prices) (log scale)
25
Real rentals
20
C onsensus scenario
15
Junk scenario
65 70 75 80 85 90 95 00 05 10 15 20
Source of data: Rode; BER
Figure 7.2 The office property cycle
Industrial property cycle: real Central Witwatersrand rentals
Consensus vs Junk scenario
12
Nominal rentals deflated by BER BC I
10
Forecast
(1990 prices) (log scale)
8
Real rentals
6
Consensus scenario
Junk scenario
4
75 80 85 90 95 00 05 10 15 20
Source of data: Rode; BER
Figure 7.3 The industrial-property cycle13
At the time of writing, domestic political uncertainty, the persistent underperformance of key
sectors of the domestic economy, hesitant global growth prospects and the possibility that
South Africa might be excluded from the world government bond index (which could result
in large portfolio-investment outflows) prevailed. As stated above, these circumstances com-
pelled us to, once again, consider an even lower economic growth scenario, which we call the
Junk scenario. Our Junk scenario’s real GDP forecasts are summarized in Table 7.1 and
Figure 7.4. As can be seen in Figures 7.2 and 7.3, under this scenario the direction of real
office and industrial rentals is forecast to be strictly south.
Table 7.1 Real GDP forecasts: Consensus vs Junk scenario
Means
Mean:
2017 2018 2019 2020 2021 2022
’17-’22
Consensus scenario: % change* 0,7 1,3 2,0 2,2 2,5 2,5 1,9
Junk-rating scenario: % change† 0,6 0,3 0,4 1,0 1,2 1,5 0,8
*Based on Rode’s panel of economists, June 2017
† Rode’s in-house forecasts
Growth in real GDP
Historic vs Consensus vs Junk
6
5
4
3
2
(%; y-o-y)
Growth
1
0
-1 Historic
Consensus scenario
-2 Junk sce nario
-3
90 92 94 96 98 00 02 04 06 08 10 12 14 16 18 20 22
Source of data: SARB; Rode's panel of economists; Rode calculations
Figure 7.4 Growth in real GDP: Consensus vs Junk scenario
7.1.2 The residential-property cycle
The lack of dynamism from important drivers of the mortgage and house markets will most
likely keep the growth in the nominal value of mortgage loans granted and nominal house
prices at bay. The good news, however, is that under our Consensus scenario, we do not
expect a decline in nominal house prices. But, we do foresee nominal growth of only 4,9%14
p.a., which is below the expected growth in building-cost and slightly below consumer infla-
tion (see Figure 7.5).
National house price cycle
(Nominal prices deflated by BER BCI)
200,000
180,000
160,000
Real (1990 rands)
(log scale)
140,000
Forecast
120,000
100,000
1970 1975 1980 1985 1990 1995 2000 2005 2010 2015 2020
Source of data: Absa; Stats SA. Rode forecasts
Figure 7.5 National house-price cycle
7.2 Office property market
7.2.1 Site context
The River Club redevelopment is foreseen to comprise a substantial office component (see
§8.2.2). Figure 7.6 shows the location of office nodes within a 10-km radius of the site.
Figure 7.6 Location of office nodes in the vicinity of the River Club15
Its location is very advantageous for office development as it abuts the existing Black River
Park business park, consisting of 75 000 m2 of office space and the Pinelands node. Several
other office nodes are also partially within a 5-km radius, viz. Century City, Rondebosch/New-
lands and Claremont. The site will have good macro access to the CBD as well as to the
northern and southern suburbs of Cape Town, where LSMs 9-10 reside.
The development’s residential component will supply an ample, well-located workforce. It will
also have good highway frontage onto the M5, M57 (Liesbeek Parkway) and, possibly, with
the mooted extension of the M16 (Berkley Road) it would have excellent frontage onto the
latter road too. Currently, however, road access to the site is limited and traffic congestion
on available roads further reduces accessibility to and from the site.
In sum, we consider the site’s location very suitable for office development (this viewpoint
does not take into account its environmental or geological suitability).
We next discuss factors underpinning the local office market that may affect the River Club’s
office component in the short to medium term.
7.2.2 Current size and vacancy rates of the Cape Town office-property market
Table 7.2 shows that the stock of grades A and B office space 5 in Cape Town as at the second
quarter of 2017 was almost 2,4 mn square metres. Of this, a total of about 161 000 m2,
equating to an overall vacancy rate of 6,7%, was available for leasing. As for nodal vacancy
rates (see also Table 7.2), during the quarter under review, Pinelands was the most-rented
up of the Cape Town office nodes, with vacancies of grades A & B combined just above 2%.
By contrast, the Cape Town CBD had a vacancy rate of more than 10%.
Table 7.2 Cape Peninsula office stock and vacancies by node as in 2017 (Q2)
Distribution Vacancies
Office node GLA (m2) Vacancy rate
of GLA (m²)
Bellville/Tygervalley area 541 838 22,7% 18 507 3,4%
Cape Town CBD 936 593 39,2% 96 759 10,3%
Century City 337 912 14,1% 27 107 8,0%
Claremont 107 922 4,5% 3 648 3,4%
Pinelands 237 716 9,9% 5 079 2,1%
Rondebosch/Newlands 102 531 4,3% 5 763 5,6%
V&A Waterfront area 126 853 5,3% 4 308 3,4%
Total 2 391 365 100% 161 171 6,7%
Source of data: SAPOA
In Figure 7.7 we show the office stock for grades A and B in June 2007 and June 2017 for
the various office nodes in Cape Town. Evident is that the past decentralization trend has
slackened markedly as the Cape Town CBD has only shown a very small proportionate de-
crease in the stock of office space between 2007 (39,9%) and 2017 (39,2%). Other office
5
Grade A: Generally not older than 10 years or which has had a major renovation; high quality modern finishes;
air conditioning, adequate on-site parking, market rental near the top of the range in the node in which the building
is located.
Grade B: Generally 10−20 years old (assuming no major refurbishment) and accommodation and finishes close to
modern standards; air-conditioned; on-site parking.16
nodes in Cape Town have, in fact, shown more substantial decreases in proportional office
space. The exceptions are Century City, which had a doubling in its proportional share of the
available office stock from 7% in 2007 to 14,1% in 2017. The V&A Waterfront node also
showed a comparative increase in office space from 4,6% to 5,3% during the analysis period.
(a)
(b)
Figure 7.7 Share of total grades A and B office stock in Cape Town (a) 2007, and (b) 2017
7.2.3 Historic office-rental growth rates
In Table 7.3 the growth in office rentals in Cape Town office nodes are ranked according to
their 5- and 10-year growth rates. The Pinelands and other nearby nodes are highlighted as
they intersect the 5-km River Club zone. Evident from Table 7.3 is that, measured by their
10-year growth rates, none of these nodes falls in the top five office nodes in Cape Town,
while all (except Century City) have growth rates close to the Cape Town average. Also note
how the growth in market rentals in these nodes were unable to outperform the growth in
building costs over the past 10-years, while over the past five years the nodes in question
(Century City excluded) have managed to do so.
These findings imply that over a 10-year period, net office rentals and market values were
unable to grow in real terms.6 This made the financial viability of new developments in the
poorly-performing nodes progressively more difficult. Over the past five years, this difficulty
has eased somewhat as office rentals have grown in real terms.
6
When assuming constant capitalisation rates and operating expenses growing at the market-rental rate17
Table 7.3 Cape Town 5-and 10-year grade A office-rental growth rates
(% compound growth p.a.)
5-year 10-year
Sea Point 14,7% Sea Point 10,9%
V&A Portswood Ridge 11,4% V&A Portswood Ridge 7,7%
Granger Bay 10,4% Bellville CBD 5,7%
Claremont Upper 8,9% Tokai 5,3%
Rondebosch/Newlands 8,7% Durbanville 5,1%
Cape Town CBD 8,5% Tygervalley Area, Bellville 5,0%
Pinelands 7,5% Cape Town CBD 4,9%
Tokai 6,7% Rondebosch/Newlands 4,6%
Kenilworth (Racecourse) 6,1% Claremont Upper 4,6%
Wynberg 5,5% Pinelands 4,3%
Westlake 5,3% Granger Bay 3,9%
Tygervalley Area, Bellville 4,9% Wynberg 3,8%
Century City 4,1% Century City 3,6%
Durbanville 4,0% Kenilworth (Racecourse) 3,3%
Goodwood (N1 City) 3,0% Westlake 2,4%
Bellville CBD 1,8% Goodwood (N1 City) 1,9%
Tygerberg Hills 1,7% Tygerberg Hills 1,9%
Cape Peninsula average 6,6% Cape Peninsula average 4,6%
BER Building Cost Index 6,4% BER Building Cost Index 4,9%.
Source of data: Rode’s Report on the SA Property Market
7.2.4 Current office rentals
To identify growth and stagnation nodes within the city, we ranked the office nodes according
to their current grade-A market rental levels, as current market rentals are a good indicator
of the relative attraction of individual nodes. This is so because market rentals mirror the
locational advantages (accessibility, proximity to the homes of decision takers), crime levels
and quality of an office building. Again, nodes within 5 km of the River Club have been high-
lighted. Only the Cape Town CBD falls within the top-five performing office nodes, measured
by the level of grade-A office rentals. With the exception of Pinelands, all the other highlighted
nodes (i.e. those within 5 km) are above the Cape Town average (see Table 7.4).
Table 7.4 Cape Peninsula grade-A market-rental rates for office buildings
(Av. of Q1:2017 and Q2: 2017)
Rands per rentable m² per month, gross leases (excl VAT)
Office node R
V&A Portswood Ridge 187,25
Granger Bay 166,67
Sea Point 138,04
Cape Town CBD 137,39
Claremont Upper 135,85
Century City 134,93
Rondebosch/Newlands 128,50
Tygervalley Area, Bellville 117,50
Pinelands 116,46
Westlake 115,84
Tygerberg Hills 115,84
Kenilworth (Racecourse) 113,50
Durbanville 113,25
Tokai 111,46
Goodwood (N1 City) 100,42
Wynberg 97,50
Bellville CBD 90,00
Cape Town average 124,73
Source of data: Rode’s Report on the SA Property Market18
7.2.5 Capitalization rates
Figure 7.8 indicates that capitalization rates in the Cape Town decentralized office nodes
have been weakening (increasing) over the past year or so. Our respondents are of the
opinion that investors currently require a minimum net income return of about 9% to induce
them into buying or selling grade-A multi-tenanted property in Cape Town decentralized.7 A
positive for the office-property capitalization-rate outlook in Cape Town decentralized must
be the region’s very low vacancy rate.
Capitalization rates
Prime Cape Town decentralized offices
14
Sm oothe d
13
12
11
%
10
Clarem ont
9 Tyger Valley
Century City
W e stlak e
8
92 94 96 98 00 02 04 06 08 10 12 14 16
Source of data: Rode's Time Series
Figure 7.8 Capitalization rates in prime Cape Town decentralized office nodes
7.3 Residential market
7.3.1 Site context
The River Club development will contain a large residential component (see §8.3.2). From a
locational perspective, it is evident that the site is located in a pleasant natural environment
with scenic mountain views, wetlands and rivers in close proximity, and borders established
middle-class residential areas such as Observatory and Pinelands. Residents would have easy
access to recreation and education facilities (both secondary and tertiary). Additionally, there
is a lack of developable land in the area resulting in possible substantial latent demand for a
residential development in the area. Its proximity to the CBD, industrial townships as well as
the northern and southern suburbs means that it is close to potential employment opportu-
nities. The future office component will also provide work to residents of the site. The various
development components would thus complement each other, in this way creating a live-
work-play mixed-use milieu.
7
Assuming the property is fully let at market rentalsYou can also read