Biodiversity conservation, sustainable land management and enhanced water security in Lake Tanganyika basin
←
→
Page content transcription
If your browser does not render page correctly, please read the page content below
5/5/2020                                                                           WbgGefportal

                                                                                                     Project Identification Form (PIF) entry – Full Sized Project – GEF - 7
Biodiversity conservation, sustainable land management and enhanced water security in Lake Tanganyika basin

   Part I: Project Information

   GEF ID
   10388

   Project Type
   FSP

   Type of Trust Fund
   GET

   CBIT/NGI
           CBIT
           NGI

   Project Title
   Biodiversity conservation, sustainable land management and enhanced water security in Lake Tanganyika basin

   Countries
   Regional, Africa, Burundi, Congo DR, Tanzania, Zambia

   Agency(ies)
   UNEP

   Other Executing Partner(s)                                                       Executing Partner Type

https://gefportal2.worldbank.org                                                                                                                                         1/87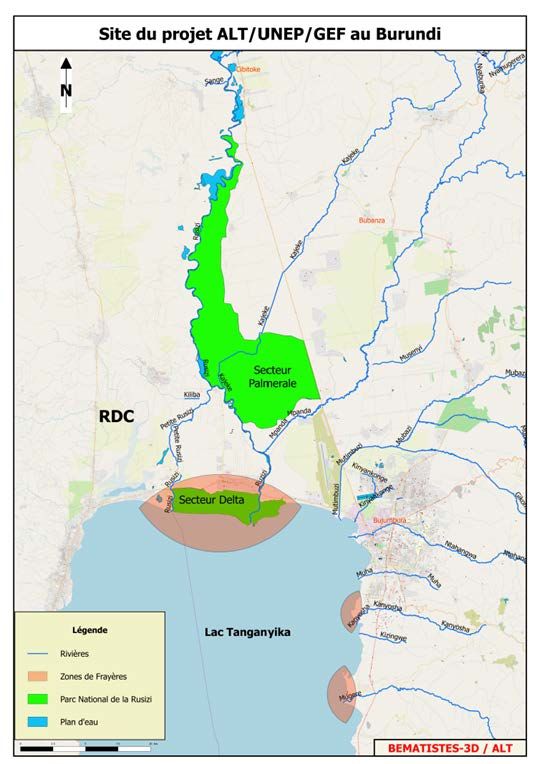
5/5/2020                                                                               WbgGefportal

   Lake Tanganyika Authority, Ministry of Environment, Agriculture and Livestock
   (Burundi), Ministry for Environment and Sustainable Development (DRC), Vice
   President’s Office (Tanzania), Ministry of Water Development, Sanitation and           Government
   Environmental Protection (Zambia), International Union for the Conservation of
   Nature (IUCN) and The Nature Conservancy (TNC)

   GEF Focal Area
   Multi Focal Area

   Taxonomy
   Fisheries, International Waters, Focal Areas, Freshwater, Lake Basin, Pollution, Nutrient pollution from Wastewater, Transboundary Diagnostic Analysis, Strategic
   Action Plan Implementation, Biodiversity, Mainstreaming, Tourism, Forestry - Including HCVF and REDD+, Protected Areas and Landscapes, Productive Landscapes,
   Community Based Natural Resource Mngt, Terrestrial Protected Areas, Species, Invasive Alien Species, Biomes, Tropical Rain Forests, Wetlands, Rivers, Temperate
   Forests, Grasslands, Tropical Dry Forests, Lakes, Land Degradation, Sustainable Land Management, Sustainable Livelihoods, Income Generating Activities,
   Sustainable Agriculture, Sustainable Fire Management, Sustainable Pasture Management, Sustainable Forest, Ecosystem Approach, Restoration and Rehabilitation of
   Degraded Lands, Community-Based Natural Resource Management, Improved Soil and Water Management Techniques, Influencing models, Convene multi-
   stakeholder alliances, Demonstrate innovative approache, Strengthen institutional capacity and decision-making, Stakeholders, Beneficiaries, Indigenous Peoples,
   Private Sector, Large corporations, Individuals/Entrepreneurs, SMEs, Financial intermediaries and market facilitators, Local Communities, Civil Society, Community
   Based Organization, Academia, Non-Governmental Organization, Gender Equality, Gender Mainstreaming, Sex-disaggregated indicators, Women groups, Gender-
   sensitive indicators, Gender results areas, Capacity Development, Awareness Raising, Knowledge Generation and Exchange, Access and control over natural
   resources, Participation and leadership, Capacity, Knowledge and Research, Enabling Activities, Knowledge Exchange, South-South, Peer-to-Peer, Field Visit,
   Conference, Knowledge Generation, Workshop, Training, Innovation, Learning, Indicators to measure change, Adaptive management, Targeted Research

   Rio Markers
   Climate Change Mitigation
   Climate Change Mitigation 0

   Climate Change Adaptation
   Climate Change Adaptation 1

   Duration
   60 In Months

   Agency Fee($)

https://gefportal2.worldbank.org                                                                                                                                        2/87

5/5/2020                           WbgGefportal

   1,313,916

   Submission Date
   10/11/2019

https://gefportal2.worldbank.org                  3/87
5/5/2020                                                                        WbgGefportal

      A. Indicative Focal/Non-Focal Area Elements

       Programming Directions                       Trust Fund                    GEF Amount($)             Co-Fin Amount($)

       BD-1-1                                       GET                                        1,046,995                11,150,980

       BD-2-7                                       GET                                        3,140,980                15,709,021

       LD-1-1                                       GET                                        1,932,995                 1,858,696

       LD-1-4                                       GET                                        1,288,663                 1,466,545

       IW-3-6                                       GET                                        5,032,615                21,272,377

       IW-3-7                                       GET                                        2,156,835                 9,314,960

                                                       Total Project Cost ($)                  14,599,083               60,772,579

https://gefportal2.worldbank.org                                                                                                     4/87
5/5/2020                                                                              WbgGefportal

      B. Indicative Project description summary

      Project Objective
      To enhance transboundary cooperation and SAP implementation through sustainable fisheries co-management, biodiversity conservation and restoration of
      degraded landscapes in selected key biodiversity areas of Lake Tanganyika. *Please note that the project comprises a blend of Technical Assistance and
      Investment. Components 1 and 4 are considered as TA in their entirety. Components 2 and 3 have both Technical Assistance and Investment elements for
      substantive Investment activities.

       Project             Financing   Project Outcomes         Project Outputs                        Trust             GEF Amount($)            Co-Fin Amount($)
       Component           Type                                                                        Fund

https://gefportal2.worldbank.org                                                                                                                                     5/87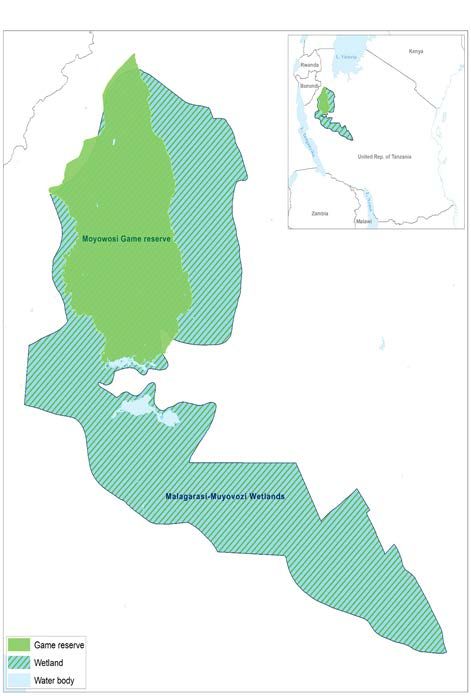
5/5/2020                                                                                   WbgGefportal

       Addressing          Technical                                                                         GET   4,752,118   21,471,533
                                       Outcome 1: A regional        Output 1.1 Prospective sites for
       identified           Assistan
                                       network of community-        community-based fisheries co-
       transboundar        ce
                                       based co-managed             management areas are identified and
       y threats to
                                       fisheries areas are           characterised, and the mechanisms
       lake
                                       established and              for their co-management
       biodiversity
                                       operationalized, and         consultatively developed
       (IW=4,752,11
                                       demonstrate their
       8)                                                           Output 1.2 Management and use-
                                       efficacy as a viable
                                                                    zone plans for community-based
                                       mechanism for the
                                                                    fisheries co-management areas are
                                       sustainable conservation,
                                                                    prepared, use zones demarcated, fish
                                       improved livelihoods, and
                                                                    catches monitored and enforced, and
                                       utilization of fishery
                                                                    critical fish nursery and spawning
                                       resources in Lake
                                                                    areas protected
                                       Tanganyika:
                                                                    Output 1.3 Institutional capacities of
                                       - at least 2 community-
                                                                    the national public fisheries agencies
                                       based fisheries co-
                                                                    are strengthened to support the
                                       management areas are
                                                                    implementation of sustainable
                                       established and
                                                                    fisheries practises, and protection of
                                       operational in each
                                                                    important fish habitats, in the
                                       participating riparian
                                                                    community-based fisheries co-
                                       country;
                                                                    management areas; alignment of the
                                       - the network of             national fisheries policies based on
                                       community-based              the co-management institutions and
                                       fisheries co-management       their networks on a national scale
                                       areas collectively
                                                                    Output 1.4 LTA collects, collates and
                                       conserves and protects at
                                                                    maintains data, and disseminates
                                       least 1,000 ha of the
                                                                    information on, the efficacy of the
                                       lake’s key fish spawning
                                                                    regional network of community-
                                       and nursery grounds; and
                                                                    based co-managed fisheries areas in
                                       - by EOP the number of       improving the conservation status of
                                       illegal fishing activities/   key commercial and threatened fish
                                       practices occurring in the   species in the lake; facilitates the
                                       community-based              regional fisheries plan and the
                                       fisheries co-management       national fisheries policies based on
                                       areas decreases by 50%       the network of the co-management
                                       from the baseline.           institutions

https://gefportal2.worldbank.org                                                                                                            6/87
5/5/2020 WbgGefportal
Protection of Technical Output 2.1 Capacities of GET 4,564,417 17,735,932
Outcome 2: Improved
core Assistan park/reserve management to
protection and enhanced
conservation ce monitor and control illegal activities
delivery of ecosystem
zones in (hunting, fishing, logging, poaching,
services from the core
three grazing, mining, etc.) and land
conservation zones of
protected encroachment (settlements, mining,
three protected areas;
areas agriculture, etc.) occurring in the core
(IW=897,902 - active conservation conservation zone of each targeted
BD=3,321,98 management occurring protected area strengthened
8 in at least 553,775 ha of
Output 2.2 Degraded ecosystems
LD=344,527) core conservation zones
and habitats in the core conservation
in three protected areas;
zones are restored and rehabilitated
- at least 200 field rangers (upscale sediment control measures
trained, equipped and and monitoring capacities; stabilise
deployed in the core riverbanks; restore compacted
conservation zones of wetlands; rehabilitate and restore
three protected areas; forest habitats)
- more than 50% of the
core conservation zones
in the protected areas are
under a regular ranger
patrol regime (i.e. visited
at least once/week);
- at least 1,700 ha of
degraded habitat
(riverbanks, forests,
grassland, lake edge,
wetlands) are under an
active
restoration/rehabilitation
programme in the core
conservation zones of
three PAs.
Sustainable Technical Outcome 3: The adoption Output 3.1 Improved knowledge, GET 4,107,354 16,493,824
natural Assistan of sustainable natural skills and capacities of targeted
resource use ce resource harvesting communities living in the protected
in three approaches and area buffer zones to more
https://gefportal2.worldbank.org 7/875/5/2020 WbgGefportal
protected sustainable agricultural sustainably cultivate and extract
areas and crop and livestock natural resources for livelihood and
selected practices in targeted subsistence purposes (identify
areas of their villages in protected area opportunities; information sharing;
buffer zones buffer zones contributes training and skills development;
(IW=820,591; to reducing deliver professional and technical
BD=566,787; anthropogenic pressures support; supply equipment and
LD=2,719,97 on the core conservation materials)
6) areas of three protected
Output 3.2 Technical support on
areas;
sustainable agriculture provided to
- implementation of subsistence and small-scale crop
sustainable resource use farmers and pastoralists living in
and agricultural practices targeted villages in the protected
in at least 20,000 ha of area buffer zones (conduct needs
protected area buffer assessment; deliver extension
zones; support services; procure equipment,
infrastructure and materials)
- at least 20% of small-
scale crop and livestock
farmers living in at least
15 project-targeted
villages are implementing
some form of sustainable
agricultural practices by
EOP; and
- the average income of at
least 5,000 vulnerable
households in the buffer
zones of the 3 protected
areas and their increases
by more than 5% (zero-
based budgeting
methodology) as a result
of project support to
targeted villages.
https://gefportal2.worldbank.org 8/875/5/2020 WbgGefportal
Transbounda Technical Outcome 4: Improved Output 4.1 Improved regional GET 480,000 2,177,362
ry Assistan coordination and coordination and lessons are shared
coordination, ce information-sharing between the riparian countries
information among riparian countries, (strengthen regional coordination
management the LTA, donors and other mechanisms; establish community
and M&E key stakeholders leads to of national practices; exchange
(IW=400,000; more effective information and lessons learnt;
BD = 70,000; partnerships in the participation in IW:LEARN at least 1%
LD = 10,000) implementation of the of the IW funding)
SAP and NAPs:
Output 4.2 State of the lake report
- revised SAP updated in and updated SAP -and NAPs
line with the priorities of accordingly- to revise priority country
the riparian countries for action based on the regional
cooperative action to cooperative activities prior to the
address their present project
transboundary concerns
Output 4.3 Enhanced LTA capacity to
- data collected by monitor and evaluate the
riparian countries and LTA implementation of the updated SAP
is used to inform and NAPs (establish national M&E
decisions by riparian coordination committees and
countries in regional M&E steering committee;
implementation of the support ongoing data collection;
SAP and NAPs produce bi-annual progress reports;
establish baseline for the lake
environment state via the state of the
lake report prior to the project and
monitor the status towards end of
the project)
Sub Total ($) 13,903,889 57,878,651
Project Management Cost (PMC)
GET 695,194 2,893,928
Sub Total($) 695,194 2,893,928
Total Project Cost($) 14,599,083 60,772,579
https://gefportal2.worldbank.org 9/875/5/2020 WbgGefportal https://gefportal2.worldbank.org 10/87
5/5/2020                                                                                WbgGefportal

      C. Indicative sources of Co-financing for the Project by name and by type

       Sources of Co-              Name of Co-financier                                                 Type of Co-   Investment        Amount($)
       financing                                                                                        financing      Mobilized

       Donor Agency                European Union                                                      Grant             Investment    6,070,000
                                                                                                                          mobilized

       Government                  Vice President’s Office Tanzania                                      In-kind           Recurrent     1,700,000
                                                                                                                        expenditures

       Government                  Vice President’s Office Tanzania                                      Grant             Investment     300,000
                                                                                                                          mobilized

       Government                  Ministry of Natural Resources and Tourism Tanzania                  In-kind           Recurrent     1,310,000
                                                                                                                        expenditures

       Government                  Ministry of Natural Resources and Tourism Tanzania                  Grant             Investment     250,000
                                                                                                                          mobilized

       Government                  Ministry of Livestock and Fisheries Tanzania                        In-kind           Recurrent      790,000
                                                                                                                        expenditures

       Government                  Ministry of Livestock and Fisheries Tanzania                        Grant             Investment     160,000
                                                                                                                          mobilized

       Government                  Ministry of Water Tanzania                                          In-kind           Recurrent      325,000
                                                                                                                        expenditures

       Government                  Ministry of Water Tanzania                                          Grant             Investment     70,000
                                                                                                                          mobilized

       Government                  President’s Office Local Government and Regional Administration,      In-kind           Recurrent      410,000
                                   Tanzania                                                                             expenditures

       Government                  President’s Office Local Government and Regional Administration,      Grant             Investment     80,000
                                   Tanzania                                                                               mobilized

https://gefportal2.worldbank.org                                                                                                                   11/87
5/5/2020 WbgGefportal
Government Ministry of Agriculture, Tanzania In-kind Recurrent 458,000
expenditures
Government Ministry of Agriculture, Tanzania Grant Investment 92,000
mobilized
Government Ministry of Energy, Tanzania In-kind Recurrent 510,000
expenditures
Government Ministry of Energy, Tanzania Grant Investment 100,000
mobilized
Government Ministry of Lands, Tanzania In-kind Recurrent 433,000
expenditures
Government Ministry of Lands, Tanzania Grant Investment 87,000
mobilized
Government Tanzania Wildlife Authority In-kind Recurrent 3,583,000
expenditures
Government Tanzania Wildlife Authority Grant Investment 717,000
mobilized
Government Tanzania Forest Services In-kind Recurrent 2,833,000
expenditures
Government Tanzania Forest Services Grant Investment 567,000
mobilized
Government Lake Tanganyika Basin Water Board In-kind Recurrent 687,000
expenditures
Government Lake Tanganyika Basin Water Board Grant Investment 138,000
mobilized
Government National Land Use Planning Commission, Tanzania In-kind Recurrent 750,000
expenditures
https://gefportal2.worldbank.org 12/875/5/2020 WbgGefportal
Government National Land Use Planning Commission, Tanzania Grant Investment 150,000
mobilized
Government Kibondo District Council, Tanzania In-kind Recurrent 833,000
expenditures
Government Kibondo District Council, Tanzania Grant Investment 167,000
mobilized
Government Uvinza District Council, Tanzania In-kind Recurrent 1,500,000
expenditures
Government Uvinza District Council, Tanzania Grant Investment 300,000
mobilized
Government Kaliua District Council, Tanzania In-kind Recurrent 1,833,000
expenditures
Government Kaliua District Council, Tanzania Grant Investment 367,000
mobilized
CSO The Nature Conservancy In-kind Recurrent 2,000,000
expenditures
Government Ministry of Environment and Sustainable Development, Congo DR In-kind Recurrent 2,500,000
expenditures
Government Local sector Itombwe In-kind Recurrent 580,049
expenditures
Government Local sector Mtambala In-kind Recurrent 600,000
expenditures
Government Local sector Tanganyika In-kind Recurrent 478,225
expenditures
Government Local sector Bavira In-kind Recurrent 602,300
expenditures
https://gefportal2.worldbank.org 13/875/5/2020 WbgGefportal
Government Local sector Lulenge In-kind Recurrent 428,395
expenditures
CSO Religious congregations In-kind Recurrent 1,747,610
expenditures
CSO Local CSOs, Congo DR In-kind Recurrent 4,210,000
expenditures
Government Ministry of Environment, Agriculture and Livestock, Burundi In-kind Recurrent 2,500,000
expenditures
Government Ministry of Environment, Agriculture and Livestock, Burundi Grant Investment 3,500,000
mobilized
Donor Agency World Bank (IDA) Grant Investment 6,000,000
mobilized
Government Burundi Office for Environmental Protection In-kind Recurrent 350,000
expenditures
Government Local communities In-kind Recurrent 1,400,000
expenditures
Private Sector Private sector companies, Burundi Grant Investment 1,756,000
mobilized
Government Ministry of Water Development, Sanitation and Environmental Protection, In-kind Recurrent 1,500,000
Zambia expenditures
GEF Agency UNEP Grant Investment 500,000
mobilized
CSO Frankfurt Zoological Society In-kind Recurrent 300,000
expenditures
Donor Agency IUCN Grant Investment 250,000
mobilized
https://gefportal2.worldbank.org 14/875/5/2020 WbgGefportal
Donor Agency IUCN In-kind Recurrent 2,000,000
expenditures
Total Project Cost($) 60,772,579
Describe how any "Investment Mobilized" was identified
Investments mobilized were mainly identified through collaborative initiatives from donor agencies, and Government agencies’ projects and initiatives where the
costs were budgeted for (other than recurrent costs). Co-financing investments from private sector companies were derived from the amounts committed to ESR
programmes in the project-targeted areas, while the co-financing investments from cooperatives was calculated from the ring-fenced amounts committed to
environmental protection (as a fixed percentage of the total fee) from the legally required annual payment of cooperative membership fees.
https://gefportal2.worldbank.org 15/875/5/2020 WbgGefportal
D. Indicative Trust Fund Resources Requested by Agency(ies), Country(ies), Focal Area and the Programming of Funds
Agency Trust Fund Country Focal Area Programming of Funds Amount($) Fee($) Total($)
UNEP GET Regional International Waters International Waters 7,189,450 647,050 7,836,500
UNEP GET Burundi Biodiversity BD STAR Allocation 329,806 29,683 359,489
UNEP GET Burundi Land Degradation LD STAR Allocation 329,806 29,683 359,489
UNEP GET Congo DR Biodiversity BD STAR Allocation 1,170,161 105,314 1,275,475
UNEP GET Tanzania Biodiversity BD STAR Allocation 2,688,008 241,920 2,929,928
UNEP GET Tanzania Land Degradation LD STAR Allocation 896,004 80,640 976,644
UNEP GET Congo DR Land Degradation LD STAR Allocation 1,995,848 179,626 2,175,474
Total GEF Resources($) 14,599,083 1,313,916 15,912,999
https://gefportal2.worldbank.org 16/875/5/2020 WbgGefportal
E. Project Preparation Grant (PPG)
PPG Required
PPG Amount ($) PPG Agency Fee ($)
300,000 27,000
Agency Trust Fund Country Focal Area Programming of Funds Amount($) Fee($) Total($)
UNEP GET Africa International Waters International Waters 150,000 13,500 163,500
UNEP GET Burundi Biodiversity BD STAR Allocation 9,643 868 10,511
UNEP GET Burundi Land Degradation LD STAR Allocation 9,643 868 10,511
UNEP GET Congo DR Biodiversity BD STAR Allocation 22,500 2,025 24,525
UNEP GET Tanzania Biodiversity BD STAR Allocation 64,286 5,786 70,072
UNEP GET Tanzania Land Degradation LD STAR Allocation 21,428 1,928 23,356
UNEP GET Congo DR Land Degradation LD STAR Allocation 22,500 2,025 24,525
Total Project Costs($) 300,000 27,000 327,000
https://gefportal2.worldbank.org 17/875/5/2020 WbgGefportal
Core Indicators
Indicator 1 Terrestrial protected areas created or under improved management for conservation and sustainable use
Ha (Expected at CEO
Ha (Expected at PIF) Endorsement) Ha (Achieved at MTR) Ha (Achieved at TE)
553,775.00 0.00 0.00 0.00
Indicator 1.1 Terrestrial Protected Areas Newly created
Ha (Expected at CEO
Ha (Expected at PIF) Endorsement) Total Ha (Achieved at MTR) Total Ha (Achieved at TE)
0.00 0.00 0.00 0.00
Total Ha Total Ha Total Ha
Name of the (Expected at (Expected at CEO (Achieved at Total Ha
Protected Area WDPA ID IUCN Category PIF) Endorsement) MTR) (Achieved at TE)
Indicator 1.2 Terrestrial Protected Areas Under improved Management effectiveness
https://gefportal2.worldbank.org 18/875/5/2020 WbgGefportal
Ha (Expected at CEO
Ha (Expected at PIF) Endorsement) Total Ha (Achieved at MTR) Total Ha (Achieved at TE)
553,775.00 0.00 0.00 0.00
Name of METT score METT METT
the Ha Ha (Expected Total Ha Total Ha (Baseline at score score
Protected (Expected at CEO (Achieved (Achieved CEO (Achieved (Achieved
Area WDPA ID IUCN Category at PIF) Endorsement) at MTR) at TE) Endorsement) at MTR) at TE)
Itombwe 72312 Protected area 208,000.00
Natural with
Reserve sustainable
use of natural
resources
Muyowosi 7505 Habitat/Species 335,775.00
Game Management
Reserve Area
Rusizi 900788 National Park 10,000.00
National
Park
Indicator 3 Area of land restored
https://gefportal2.worldbank.org 19/875/5/2020 WbgGefportal
Ha (Expected at CEO
Ha (Expected at PIF) Endorsement) Ha (Achieved at MTR) Ha (Achieved at TE)
1700.00 0.00 0.00 0.00
Indicator 3.1 Area of degraded agricultural land restored
Ha (Expected at CEO
Ha (Expected at PIF) Endorsement) Ha (Achieved at MTR) Ha (Achieved at TE)
Indicator 3.2 Area of Forest and Forest Land restored
Ha (Expected at CEO
Ha (Expected at PIF) Endorsement) Ha (Achieved at MTR) Ha (Achieved at TE)
1,200.00
Indicator 3.3 Area of natural grass and shrublands restored
Ha (Expected at CEO
Ha (Expected at PIF) Endorsement) Ha (Achieved at MTR) Ha (Achieved at TE)
https://gefportal2.worldbank.org 20/875/5/2020 WbgGefportal
Indicator 3.4 Area of wetlands (incl. estuaries, mangroves) restored
Ha (Expected at CEO
Ha (Expected at PIF) Endorsement) Ha (Achieved at MTR) Ha (Achieved at TE)
500.00
Indicator 4 Area of landscapes under improved practices (hectares; excluding protected areas)
Ha (Expected at CEO
Ha (Expected at PIF) Endorsement) Ha (Achieved at MTR) Ha (Achieved at TE)
21000.00 0.00 0.00 0.00
Indicator 4.1 Area of landscapes under improved management to benefit biodiversity (hectares, qualitative assessment, non-certified)
Ha (Expected at CEO
Ha (Expected at PIF) Endorsement) Ha (Achieved at MTR) Ha (Achieved at TE)
https://gefportal2.worldbank.org 21/875/5/2020 WbgGefportal
16,000.00
Indicator 4.2 Area of landscapes that meets national or international third party certification that incorporates biodiversity considerations (hectares)
Ha (Expected at CEO
Ha (Expected at PIF) Endorsement) Ha (Achieved at MTR) Ha (Achieved at TE)
Type/Name of Third Party Certification
Indicator 4.3 Area of landscapes under sustainable land management in production systems
Ha (Expected at CEO
Ha (Expected at PIF) Endorsement) Ha (Achieved at MTR) Ha (Achieved at TE)
5,000.00
Indicator 4.4 Area of High Conservation Value Forest (HCVF) loss avoided
https://gefportal2.worldbank.org 22/875/5/2020 WbgGefportal
Ha (Expected at CEO
Ha (Expected at PIF) Endorsement) Ha (Achieved at MTR) Ha (Achieved at TE)
Documents (Please upload document(s) that justifies the HCVF)
Title Submitted
Indicator 5 Area of marine habitat under improved practices to benefit biodiversity (excluding protected areas)
Ha (Expected at CEO
Ha (Expected at PIF) Endorsement) Ha (Achieved at MTR) Ha (Achieved at TE)
Indicator 5.1 Number of fisheries that meet national or international third party certification that incorporates biodiversity considerations
Number (Expected at CEO
Number (Expected at PIF) Endorsement) Number (Achieved at MTR) Number (Achieved at TE)
https://gefportal2.worldbank.org 23/875/5/2020 WbgGefportal
Type/name of the third-party certification
Indicator 5.2 Number of Large Marine Ecosystems (LMEs) with reduced pollutions and hypoxia
Number (Expected at CEO
Number (Expected at PIF) Endorsement) Number (achieved at MTR) Number (achieved at TE)
0 0 0 0
LME at PIF LME at CEO Endorsement LME at MTR LME at TE
Indicator 5.3 Amount of Marine Litter Avoided
Metric Tons (expected at
PIF) Metric Tons (expected at CEO Endorsement) Metric Tons (Achieved at MTR) Metric Tons (Achieved at TE)
Indicator 7 Number of shared water ecosystems (fresh or marine) under new or improved cooperative management
https://gefportal2.worldbank.org 24/875/5/2020 WbgGefportal
Number (Expected at Number (Expected at CEO Number (Achieved at Number (Achieved at
PIF) Endorsement) MTR) TE)
Shared water Tanganyika
Ecosystem
Count 1 0 0 0
Indicator 7.1 Level of Transboundary Diagonostic Analysis and Strategic Action Program (TDA/SAP) formulation and implementation (scale of 1 to 4; see Guidance)
Shared Water Rating (Expected at Rating (Expected at CEO Rating (Achieved at Rating (Achieved at
Ecosystem PIF) Endorsement) MTR) TE)
Tanganyika 3
Indicator 7.2 Level of Regional Legal Agreements and Regional management institution(s) (RMI) to support its implementation (scale of 1 to 4; see Guidance)
Shared Water Rating (Expected at Rating (Expected at CEO Rating (Achieved at Rating (Achieved at
Ecosystem PIF) Endorsement) MTR) TE)
Tanganyika 3
Indicator 7.3 Level of National/Local reforms and active participation of Inter-Ministeral Committees (IMC; scale 1 to 4; See Guidance)
https://gefportal2.worldbank.org 25/875/5/2020 WbgGefportal
Shared Water Rating (Expected at Rating (Expected at CEO Rating (Achieved at Rating (Achieved at
Ecosystem PIF) Endorsement) MTR) TE)
Tanganyika 2
Indicator 7.4 Level of engagement in IWLEARN throgh participation and delivery of key products(scale 1 to 4; see Guidance)
Shared Water Rating (Expected at Rating (Expected at CEO Rating (Achieved at Rating (Achieved at
Ecosystem PIF) Endorsement) MTR) TE)
Tanganyika 1
Indicator 11 Number of direct beneficiaries disaggregated by gender as co-benefit of GEF investment
Number (Expected at Number (Expected at CEO
PIF) Endorsement) Number (Achieved at MTR) Number (Achieved at TE)
Female 9,000
Male 6,000
Total 15000 0 0 0
https://gefportal2.worldbank.org 26/875/5/2020 WbgGefportal
Part II. Project Justification
1a. Project Description
1a. Project Description. Briefly describe:
1) the global environmental and/or adaptation problems, root causes and barriers that need to be addressed (systems description)
Profile of Lake Tanganyika and its basin
Formed about 12 million years ago, Lake Tanganyika lies at an elevation of about 772 m above sea level in the Western part of the Great Rift Valley (see Map 1
in Annex 1). With a length of 673km, it is the longest lake in the world. It averages 50km in width (at its widest it is 72km), has a surface area of 32,900 km2
and a shoreline length of 1,828km. It is, after Lake Victoria, Africa’s second largest lake and the world’s second deepest (1,471m), after Lake Baikal. Two main
rivers flow into the lake: the Ruzizi River which enters the north of the lake from Lake Kivu, and the Malagarasi River which enters the east side of the lake.
There is one major outflow, the Lukuga River, which empties into the Congo River drainage.
The lake is shared by four countries: Democratic Republic of Congo (DRC) (45%), Tanzania (41%), Burundi (8%) and Zambia (6%). Excepting a part of the
eastern and northern coast, the lake is confined by the steep sides of the rift valley, most prominent on its western edge which reaches 2,000 meters above the
shoreline. This limits the lake’s catchment area (Lake Tanganyika Basin) to approximately 231,000 km2. The catchment area stretches over the territory of five
countries: Tanzania (67%), DRC (16%), Zambia (7%), Burundi (6%), and Rwanda (4%).
The lake is a permanent source of clean water for domestic use and industrial and agricultural development and hosts one of the largest fisheries in Africa
(roughly 200,000 tons of fish are produced annually from the lake), particularly through its pelagic fish stocks. Three fish species, Lake Tanganyika sardine
(Limnothrissa miodon), sleek lates (Lates stappersii), and Lake Tanganyika sprat (Stolothrissa tanganicae), constitute the major commercial fisheries. Both
commercial and artisanal fisheries yield 165,000-200,000 tons of fish per year, employ about 100,000 people in fisheries-related activities, and provide 25-40
percent of the protein needs to one million people living around the lake. The lake is internationally famous in the ornamental fish trade as a source of prized
aquarium stock. The lake is also an important communication and transport channel.
https://gefportal2.worldbank.org 27/875/5/2020 WbgGefportal
Hosting at least 1,500 aquatic species, of which approximately 600 are currently considered endemic, the lake is a recognised global hotspot of biodiversity.
The Lake Tanganyika basin is also renowned worldwide for the unique richness of its aquatic and terrestrial biodiversity (including its great ape populations)
and the exceptional beauty of its landscape, supporting a substantial nature-based tourism industry.
The basin contains several forest reserves and national parks, including: (i) Rusizi National Park, Kigwena, Monje, Bururi, Kigwena and Vyonda Forest Nature
Reserves and Rumonge Nature Reserve in Burundi; (ii) Gombe Stream, Katavi and Mahale Mountains National Parks, Muyovosi and Kigosi Game Reserves
and Mpanda Line, Uganda, Swangala and Loasi Forest Reserves in Tanzania; (iii) Nsumbu National Park and Kapula Game Management Area in Zambia; and
(iv) Kabobo, Itombwe and Ngandja Natural Reserves in the DRC. The Rusizi National Park in Burundi and the Malagarasi-Muyovozi wetlands in Tanzania are
also designated as Ramsar sites of internationally important wetlands.
Profile of project-targeted protected areas
At the level of the individual riparian countries, the project will target interventions in three protected areas - Itombwe Natural Reserve (INR) in the DRC;
Muyowisi Game Reserve (MGR) in Tanzania and Rusizi National Park (RNP) in Burundi - and their adjacent buffer zones (please refer to maps included in
Annex 1)[1].
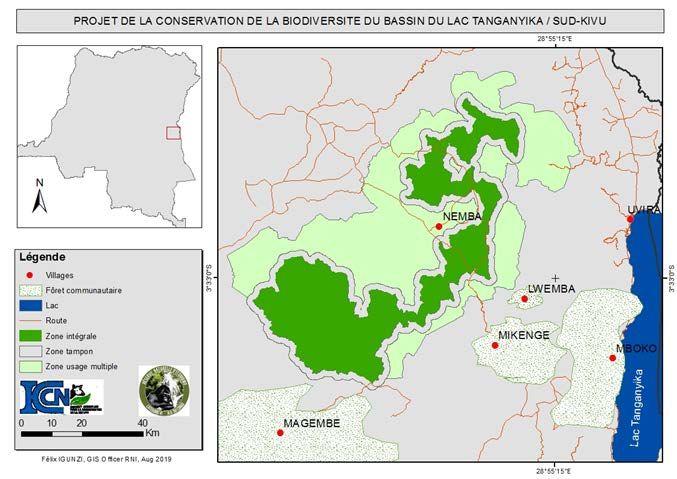
Located in the DRC province of South Kivu, west of Lake Tanganyika, the Itombwe Natural Reserve (573,165 ha) extends over four administrative territories:
Mwenga, Uvira, Fizi and Shabunda. It forms part of the Itombwe massif, the largest high-altitude forest in Africa. Of the 15,000 km2 of the massif, the forest
occupies more than 7,500 km2, of which more than 6,700 km2 includes high-altitude (ranging from 1,500 m to more than 3,000 m) forests, including
transitional forests and bamboo formations. Dominant tree species of the montane forest, where the canopy reaches around 25 m, include Parinari sp.,
Carapa sp., Homalium sp., Syzygium sp., Fagara aff. inaequalis, Sapium ellipticum, Ocotea michelsonii and Croton megalocarpus, while above 2,000 m the
dominants include Hirtella sp., Symphonia sp., Olea hochstetteri, Chrysophyllum sp., and Ficalhoa laurifolia. It contains the largest block of montane forest in
the Albertine Rift mountains and is exceptional in Africa in having an unbroken progression from lowland to montane evergreen forest. The Itombwe
mountains are difficult of access and human population densities are low in some parts. Forest is being cleared for agriculture and firewood around villages
and cattle graze the high plateaus. The town of Kamituga, an important mining centre, lies just to the north-west of the montane forest area. The Natural
Reserve is home to an astonishing array of species, including many that are threatened or endangered – such as forest elephants, chimpanzees and Grauer’s
gorillas. The reserve has been identified as a site of significant importance for the conservation of threatened and endemic birds and amphibians. It contains
more endemic and threatened species than any other region in Africa and is one of the richest sites for biodiversity in the Albertine Rift. The site is an Endemic
Bird Area, an Important Bird Area is the richest single forest area for birds in Africa, with 563 species recorded. The recently described Caprimulgus prigoginei
is only definitely known from Itombwe. Phodilus prigoginei and Schoutedenapus schoutedeni are also known with certainty only from this site, although are
probably not restricted to it. There are also records of Ardeola idea, Crex crex, Gallinago media and Glareola nordmanni. The Reserver is also an Alliance for
Zero Extinction site and a Key Biodiversity Area under the Eastern Afromontane Hotspot.
https://gefportal2.worldbank.org 28/875/5/2020 WbgGefportal
The Moyowosi Game Reserve (600,000 ha) forms part of the core area of a vast and complex riverine floodplain wetland, the Ramsar designated Malagarasi-
Muyovozi wetlands, located in the north west of Tanzania in the river basin of the Malagarasi River, Tanzania’s second largest river basin (which in turn forms
over 30% of the catchment of Lake Tanganyika). The wetlands of the reserve comprise lakes and open water in the dry season, together with a permanent
riverine swamp (and/or gallery forest), with large peripheral flood plains that fluctuate widely on a yearly basis (depending on the amount of rainfall). These
wetland habitats are surrounded by very extensive miombo woodlands and wooded grasslands. The reserve provides a crucial habitat for two threatened bird
species of global significance, the Whale-headed Stork Shoebill and Wattled Crane and is an important nursery and feeding ground for a wide variety of fish
species, at least 51 of which are endemic to the area. The reserve is also home to East Africa’s largest protected populations of Sitatunga and small numbers
of the African slender-snouted crocodile. The Game Reserve lies in Kigoma region. About 2,000,000 hectares of Kigoma landmass is covered by forests of
which 839,266.9 hectares are reserved forests (236,421.9 ha in Kasulu, 514,633.5 ha in Kibondo and 88,211.5 ha in Kigoma Rural including Moyowosi game
reserve) and the remaining forest area is unreserved. These forests are important for economic activities to adjacent communities who get various forest
products for domestic, sale and trade purposes. Firewood, charcoal, construction materials, timber, and others are among the products extracted from these
forests. Fishing is a major occupation, although done below optimum level due to lack of improved fishing gear. More generally, the regional economy
depends heavily on agriculture, natural resources, livestock, fisheries, tourism, trade and mining, with agriculture being the mainstay of Kigoma residents,
accounting for about 80 percent of all sectors’ economic contribution to the region.
The Rusizi National Park (10,673 ha) is located along the Rusizi river, 15 km north of the capital city of Bujumbura in Burundi. Along its upstream reaches, the
Rusizi river forms part of the border between Rwanda on the east with the Democratic Republic of the Congo (DRC) on the west. Further downstream, it forms
part of the border between the DRC and Burundi, and its lowermost reach lies entirely within Burundi. Reed swamps are common along the lower main stem of
the river and its tributaries. Near the mouth, the riparian swamps are up to 3 km wide. The Rusizi river flows into Lake Tanganyika through a delta, with one or
two small channels splitting off from the main channel. The site is considered an "ornithological paradise" for its stopover and nesting places for migratory
waterbirds, with over 120 breeding bird species and 90 migratory species identified. It supports 193 plant species, 90 fish species, and over 12 reptile species
including the Nile Crocodile Crocodylus niloticus (listed in CITES Appendix 1). It is a source of food and nesting ground for fishes and hosts several indigenous
species. Six species of large mammals have been identified, including the IUCN Red-Listed Hippopotamus Hippopotamus amphibius and several small
mammals including the Sitatunga Tragelaphus spekii - increasingly rare in Africa. Its hydrological functions include sediment trapping and general hydrological
balance. The main human activities include fishing, livestock, rice, sugar cane and cotton farming, and collection of non-timber forest products. The site is
threatened by erosion, over-exploitation of natural resources, and the use of fertilizers and pesticides for agriculture.
Overview of the trans-boundary management of Lake Tanganyika and its basin
Recognizing that the Lake Tanganyika basin is a global heritage that is under threat, several important initiatives have been undertaken over the past 25 years.
The first, the International Scientific Conference on the Conservation of Lake Tanganyika Biodiversity, took place in 1991 and acted as a catalyst for a number
of partnerships and initiatives to further enhance knowledge relevant to the sustainable management of biodiversity and natural resources in the Lake basin.
In the early 1990’s two projects were implemented: the UNDP-GEF ‘Lake Tanganyika Biodiversity Project’ (LTBP); and the ‘Lake Tanganyika Research’ (LTR)
Project. These projects contributed significantly to building the knowledge on the status of biodiversity and fisheries in Lake Tanganyika and underscored the
need for the riparian countries to find joint management solutions for transboundary environmental threats.
https://gefportal2.worldbank.org 29/875/5/2020 WbgGefportal
The four riparian countries subsequently committed to undertaking a Transboundary Diagnostic Analysis (TDA) for Lake Tanganyika (to guide the preparation
of a Strategic Action Plan for the lake) and drafting a ‘Convention on the Sustainable Management of Lake Tanganyika’. On 13th July 2000, the governments of
Burundi, Democratic Republic Congo, Tanzania and Zambia approved the first Strategic Action Plan (SAP) for the Protection of Biodiversity and Sustainable
Management of the Natural Resources in Lake Tanganyika and its Basin.
The riparian countries later signed the Convention on Sustainable Management of Lake Tanganyika in June 2003, which came into force in September 2005
and was ratified by the four Contracting States in November 2007.
The SAP formed the basis for support from a range of international donors and organisations including the GEF, UNDP, AfDB, PND, IUCN and FAO. This support
helped to continue the implementation of activities under the Lake Tanganyika Regional Integrated Management and Development Programme (LTRIMDP).
The implementation of the first SAP began in 2008 with two projects under the LTRIMDP: the UNDP-GEF ‘Project on Partnership Interventions for the
Implementation of the SAP for Lake Tanganyika’; and the AfDB and NDF funded ‘Project to Support the Lake Tanganyika Integrated Regional Development
Programme’ (PRODAP).
The updated SAP (prepared with support from the UNDP-GEF Project) was later adopted by the Contracting States on 29th February, 2012 at the fifth ordinary
meeting of the LTA Conference of Ministers. The SAP aims to address problems in a systemic manner and identified six main priorities. These priorities are:
(A) adaption and resilience to climate change impacts; (B) sustainable fisheries; (C) sustainable land management; (D) protection, restoration and
management of critical habitats; (E) control and prevention of biological invasions; and (F) reduced pollution and improved water quality. Each riparian country
has in turn developed a National Action Plan (NAP) to integrate the SAP into their national legal frameworks and policies, development plans and budgets. To
date, the implementation of the SAP and the NAPs of the individual riparian countries has however been very limited.
The Lake Tanganyika Framework Fisheries Management Plan (FFMP) was first published by the Food and Agriculture Organization of the United Nations
(FAO) in 1999 under the FAO/Norway Cooperative Programme. A Lake Tanganyika FFMP Implementation Programme and Component Project Profiles was
also prepared to assist the countries in the implementation of the FFMP. The FFMP was however never implemented by the Lake Tanganyika riparian
countries. In 2012 (under the FAO Technical Assistance Project to Support the Regional Programme for the Integrated Development of Lake Tanganyika,
PRODAP) the FFMP was updated, and the revised FFMP was approved by the recently concluded LTA Conference of Ministers (February 2020), which had
been prepared with the support of the African Union Inter-African Bureau for Animal Resources (AU-IBAR).
Key institutions
https://gefportal2.worldbank.org 30/875/5/2020 WbgGefportal
The Lake Tanganyika management is entrusted to the Lake Tanganyika Authority (LTA), an intergovernmental regional organisation established by the
governments of the four riparian countries through the Convention. The LTA has been operational since 2008 and its Secretariat is based in Bujumbura,
Burundi. The Conference of Ministers is the governing body of the LTA and consists of four Ministers, one from each of the Lake Tanganyika riparian countries
(Burundi, Democratic Republic of Congo, Tanzania, and Zambia). The major function of the Conference of Ministers is to evaluate the implementation of the
Convention. The second LTA leadership group is the Management Committee, which consists of four members from each Lake Tanganyika riparian country
representing fisheries, environment, water and finance sectors. The major function of the Management Committee is to support, coordinate and monitor the
implementation of the Convention. The third LTA leadership group is the Secretariat which consists of the Executive Director and three Directors each
responsible for Environment, Fisheries and Finance & Administration. The major function of the Secretariat is to oversee implementation of program and
project activities in accordance with the provisions of the Convention.
The mandates of the LTA on fisheries are provided in Article 23 and Article 7 of the Convection. The role of LTA is to Coordinate implementation of the
Convention in promoting sustainable fisheries management by the Contracting States, acting separately and jointly, to:
a) Take priority, appropriate measures to prevent and reduce as far as possible adverse impacts of fishing activities under their jurisdiction or control;
b) Develop harmonized national fisheries policies based on the relevant principles set out in the Code of Conduct for Responsible Fisheries adopted by the
Conference of the Food and Agriculture Organization of the United Nations;
c) Develop, adopt, implement and enforce harmonized legal, administrative and technical measures to manage fisheries and eliminate unsustainable fishing
practices and to reduce the pressure on over-exploited fisheries by, in particular, regulating fishing effort, practices capacity and aquaculture;
d) Develop, adopt, implement and enforce harmonized legal, administrative and technical measures to manage fisheries and to eliminate unsustainable
fishing practices and to reduce the pressure on over-exploited fisheries by, in particular, regulating fishing effort, practices capacity and aquaculture; and
e) Promote broad participation in fisheries management including the development of community based management structures with due regard to local
conditions.
In the DRC, the Institut Congolais pour la Conservation de la Nature (ICCN) is mandated to plan and manage the Itombwe Natural Reserve. Community
governance committees have been established for the reserve as a way of involving community representatives in the management of the reserve.
Community members and their leaders are involved in various conservation activities, either to support ongoing interventions or to lead some of the
interventions. A small corps of armed ICCN rangers are involved in patrolling some areas of the reserve, while local communities have also been trained and
resourced to patrol areas located in management zones surrounding their villages. WWF further provide critical professional, technical and financial support to
the ICCN (e.g. delimitation of the reserve, preparing the reserve management plan, construction of ranger stations, building working relationships with local
and indigenous communities) in the ongoing management of the reserve.
In Tanzania, the Moyowosi Game Reserve (MGR) is managed by the Tanzania Wildlife Management Authority (TAWA) under the ministry Natural Resources
and Tourism. TAWA is also responsible for the protection and utilization of wildlife (including mitigating human-wildlife conflicts (HWCs) in the buffer areas
around the MGR. The reserve has a total of about 50 staff to patrol the area but has no boats and only limited numbers of vehicles which makes patrolling of
https://gefportal2.worldbank.org 31/875/5/2020 WbgGefportal
the area especially during the wet season difficult. A number of game posts have been established around the reserve, but the boundaries are poorly
demarcated and there are few access roads.
In Burundi, the Burundian Office for the Protection of the Environment (OBPE) in the Ministry of, Environment, Agriculture and livestock is responsible for
addressing issues related to biodiversity and protected areas, land degradation, conservation of aquatic resources and sustainable management of forests in
and around Rusizi National Park (RNP). The local communities elected a management committee to represent them in the management of the Park that
requires strengthening and clarifying a collaboration framework with OBPE. There are also resident associations that contribute to protection, patrolling and
basic maintenance services in exchange for permits allowing for sustainable harvesting of natural resources, mainly for subsistence.
Key threats to Lake Tanganyika and its basin
The lake ecosystem faces an array of challenges created mainly by increasing human populations and the changes in land use. Recent rapid population
growth and intensified human activities, which have induced changes in land use patterns and deforestation in the lake basin, have resulted in an increase in
soil erosion and sediment loads transported by rivers into the lake.
The current population in the Lake Tanganyika basin is estimated at between 12.5 and 13 million inhabitants, more than one million of which live along the
immediate lake shore and are directly dependent on its natural resources. With rapid population growth occurring in the riparian countries (ranging from 2 to
3.3% per annum), the number of people depending directly or indirectly on the lake’s resources is increasing exponentially. Poverty is also rampant, with the
majority of the population - particularly those along the lake shore - living in extreme poverty, leaving people no alternative but to unsustainably exploit natural
resources for their livelihood[2]. Political instabilities in some riparian countries is further exacerbating this state of general impoverishment.
Erosion is of the highest concern in the medium size catchments (50-4,000 km²) of the lake basin, where the sediment load is discharged into the lake without
the mitigating effects of major wetlands. This brings higher than usual amounts of suspended matter into the lake threatening its biodiversity and reducing
depth in nearby ports, leading to disruption in navigation. Furthermore, as vegetative cover is removed, weathering processes increase, and soil nutrients are
lost through runoff. This can lead to rapid and significant losses of soil fertility in the catchment prompting opening of new agriculture fronts into intact natural
protective forest cover. The loss of topsoil in combination with tectonic and wind activities in the basin area often lead to landslides. This results in damage to
buildings and loss of lives but also increased sedimentation, further exacerbating adverse effect on littoral fisheries. The littoral zone[3] is also increasingly
threatened by poorly managed coastal development.
Fisheries in Lake Tanganyika face many threats including breeding ground loss and/or modification due to sedimentation and human encroachment, over-
fishing in the littoral zone, use of illegal fishing gear (e.g. seine nets) and dynamite. Certain commercial fisheries have reported significant declines in catch
per unit effort (CPUE) (an estimator of fish abundance) of close to 90%. It has been reported that, between 1995 and 2011, the total fish stock has decreased
https://gefportal2.worldbank.org 32/875/5/2020 WbgGefportal
by 25%. A proper lake wide fish stock assessment is missing to date and riparian countries have not been able to set sustinable levels of commercial fish yield
from the lake as a result.
Much of the basin is already densely populated, and climatic changes may further affect access to water resources, increase the likelihood of drought, and
negatively affect agricultural productivity and livelihoods. Climate change has the potential to combine with these demographic changes to increase
environmental pressures.
While the environmental situation across the lake and its basin continues to deteriorate, it should be noted that the vastness of Lake Tanganyika and its basin
helps absorb and mitigate known environmental impacts to a certain degree. For example, the quality of water across the lake still remains relatively good.
Nevertheless, existing trends in deforestation, sedimentation, overfishing and pollution exacerbated by climate change impacts such as flooding, soil erosion,
and drought, will, if unattended, lead to an ever-increasing pace of the deterioration of environmental conditions and overall degradation of Lake Tanganyika.
Key threats to the project-targeted protected areas
Following almost two decades of conflict and chronic instability in the region, large numbers of people have settled in and around Itombwe Natural Reserve in
the DRC and are converting the forest for agriculture and pastures. The reserve is increasingly threatened by itinerant slash-and-burn farming practices, illegal
commercial hunting (with firearms and automatic military weapons), subsistence hunting (practiced by the resident population with traditional trapping
techniques), the conversion of forests to pasture areas on the highlands, and forest harvesting for lumber and for commercial charcoal production, This
situation is being further exacerbated by the discovery of valuable minerals such as coltan and cassiterite, and to a lesser extent diamonds. The reserve is
divided among a number of chiefdoms and villages, and poachers—banned from hunting bushmeat in their home portion of the reserve—are also moving into
neighbouring areas to hunt. Corruption, illegal hunting permits, weak governance, impunity, high local demand for bushmeat, the presence of villages inside
the reserve, and limited government resources to respond are significant barriers to effectively addressing these threats.
In Tanzania, the conversion of “buffer” miombo woodland along the north-western boundaries of the Moyowosi Game Reserve for agricultural crops
(especially for the growing of maize and beans) and the illicit harvesting of forest products, wildlife resources and fish also constitutes a significant threat to
the integrity of the boundaries of the reserve. Heavy levels of poaching have been recorded in the area over the past 20 years and the populations of some
species of large mammal have been significantly reduced. The weak enforcement of fishing license conditions is further leading to an overexploitation of key
fish populations in the reserve. Poverty poses an enormous challenge to the reserve management, with most people around the reserve living under extremely
difficult socio-economic conditions.
https://gefportal2.worldbank.org 33/875/5/2020 WbgGefportal
The fisheries, forest and wetland resources of the Rusizi National Park in Burundi are being unsustainably exploited as a result of an ever-increasing demand
for goods and services by the rapidly increasing human population. Loss and degradation of habitat, sedimentation due to deforestation, eutrophication,
excessive water withdrawal for municipal use, overexploitation of riparian and woodland resources, illegal fishing and pollution are the leading causes of the
degradation of the park and its river catchment.
Long-term solution to the sustainable management of Lake Tanganyika and its basin
The long-term solution sought by the project is more effective collaboration and coordination between the riparian countries in the implementation of the SAP,
FFMP along with NAPs under the Convention on Sustainable Management of Lake Tanganyika. A more harmonized approach to the implementation of the
SAP and NAPs will result in concrete actions to promote biodiversity conservation and sustainable land management in project targeted areas of the lake and
its basin. These actions will result in a reduction of erosion, a decrease in sedimentation, the maintenance of healthy fish stocks, and the conservation of
priority natural habitats in project targeted areas of the lake and its basin that will be scaled up across the basin.
Barriers to achieving the long-term solution
The effectiveness of efforts to realise this long-term solution is however being compromised by the following key barriers:
Low compliance with, and inadequate enforcement of, fisheries laws and regulations by resource users in Lake Tanganyika. The fisheries management in Lake
Tanganyika is open access, and the compliance and enforcement levels of the various laws of relevance to the lake vary among the countries. Individually, the
riparian countries are implementing a number of fisheries control measures, such as: mesh size restrictions, closed areas and seasons, observation of lunar
breaks for the pelagic fishery, licensing, assessment of catches together with monitoring, control and surveillance, and enforcement. But, in general, these
measures are not effective in the absence of inclusive and participatory approaches towards fisheries management with lakeshore communities on the basis
of Fisheries Management Plans and related governance structures that promote self-regulation, protecting recognized fish breeding sites (FBSs), sustainable
fishing practices, increased economic gains from fish and integration with alternate livelihoods. Accordingly, heavy damage is being inflicted on littoral-borne
life stages of pelagic species due to uncontrolled beach seining and use of other destructive gear. There is also a loss of fish quality and quantity through the
post-harvest handling stages (processing, transport and marketing).
The capacity of the national agencies responsible for the conservation planning and management of the targeted protected areas (Rusizi NP in Burundi,
Muyowosi GR in Tanzania and Itombwe NR in DRC) is weak, with insufficient operational funding, staffing complement and technical skills being committed to
fulfil their conservation mandates. These agencies are not fully capable of providing adequately for the day-to-day protection and management requirements
of even the core conservation zones of the protected areas. They are unable to effectively regulate and monitor illegal encroachments, poaching, mining
https://gefportal2.worldbank.org 34/875/5/2020 WbgGefportal
activities or timber harvesting occurring in these core conservation zones, increasingly exposing them to further deforestation and degradation. The protected
areas are all poorly demarcated and weak support from local communities and political decision-makers and there is limited community involvement in and
beneficiation from the ongoing planning, management and restoration of these protected areas.
There is little incentive for communities living in and around the protected areas to invest in the long-term sustainability of the natural resources of the
protected areas, and short-term gains are instead being maximized through overutilization. Weak participative land use planning around the protected areas is
contributing to unsustainable levels of use that do not take due consideration of conservation and the rights of natural resource-dependent communities.
There is limited attention being paid to alternative livelihoods in and around these protected areas. Shifting cultivation practices is resulting in the ongoing
conversion of forest and grassland to agricultural land by encroachment, and subsequent abandonment of degraded agricultural land in these areas,
contributing to erosion and sedimentation related pollution, affecting the quality and functioning of the basin’s ecosystem services. Current agricultural
production practices in these areas do not address long-term soil fertility constraints in the prevailing cropping systems. As a result, most farmers depend on
inorganic fertilizers that deal with soil fertility for a given season. When farmers are not able to afford fertilizers, cultivation of the same piece of land for crop
production can only be sustained for a few years and then they are forced to open new lands that are more fertile, and in a lot of cases, this will be in the
natural areas in and around the protected areas.
2) the baseline scenario and any associated baseline projects;
The associated large-scale baseline projects, at the regional, and individual riparian country, level for the lake and its basin include inter alia:
At the regional trans-boundary scale, the Lake Tanganyika Authority (LTA) is coordinating all development and management efforts on the lake. The four
riparian countries each contribute USD 303,900 per year to cover LTA salaries at both regional and national levels (5% of this amount is used for operational
costs of the LTA). The Capacities for Biodiversity and Sustainable Development" (CEBioS) Programme funded by the Belgian Development Cooperation is
partnering with institutions in Burundi (€ 93,000) to facilitate the link between scientific research and sustainable management of the 3 main National parks in
Burundi (including Rusizi National Park) and in DRC to strengthen its habitat monitoring capacities. An EU-funded programme, Contribution of Sustainable
Fisheries to the Blue Economy of the Eastern Africa, Southern Africa and the Indian Ocean region (ECOFISH), is currently under development for a regional
envelope of € 28 million. The programme will include an allocation of at least € 2 million for improving regional fisheries management capacities (including
policies, legislation, governance, planning and knowledge management) and developing, testing and implementing local fisheries management systems, in
Lake Tanganyika. A new € 6.9 million EU-funded[4] Lake Tanganyika Water Management project (LATAWAMA) has recently been developed, and once under
implementation, will: support the development and testing of a water quality monitoring tool for Lake Tanganyika; implement wastewater management, waste
management and sanitation projects in 5 pilot cities in the riparian states; and strengthen the capacity of LTA to coordinate and support water resource
management stakeholders. The Nature Conservancy (TNC) has produced a Lake Tanganyika Freshwater Atlas to inform decision making. The WB, IDA and
Japan Policy and Human Resources Development Fund (PHRD) funded Regional Great Lakes Integrated Agriculture Development Project (PRDAIGL 2017-
2022) - of which USD 152.7 million is allocated to the Tanganyika and South-Kivu provinces in the DRC and USD 79.73 million is allocated to Burundi - supports
the development of selected agricultural value chains, including: (i) enhancing productivity and market linkages of selected value chains; (ii) development of
critical market infrastructure; (iii) improving the business environment and access to finance; (iv) supporting development of agro-industrial parks; (v)
strengthening regional cooperation and joint natural resource management; and (vi) expanding regional agricultural research. The project area covers 5 of the
https://gefportal2.worldbank.org 35/87You can also read