Buffelsdraai Landfill Site Community Reforestation Project Community, Climate and Biodiversity Standard Project Design Document
←
→
Page content transcription
If your browser does not render page correctly, please read the page content below
Buffelsdraai Landfill Site Community
Reforestation Project
Community, Climate and Biodiversity
Standard Project Design Document

Prepared for:
The eThekwini Muncipality
and
The Wildlands Conservation Trust

Prepared by:

   The Loft I Red Herring Centre I 65 Beach Road I Noordhoek

                   Cape Town I South Africa

    Tel: +27 (0) 83 415 6239 I Email: tonyknowles@gmail.com
Table of Contents
RATIONALE .................................................................................................... 1
PROJECT OVERVIEW ...................................................................................... 1
GENERAL SECTION ......................................................................................... 2
  G1. Original Conditions in the project area ........................................................................................ 2
  G2. Baseline Projections ................................................................................................................... 20
  G3. Project Design and Goals ............................................................................................................ 28
  G4. Management Capacity and Best Practices ................................................................................. 36
  G5. Legal Status and Property Rights ................................................................................................ 42

CLIMATE SECTION ........................................................................................ 44
  CL1. Net Positive Climate Impacts .................................................................................................... 44
  CL2. Offsite Climate Impacts ............................................................................................................. 49
  CL3. Climate Impact Monitoring ....................................................................................................... 50

COMMUNITY SECTION ................................................................................. 51
  CM1. Net Positive Community Impacts ............................................................................................ 51
  CM2. Offsite Stakeholder Impacts .................................................................................................... 61
  CM3. Community Impact Monitoring ............................................................................................... 61

BIODIVERSITY SECTION ................................................................................ 64
  B1. Net Positive Biodiversity Impacts ............................................................................................... 64
  B2. Offsite Biodiversity Impacts ........................................................................................................ 66
  B3. Biodiversity Impact Monitoring .................................................................................................. 67

GOLD LEVEL SECTION ................................................................................... 68
  GL1. Climate Change Adaptation Benefits ........................................................................................ 68
  GL2. Exceptional Community Benefits .............................................................................................. 70
  GL3. Exceptional Biodiversity Benefits.............................................................................................. 71
  References ........................................................................................................................................ 71
  List of Appendices ............................................................................................................................. 73

                                                                                                                                                       i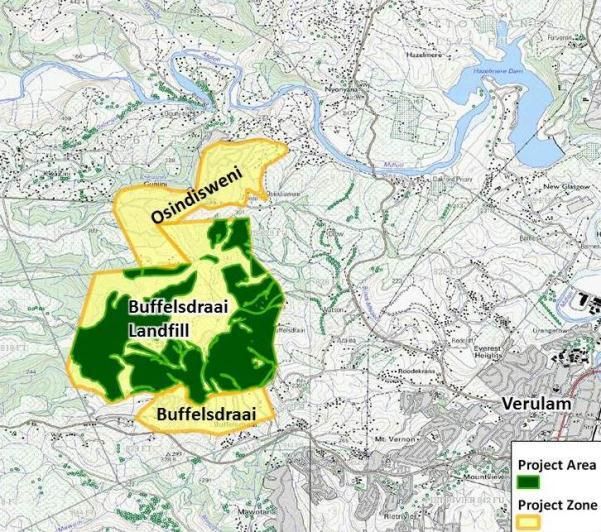
The compilation of a CCBA Project Design Document for the Buffelsdraai
                Landfill Site Community Reforestation Project

RATIONALE
The Wildlands Conservation Trust (WCT) is implementing a reforestation project located in the
buffer zone of the Buffelsdraai landfill site on behalf of eThekwini Municipality. The Trust has
requested the Cirrus Group to compile a Project Design Document (PDD) for submission to the
Climate, Community and Biodiversity Alliance (CCBA). The CCBA Standard is the leading means of
auditing the socio-economic and biodiversity aspects of land use based climate change mitigation
activities. The document follows the latest version of the CCBA PDD (www.climate-standards.org).

PROJECT OVERVIEW
The Buffelsdraai Landfill Site Community Reforestation Project was initiated by the eThekwini
Municipality and is aimed at offsetting a portion of the Greenhouse Gas emissions generated by
hosting the FIFA 2010 World CupTM in Durban.

As large portion of the 809 hectare (ha) Buffelsdraai Landfill Site buffer zone is currently under
sugarcane cultivation, it was decided to halt farming and rehabilitate the sugarcane lands to their
original forested state. This additional management intervention would increase the biodiversity of
the site and lead to a net reduction in atmospheric GHG through the sequestration of carbon in
biomass and soils. Furthermore, this will contribute towards achieving the objective of establishing a
“Conservancy” over the active landfill site and its surrounding buffer zone, in accordance with the
approved Terms of Reference for the Buffelsdraai Landfill Site.

The Municipality approached the Wildlands Conservation Trust to implement the reforestation
project through the Trust’s well-established Indigenous Trees For Life Programme (ITFL) that is
currently running in several parts of the province. The ITFL programme assists unemployed people
known as “tree-preneurs”, to start small indigenous tree nurseries. The trees are then traded for
goods at Tree Stores established by the Trust. In turn the Trust uses the trees to green
neighbourhoods, or in this case, to rehabilitate degraded ecosystems. More than 600 people from
surrounding impoverished communities have already participated in the ITFL programme and
improved their living conditions in the process. Since inception in November 2008, the project has
created a total of 247 jobs (21 full time, 6 part time, 220 temporary) for members of the surrounding
communities. At regular intervals, mass planting drives are held, during which up to 60 members
from the local communities are employed to assist with planting the trees out at the project site.

More than 500 ha of sugarcane lands are being planted in a phased approach with 61 locally
occurring indigenous tree species. The intention is to establish a functioning, diverse, indigenous
woodland that would sequester atmospheric carbon over time and enhance the ecosystem
functioning of the landfill site buffer zone. The rehabilitation of the site is anticipated to contribute
to the Municipality’s climate change protection program by preventing soil erosion and managing
water flow and sedimentation.

                                                                                                       1
GENERAL SECTION

                               G1. Original Conditions in the project area

G1.1 – General Information: The location of the project and basic physical parameters
The Buffelsdraai Landfill Site Community Reforestation Project is located approximately 25km north
of Durban, in the province of KwaZulu-Natal, South Africa (Fig. 1). The project area of 520.6 ha is
located in the buffer zone of the eThekwini Municipality owned Buffelsdraai landfill site. The site is
located in an area used historically for sugarcane production with peri-urban communities occurring
to the west, south and east.

Figure 1. A map indicating the location of the project site within the eThekwini Municipal Area boundary.

                                                                                                            2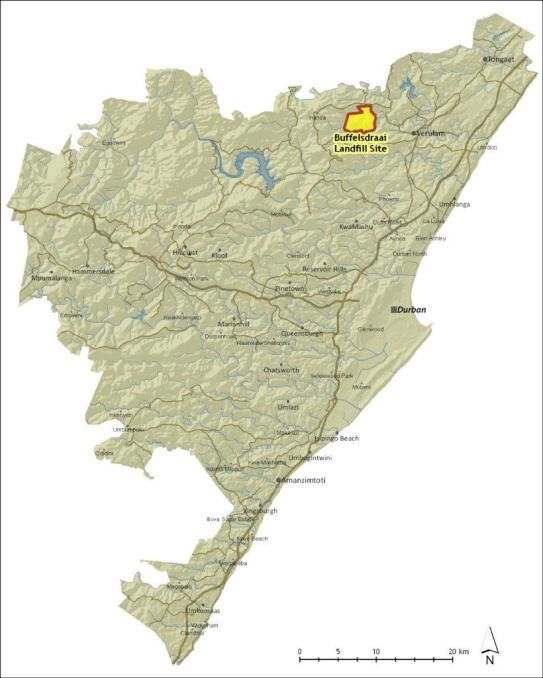
The annual rainfall in Verulam (the nearest town, located 5km east of the project site) is
approximately 766mm per year with most of the rainfall occurring during the summer months. The
highest monthly rainfall occurs in February where average monthly rainfall is approximately 108mm
(Fig. 2). Average daily temperatures range from 22.2°C in the winter months to 27.4°C in February.

Figure 2. Charts summarizing rainfall and temperature for the project area.

Geology in the study area is dominated by Dwyka Tillite deposited in a glacial environment by
retreating ice sheets about 300 million years ago (Fig. 3). As Gondwana moved north towards the
equator, thick clay and silt beds were laid down in a large sea that occupied the Karoo basin. These
sediments now form shales of the Pietermaritzburg Formation that occupy the eastern sections of
the study area. The shales are easily weathered and often present slope stability problems
(http://www.geology.ukzn.ac.za/GEM/kzngeol/kzngeol.htm).

Figure 3. The basic geology of the project area.

                                                                                                     3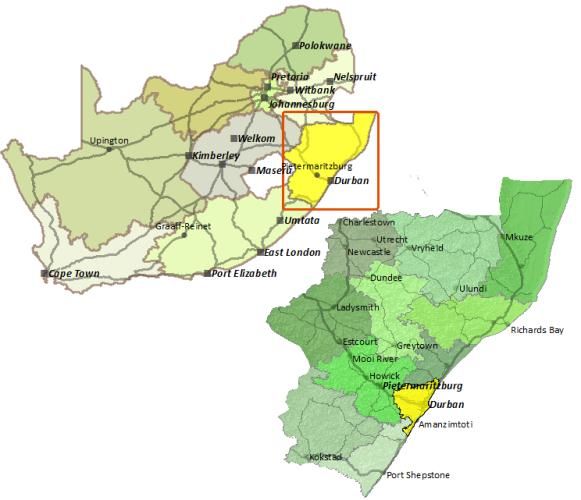
The soils of the project area are highly variable, ranging from deep, well drained red Hutton soil
forms to shallow, poorly drained Glenrosa soil forms (Water Research Commission, 1995). The
topography of the site is also highly variable with a large stream, the Black Mhlasini, flowing through
the northern section of the site and the White Mhlasini River flowing along the southern boundary.
Between these rivers, the elevation of the site ranges from 200m up to 325m AMSL along the ridge
lines.

G1.2 – General Information: The types and conditions of vegetation within the project area
The vegetation is broadly described as belonging to the KwaZulu-Natal Coastal Belt (Mucina and
Rutherford, 2006). This vegetation type is highly transformed and fragmented in South Africa, with
very little of the vegetation type under formal protection. It was therefore classified as Endangered
in the recent vegetation map of South Africa (Mucina and Rutherford, 2006). Slightly finer-scale
mapping has been undertaken by Ezemvelo KZN Wildlife, the provincial biodiversity authority in
KwaZulu-Natal, that sub-divides the vegetation types into sub-types (Fig. 4). This analysis broadly
classifies the project area as KwaZulu-Natal Coastal Belt Grassland (Fig. 4, Ezemvelo KZN Wildlife,
2010). KwaZulu-Natal Coastal Belt Grassland is a broad description for a vegetation type that is a
mosaic of grassland, woodland and forest (Rob Scott-Shaw pers. comm.)1.

The vegetation within the project area varies considerably. Whereas the area that will be reforested
has previously been used for the production of sugarcane, forest patches do occur along some
south-facing slopes while remnants of riparian forest occur along many of the drainage lines. Some
areas of indigenous woodland and grassland remain, but are highly restricted in their distribution
(Fig. 4).

More than half of the 809 ha landfill buffer zone consists of areas used for the cultivation of
sugarcane fields (47% actively used, 9% fallow) (Table 1). While the riparian vegetation is intact, the
remaining woodland, forest and thicket patches are considered to be in poor condition (Table 1).

Many of the untransformed patches of vegetation have high levels of invasive alien plant infestation.
Whereas these areas are outside of boundary of project area that is being reforested, they do fall
within the greater buffer zone of the landfill site. A detailed description of the vegetation
surrounding the sugar cane fields can be found in Macfarlane et al. (2011).

Only areas that have been under sugarcane cultivation will be reforested and strictly speaking the
vegetation of the project area is therefore “cultivated land”. In addition, 63.9 ha of fallow sugarcane
fields will be reforested. Some of the land has been infested by invasive alien plants and transitional
weeds that are to be removed prior to reforestation. Under South African Law, land owners are
legally obliged to remove such invasive alien plants irrespectively. The removal is therefore currently
being undertaken by the eThekwini Municipality as the owner of the land concerned.

1
    Rob Scott-Shaw, Ezemvelo KZN Wildlife, P.O. Box 13053, Cascades, 3202, Pietermaritzburg, South Africa
                                                                                                            4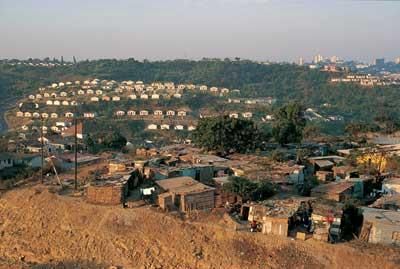
Figure 4. A vegetation map of the buffer zone of the Buffelsdraai landfill site. Reforestation activities are
concentrated on areas previously used for the cultivation of sugarcane.

Table 1. Summary of the extent of vegetation types in the Buffelsdraai landfill site buffer zone prior to
rehabilitation activities (copied from Macfarlane et al. 2011, Appendix A). Only sugarcane, transitional weed
and fallow lands will be reforested.
Vegetation Type                                    Area (Ha)                   Area (%)
Sugarcane                                          377.1                       46.6%
Woodland                                           95.7                        11.8%
Riparian Forest                                    72.2                        8.9%
Transitional Weed                                  67.2                        8.3%
Fallow lands                                       76.3                        9.4%
Thicket                                            63.4                        7.8%
Indigenous Forest (non riparian)                   33.6                        4.2%
Grassland                                          3.5                         0.4%
Maintained area                                    6.1                         0.8%
Rural Settlement                                   10.6                        1.3%
Infrastructure                                     2.7                         0.3%
Bareland                                           0.7                         0.1%
Total                                              809.1                       100.00%
                                                                                                                5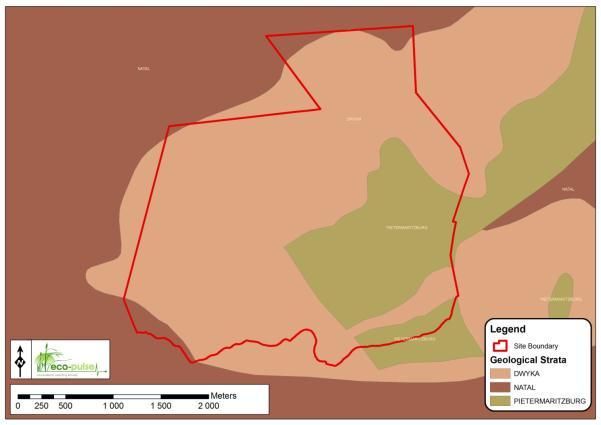
G1.3 – General Information: The boundaries of the project area and the project zone
The project area consists of the active and fallow sugar cane fields and the transitional weed areas
within the Buffelsdraai landfill site buffer zone (Fig. 4). The land is owned by the eThekwini
Municipality and management responsibility rests with Durban Solid Waste (a department of the
eThekwini Municipality). The landfill site is approximately 116ha in size and the buffer zone 809ha.
The project area is 520.6ha of the 809ha landfill buffer.
The project area is located between the towns of Verulam and Inanda, some 35km from the Durban
city centre (Fig. 1). The landfill was constructed in 2006 to accommodate increasing quantities of
waste produced from the northern suburbs of Durban, the new King Shaka Airport and the Dube
Tradeport.
A large portion of the buffer zone has been leased to Tongaat-Hulett (a large commercial agricultural
multi-national company), for the production of sugar cane and it is this portion of the buffer zone
that will be reforested2.
The greater project zone includes the urban and peri-urban residential areas of Buffelsdraai and
Osindisweni (Fig 5). Residents from these three communities are participating in the tree growing
projects and are employed for the re-planting and maintenance of the site. There are a small
number of tree-preneurs in the Ndwedwe settlement as well.
G1.4 – Climate information: current carbon stocks within the project area
An overview of the current land-use and associated carbon stocks in the project area
As described in Section G1.2, the greater Buffelsdraai Landfill Site buffer zone project area consists
of a mosaic of different land use- and vegetation types. The only part of the greater project area
that will be directly affected by the reforestation activity are those areas that are currently under
sugarcane cultivation. The reforestation program will not directly affect the remaining area
consisting of indigenous Riparian Forest, Thicket, Non-Riparian Forest, Grasslands and Infrastructure,
and there is little reason to assume that the carbon stocks within these areas will change due to the
implementation of the project (clarity on potential leakage is contained in Section CL 2.1). The
assessment of current carbon stocks and changes in carbon stocks due to the project activity,
therefore only consider changes in carbon pools in the area that is currently under sugarcane
cultivation.
Considering sugarcane land
Sugarcane lands are planted, burnt, harvested and cleared on an annual basis (SASRI 2010, pers
comm. David Armstrong and Rennie Reddy, Tongaat Hulett).
Although carbon accumulates and is temporarily stored in the biomass of sugarcane during the
growing season, the aboveground component is released back into the atmosphere as the cane
is burnt, harvested and processed each year.
2
The area of the Buffelsdraai landfill site and its buffer zone was previously owned by Tongaat Hulett prior to purchase by
the eThekwini Municipality to establish the landfill site.
6
Concerning the belowground component, studies on the affect of sugarcane farming on the size
of the soil organic carbon pool indicate that there is negligible long-term sequestration of carbon
in soils (Galdos et al. 2009) 3. Long-term empirical studies over 61 years undertaken at the
Mount Edgecombe sugar industry research unit located near the Buffelsdraai Landfill site
(
Note that only the aboveground woody tree biomass pool will be monitored over the course of the
project. A monitoring plan will be submitted within six months.
Carbon pools excluded from monitoring and the GHG emission reduction calculations:
Soil organic carbon
The production of sugarcane has a negligible effect on soil organic carbon stocks over time
(Galdos et al. 2009). Although the reforestation activity is likely to lead to an increase in soil
carbon stocks, it is viewed as too expensive to monitor relative to associated carbon revenues
due to the size- and heterogeneity of area considered.
Herbaceous layer
Although some form of herbaceous layer will establish under the forest canopy and sequestrate
atmospheric carbon dioxide during the reforestation process, the size of pool is likely to remain
relatively small and will not warrant the cost of monitoring, reporting and verification.
Deadwood
In a similar manner to the herbaceous carbon pool, although some deadwood would accumulate
during the reforestation process, the size of pool is likely to remain relatively small and not
warrant the cost of monitoring, reporting and verification.
Litter layer
In a similar manner to the herbaceous and deadwood carbon pools, although a litter layer would
accumulate during the reforestation process, the size of pool is likely to remain relatively small
and not warrant the cost of monitoring, reporting and verification.
The current carbon stocks in each carbon pool in the project area
The project area is currently being used for the production of sugarcane and would therefore be
classified as ‘cropland’ according to the IPCC 2006 guidelines. As sugarcane is a perennial grass
species, in terms of its consideration according to the guidance provided in Section 5.2.1.1 of the
IPCC 2006 Guidelines for AFOLU, we consider it a non-woody ‘perennial crop’ as the entire above-
ground component is annually harvested in mid-June; rather than a ‘perennial woody crop’ such as
coffee, fruit or nut orchards, where only a small fraction of the plant is harvested and the woody
biomass component of the plant remains on site from year to year. Whereas there is a temporary
increase in the size of the aboveground carbon pool during the growing season, the carbon
sequestered in the pool is released back into the atmosphere at the end of the growing season
through burning, harvesting, processing and clearing processes.
The default Tier 1 IPCC 2006 biomass carbon stock value for perennial cropland located in dry,
tropical areas is 1.8 tC.ha-1 (the project site would be classified as a dry, tropical area as the mean
annual precipitation is less than 1000mm, Figure 3A.5.2 IPCC 2006, also see IPCC 2006, Table 5.9
below).
8As only 80% of the 520ha is farmed each year (416 ha), the biomass carbon stock for the project area
can be estimated as:
416 ha x 1.8 tC.ha-1 = 748.8 tC
or
-1
1.44 tC.ha across the full 520ha
In addition to the default IPCC 2006 biomass carbon stock value estimation, a further calculation was
made based on local input data and peer-reviewed publications. The calculation is based on the
assumptions listed in the table below.
An average of 45 tons of sugarcane is produced per hectare per year. Each ton of burnt and cropped
sugarcane, yields 740kg of liquid (sugarcane juice) and 260kg of moist bagasse (or 130kg of dry
bagasse, Gupta and Demirbas 2010, Table 2 below). As dry bagasse is 42.26% carbon, the carbon
stock per hectare at the end of the growing season is:
45 tons Cane.ha-1.yr-1 x 0.13 (dry bagasse fraction) x 0.4226 (carbon content) = 2.47 tC.ha-1
However, this is the size of the carbon pool at the end of the growing season, not the average size of
the biomass carbon stock through the year. According to the IPCC 2006 guidelines, the average size
of the carbon pool over time should be calculated including the net effect of burning and harvesting.
For calculation purposes, if sugarcane is assumed to start growing shortly after harvest and have a
linear rate of growth through the year, it can be assumed that the average size of the biomass
carbon pool over the period of a year is approximately half of the carbon stock at the end of the
growing season. Hence, the average size of the biomass carbon pool for considered sugarcane fields
would be:
2.47 tC.ha-1 x 0.5 = 1.23 tC.ha-1
Again, as only 80% of the 520ha is farmed each year (416 ha), the biomass carbon stock for the
project area can be estimated as:
416 ha x 1.23 tC.ha-1 = 511.7 tC
or
-1
0.98 tC.ha across the full 520ha
9This calculation however, only includes the aboveground or ‘shoot’ part of the plant. If one assumes
that 18% of plant biomass is located in the roots of sugarcane (Smith et al. 20055), the total (root +
shoot) biomass carbon stock in the project area is estimated to be:
0.98 + 0.21 (root component) = 1.19 tC.ha-1
As this estimated carbon stock value is based on more site-specific data and conversion ratios
compared to the IPCC 2006 guideline figures, it shall be used in the carbon stock changes calculation
below in Section G2.3.
Table 2: Input data and conversion ratios used to calculate the average biomass carbon pool currently present
in the project area.
Field Value Metric Reference
Total area under sugarcane 520 ha eThekwini Municipality
Area farmed each year 80 % eThekwini Municipality
Area left out of production each year 10 % eThekwini Municipality
Area replanted each year 10 % eThekwini Municipality
Actual area farmed each year 416 ha eThekwini Municipality
Average production of cropped sugarcane 45 t/ha.yr Tongaat Hulett
Dry bagasse fraction per cropped ton of cane 0,13 kg/t Gupta and Demirbas 2010*
Carbon content of dry bagasse 42,26 % de Figueriredo et al 2010**
Root : shoot ratio 0,21 % Smith et al. 2005***
*Gupta R. B. & Demirbas A. (2010) Gasoline, diesel and ethanol biofuels from grasses and plants. Cambridge University Press,
Cambridge.
**de Figueriredo E. B., Panosso A. R., Romao R. & La Scala N. (2010) Greenhouse gas emissions associated with sugar production in
southern Brazil. Carbon balance and management 5, doi:10.1186/750-0680-5-3.
***Smith, D.M., N.G. Inman-Bamber, and P.J. Thorburn. 2005. Growth and function of the ugarcane root system. Field Crops Res.
92:169–183.
5
Smith, D.M., N.G. Inman-Bamber, and P.J. Thorburn. 2005. Growth and function of the sugarcane root
system. Field Crops Res. 92:169–183.
10Figure 5. A map indicating the project area and the project zone of the Buffelsdraai Landfill Site Community
Reforestation Project.
G1.5 – Community Information: A description of communities located in the project zone
The Buffelsdraai Landfill Site Community Reforestation Project is located within eThekwini
Municipality, in the province of KwaZulu-Natal, which contains eleven district municipalities as
shown in Fig. 5.
11Figure 5. Political map of South Africa and KwaZulu-Natal province showing the location of eThekwini
Municipality.
Population estimates for 2010 indicate that KwaZulu-Natal (KZN) is home to 21% of the country’s
total population of over 49, 9 million. It is the second most productive province in terms of economic
output but there are severe inequalities in income distribution: 54.3% of its population live below
the national poverty line6 which is slightly higher than the country’s average of almost 50%. The
unemployment rate for KZN is 22.7%, which is roughly in line with the national average of 24%
(Pauw, 2005). The economic situation is aggravated by the HIV and AIDS pandemic. Recent estimates
indicate that 26.4% of KZN’s working-age population is HIV-positive, compared to 15.9 percent in the
rest of the country (Matthews et al. 2008).
eThekwini is a municipality of great contrasts with regards to demography, geography and economy.
The Buffelsdraai Landfill Site Community Reforestation Project is active in one ward (ward 59) of the
eThekwini Municipal Area, and specifically two communities within this ward, namely; Buffelsdraai
and Osindisweni.
Despite being one of the smallest municipalities in terms of spatial area, eThekwini houses almost
one third of the province’s total population. Durban is its main urban centre and one of the five
major cities in South Africa in terms of contribution to the overall GDP. The wealth concentrated in
6
Various absolute and relative poverty lines are used in South Africa. This assessment has considered Elsenburg’s absolute poverty line
and adjusted to 2010 current prices. The resulting absolute poverty line for 2010 is R 8 845 income per person per annum. Elsenburg: A
profile of Kwazulu-Natal: Demographics, poverty, inequality and unemployment, 2005pag. 8.
12the city of Durban explains the fact that overall, the municipality has the lowest municipal poverty
rate in KZN, with only 25% of its population living below the national poverty line (as compared to
the provincial average of 54%). Population figures and demographic spread is summarised in Table 3.
Table 3. Population figures and demographic spread for the eThekwini Municipality and KwaZulu-Natal
2010.
Black Coloured Asian White Total % of KZN
population
eThekwini 1 760 335 139 716 667 777 358 822 2 926 650 32.6%
Total KZN 7 457 345 177 113 809 052 547 596 8 991 109
Percentage of 82.9% 2% 9% 6.1%
race group per
total KZN
population
Whilst the Black population is dominant, in line with overall provincial trends, every demographic
group is well represented within the municipality.
This diversity however, is not equally spread across the municipality, a great majority of Asian and
White populations are concentrated around the urban centre of Durban. The conventional
urban/rural divide is thus also a racial divide within the province.
Another important fact to note is that there is virtually no poverty among the White population
whilst 64.4% of the Black population within the province lives below the national poverty line.
The average per capita income of the people of KwaZulu-Natal (R10, 824) does not compare badly to
the average per capita income of South Africa (R12, 411), however, the income distribution in
KwaZulu-Natal is a lot less equal (Figure 5). In eThekwini, this is particularly the case because the city
of Durban has a much higher per capita income compared to that of the outlying areas such as
Buffelsdraai. So even though the municipality as a whole has a lower overall poverty rate than other
areas, specific areas such as Buffelsdraai, still experience high rates of unemployment and poverty
(Pauw, 2005).
72%
Poverty Rate
28%
Urbanised areas Rural areas
13Figure 5. Difference in poverty rates among rural and urban populations within KwaZulu-Natal (Pauw, 2005).
As can be seen from the graph, poverty is much more prevalent in rural areas (Fig. 5). The
communities involved in and benefitting from the Buffelsdraai Landfill Site Community Reforestation
Project are located in peri-urban areas (in between urban and rural areas) with large African
populations. The research presented above directly points to the existence of high levels of poverty
within the project communities.
The property within which the project area lies is owned by the project proponent, the eThekwini
Municipality, and no indigenous peoples or communities are present within the project area.
With regard to governance structures, KwaZulu-Natal is one of the provinces in South Africa where
traditional leadership is most influential. Traditional leadership structures are a recognised
constituency in the Constitution. They have a specific mandate with respect to communal land
ownership and management and therefore have an important role to play in most initiatives
involving land use in peri-urban and rural areas where communal land ownership is most prevalent.
In the context of the project communities, the role of traditional leadership is considered through
ongoing consultation with local government and community representatives.
Table 3 shows a summary of key demographic figures for the communities of the project zone. As
previously stated, the eThekwini Municipal Area as a whole has a lower overall poverty rate as
compared with other areas in the province; however, specific areas such as the project communities,
still experience high rates of unemployment and poverty (Table 3).
Buffelsdraai and Osindisweni are peri-urban areas (in between urban and rural areas and lie on the
outskirts of Durban. The research shows the existence of substantial levels of poverty within the
project communities.
14Table 3. Demographics of the Buffelsdraai Community Tree planting project zone communities namely
Buffelsdraai and Osindisweni (copied from Appendix B).
Demographics Buffelsdraai Osindisweni
Population
Total 3, 123 2, 365
Black 2, 933 (91%) 2, 293 (97%)
Coloured 15 (0.6%) 9 (0.2%)
Indian 257 (8%) 46 (2%)
White 8 (0.3%) 17 (0.8%)
Female 1, 639 (51%) 1, 380 (58%)
Male 1, 574 (49%) 988 (42%)
Disabled 161 (5%) 168 (7%)
Age
5-14 years 601 (19%) 531 (22%)
15-34 years 1, 338 (42%) 1, 039 (44%)
35-64 years 817 (25%) 466 (20%)
> 65 years 106 (3%) 114 (5%)
Employment Status (15 to 65 years):
Employed 868 (27%) 368 (16%)
Unemployed 477 (15%) 476 (20%)
Not economically active 815 (25%) 673 (28%)
Literacy Rate (> Grade 7): 1, 178 (37%) 1, 324 (56%)
Dependency Ratio: 4:1 6:1
Household income per household per annum:
No income 257 (27%) 94 (24%)
R1- R4 800 113 (12%) 21 (5%)
R4 801 – R9 600 189 (20%) 72 (18%)
R9 601 – R19 200 217 (23%) 80 (20%)
R19 201 – R38 400 119 (12%) 64 (16%)
R38 401 61 (6%) 55 (14%)
Source: www.durban.gov/durban/wardCatalog/index_html
Figure 6. Informal settlements in eThekweni peri-urban area (Source: South African Cities Network 2010)
15Despite eThekwini Municipality overall having lower poverty levels compared to other areas in the
province, the communities in the project zone are at the lower end of the scale with high levels of
unemployment and poverty (Figure 5). Living conditions experienced by the project communities can
be illustrated by looking at the availability of basic services; out of a total of 6 309 households, over
10% of them do not have access to refuse disposal and almost 20% of those do not have access to
running water within their dwelling. Lack of public service delivery is more prominent in specific
areas, like Buffelsdraai, where a total of 64% of households have refuse disposal and as little as 17%
of households have water within their dwelling. This also speaks to the predominance of informal
and traditional dwellings in this particular community. Informal shelters, often as small as 6m² and
made of tin (Figure 6), are a common feature of the South African urban landscape: one out of three
people who live in an urban environment, does not have formal shelter7.
In terms of public infrastructure, Buffelsdraai also scores behind if compared with its population size.
This community has only 1 school, while Osindisweni has 2 schools and 1 community hall.
According to municipal statistics there are: 953 households in Buffelsdraai, 42 % of which are formal
dwellings; and 396 households in Osindisweni, 75 % of which are formal dwellings, the rest of the
dwellings are traditional or informal.
The area in which the project communities are based is a striking example of polarisation of living
standards based on location and population group. Even though the three communities this study
focuses on are situated in one of the productive and economic hubs in the province, they are still
characterised by low income profiles, exclusion from productive economic activity and high
dependency ratios. Interventions such as the Buffelsdraai Landfill Site Community Reforestation
Project and the Wildlands Conservation Trust tree-preneur programme are important in helping to
alleviate some of the effects that poverty has on communities such as these.
G1.6 –Current land use and customary and legal property rights
The property is owned by the project proponent, the eThekwini Municipality (see Appendix C,
attachment A). A portion of the property is still leased to the previous owner, Tongaat Hulett, to
continue with their sugarcane operations. Farming is however being phased out as the reforestation
project is rolled out and will come to an end when the lease expires (see Appendix C, attachments B
and C, for the notice period).
Buffelsdraai and Osindisweni are rural townships and land-use can be described as residential. There
are no land claims on the property or unresolved property disputes within the project area. Although
South Africa is in the process of implementing a land reform process there are no land redistribution
issues within the project area. Moreover, the area has been settled for a long time.
Land within Buffelsdraai is privately owned, as is a portion of Osindisweni. The north eastern portion
of Osindisweni is on communal land.
7
www.durban.gov/durban/wardCatalog/index_html
16G1.7 – Biodiversity Information: A description of current biodiversity within the project zone
Eco-Pulse Environmental Consultants undertook a comprehensive study of the biodiversity within
the buffer zone of the Buffelsdraai landfill site (Appendix A). The woodlands within the buffer zone
typically have a canopy height of between 8-12m, ranging from sparse woodlands to dense thicket.
A total of 54 indigenous tree species were recorded within the buffer zone (Appendix A). In the
various forest and woodland types Xylotheca kraussiana, Syzigium cordatum and Combretum molle
have the highest importance values. The project area, specifically sugar cane lands, have no
indigenous tree species present.
Approximately 4.8% of the untransformed areas in the buffer zone have high levels of invasive alien
plant infestation, which if not controlled, is considered a significant threat to the biodiversity of the
project area (Appendix A). Almost 25% of the total buffer zone is considered to have high levels of
invasive alien plant infestation by species such as Chromalena odorata, Lantana camara, Eucalyptus
spp., Arundo donax, Melia azedarach, Mango spp., Psidium guajava, Solanum mauritanium and
Ricinus communis.
Nine bird species were encountered in the sugarcane lands compared to 80 species in surrounding
forests and woodlands. The nine species were notably grassland species that are capable of
adjusting to sugarcane and fallow fields (Appendix A). Both the sugarcane and surrounding habitats
have few rodent species (five in total). This is not unusual for the broader coastal habitat type.
Ten amphibian species occur on the site. Most are wide ranging, common species that were found
close to the riparian zones or small wetlands. Wahlberg’s Snake-eyed Skink (Afroblepharus
wahlbergii) occurs in the sugar cane, but is a wide-ranging species that will most likely also be found
in other habitats on the site. Only two other reptile species were recorded in the existing woodlands,
namely Southern Vine Snake (Thelotornis capensis) and the Variable Skink (Trachylepis varia).
In a similar manner to other taxa, sugarcane and fallow lands had few invertebrate species present.
Only one millipede species is unique to sugarcane while the remaining species are also found in
other habitats within the project area. In contrast, the existing woodland and forest habitats have
high numbers of millipedes and molluscs, with up to 20 species recorded in the south facing forests
(Appendix A).
G1.8 – Biodiversity Information: Areas of High Conservation Value
Appendix A provides a detailed description of areas of high conservation value within the project
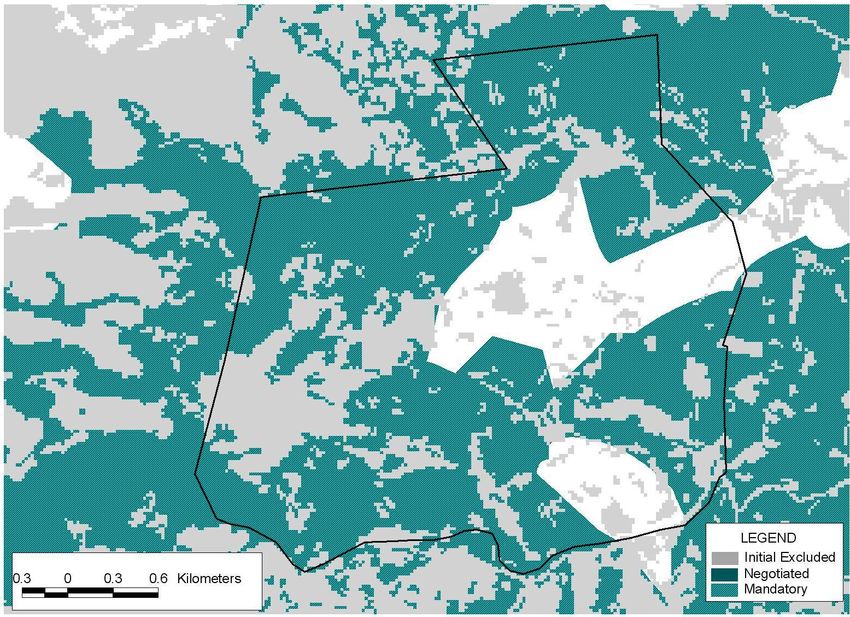
zone which is summarised in Table 4. A Minset map (Fig. 8) was obtained from Ezemvelo KZN
Wildlife (the provincial conservation body mandated with the protection of the province’s
biodiversity) that indicated that large parts of the project zone have a mandatory conservation
status. In addition, the previous conservation plan for the region listed the project area as
irreplaceable in it’s entirety, although the classification could potentially be erroneous or at a too
course scale as it is categorised as North Coast Grassland. KwaZulu-Natal Coastal Forest
(Endangered) and Eastern Scarp Forests: Southern Coastal Scarp Forest (Vulnerable) patches occur
within the project zone.
17Figure 7. Minset map indicating areas requiring protection (Ezemvelo KZN Wildlife Systematic Conservation
Plan, 2010) .
Data from the Ezemvelo KZN Wildlife database furthermore lists 11 vertebrate, one bird and 10
plant species as well as 5 vegetation types of high conservation value that could possibly occur in the
project zone, which emphasises the importance of rehabilitating the area (Table 4). Several of the
species are also listed under the National Environmental Management: Biodiversity Act (no. 10 of
2004) (NEMBA) and are endemic to the province (Table 4). Reforestation of the area will thus
provide new suitable habitat for a host of endemic rare species in a region where much of the
indigenous forest vegetation has been transformed.
Table 4 List of important biodiversity features potentially occurring in the project area and surrounding project zone.
The list was obtained from the Ezemvelo KZN Wildlife database (Table from Appendix A).
Taxa Scientific Name English Name National IUCN NEMBA Status Endemism
listing
Bird Gyps africanus White-backed Near - N/A
Vulture Threatened
Invertebrates Centrobolus - - - Endemic to KZN
anulatus
Invertebrates Cochlitoma - - - Endemic to KZN
semidecussata
Invertebrates Doratogonus Cristulate black Least Concern Endemic to KZN Endemic to KZN
cristulatus millipede
Invertebrates Doratogonus - Least Concern - Endemic to KZN
falcatus
Invertebrates Doratogonus Natal Black Vulnerable - Endemic to KZN
natalensis Millipede
Invertebrates Doratogonus Wandering black Not evaluated Not evaluated Endemic to KZN
peregrinus millipede
Invertebrates Doratogonus Ruby-legged Endangered - Endemic to KZN
rubipodus Black Millipede
Invertebrates Edouardia conulus - - - -
Invertebrates Euonyma - - - Endemic to KZN
lymneaeformis
18Invertebrates Gnomeskelus - Not evaluated - Endemic to KZN
spectabilis
Invertebrates Gulella separata - - Endangered Endemic to KZN
Plant Barleria natalensis - - - Endemic to KZN
Plant Begonia rudatisii - - - -
Plant Craterostigma - - (Ordinance) Endemic to KZN
nanum Protected
Plant Dahlgrenodendron - Endangered - Endemic to
natalense Pondoland and
KZN
Plant Diaphananthe Orchid - (Ordinance) Endemic to RSA
millarii Specially
Protected
Plant Pseudoscolopia False red pear Near Endemic to RSA Endemic to KZN
polyantha Threatened (Ordinance)
Protected
Plant Streptocarpus - Vulnerable - -
molweniensis
Plant Streptocarpus Cape primrose - - -
primulifolius
formosus
Plant Vernonia africana - - (Ordinance) Endemic to KZN
Protected
Plant Gerrardanthus - - (Ordinance) Endemic to KZN
tomentosus Protected
Vegetation (Durban Metropole) - - Critically -
Type North Coast Endangered
Grassland
Vegetation Eastern Scarp - - Vulnerable -
Type Forests : Southern
Coastal Scarp Forest
Vegetation KwaZulu-Natal - - Endangered -
Type Coastal Forests
Vegetation KwaZulu-Natal - - Endangered -
Type Sandstone Sourveld
Vegetation North Coast - - - -
Type Bushland
Table 5 summarises the conservation value of the landfill buffer area. No IUCN red listed species
were found within the project area, but there is a chance that they might occur within the remainder
of the landfill buffer (Table 4). The area in general is considered to be of critical conservation
importance by the local authorities and conserving and rehabilitating it will thus make a significant
contribution to the maintenance of the critically endangered North Coast Grassland vegetation type
(Table 5).
Table 5 Overview of conservation status of Buffelsdraai Landfill Site Community Reforestation Project in context of CCBA criteria
(Appendix A)
Value 1 Globally, regionally or nationally significant concentrations of biodiversity values Criteria met
No legally protected areas occur within the project area. It is however worth noting that the
Protected areas long-term intention is to have the area managed as a “conservancy” defined as “The voluntary No
co-operative environmental management of an area by its community and users”.
While a range of threatened species are predicted to occur within the project area, no species
formally included on the IUCN Red List have been identified during baseline surveys
undertaken on the site. Two Near Threatened bird species were recorded however. In
Threatened addition, four of the mollusc species (Coclitoma semidecussata, Gulella dunkeri, Gulella
Possible
species natalensis and Euonyma natalensis which are restricted to coastal forest / coastal and scarp
forest habitats have had the extent of their occurrence and occupancy reduced through
development and habitat degradation and they would meet the criteria for a classification of
at least Vulnerable.
Endemic species Five millipede and six mollusc species endemic to KwaZulu-Natal were recorded from the Possible
19project area. Several of these species are confined to the coastal area, or the coast and
Midlands area of the province. From a bird species perspective, the Knysna Turaco and Cape
White eye are endemic to South Africa, but are relatively common species. From a
herpetological perspective, the Bush Squeaker and Natal Tree Frog are near –endemics to
KwaZulu-Natal province. Despite this diversity of endemic species, this area is not regarded
as a particularly important area for endemism.
Significant
concentration of
species during No notable concentrations of endangered species have been recorded within the project area. No
part of their life
cycle
Globally, regionally or nationally significant large landscape-level areas where viable
Value 2 populations of most if not all naturally occurring species exist in natural patterns of No
distribution and abundance
The project area occurs within a highly transformed landscape. As a result, natural patterns of distribution and abundance have been
significantly disrupted in the area.
Value 3 Threatened or rare ecosystems Yes
The Department of Environmental Affairs and Tourism (DEAT) recently requested the South African National Biodiversity Institute
(SANBI) to assist in the process of listing threatened or protected ecosystems. Preliminary outcomes are available (SANBI & DEAT. 2009)
and classifies Durban Metropole North Coast Grassland, in which the site is located is a Critically Endangered vegetation type. This is in
response to estimates that suggest that only 4% of the natural ecosystem still remains. Within this vegetation type, patches of KwaZulu-
Natal Coastal Forest (Endangered) and Eastern Scarp Forests: Southern Coastal Scarp Forest (Vulnerable) also occur. A number of these
forest patches occur in the project zone. Despite the presence of fragments of threatened vegetation types, it should be noted that
better examples of such areas do occur outside of the project zone.
Areas that provide critical ecosystem services (e.g., hydrological services, erosion control,
Value 4 No
fire control)
A number of indigenous forest patches are present within the project zone. These areas certainly help to control erosion and act as
useful natural firebreaks. These services are not regarded as critical at the regional or national level however.
Areas that are fundamental for meeting the basic needs of local communities (e.g., for
Value 5 essential food, fuel, fodder, medicines or building materials without readily available No
alternatives)
The site is located within a peri-urban landscape where subsistence use of natural products is still likely to be an important part of
livelihood support. Areas within the project zone were previously owned by commercial farmers, who considerably restricted use of
untransformed areas. Given the context and availability of alternatives for most community members, the area is not regarded as
fundamental in meeting basic needs of local communities.
Areas that are critical for the traditional cultural identity of communities (e.g., areas of
Value 6 cultural, ecological, economic or religious significance identified in collaboration with the Unlikely
communities)
The project area is not of critical cultural importance to any of the communities living within the project zone.
G2. Baseline Projections
G2.1 – The most likely land-use in the absence of the project activity
The project area is currently a commercial sugarcane plantation and has been used as such since
1934. The eThekwini Municipality currently gains an income by renting the land to Tongaat Hulett
for the cultivation of sugarcane. There is no legislation that obliges the project proponent (eThekwini
Municipality) to change the current land-use to another form. Existing legislation and permits for the
landfill site limits land-use practices in the project area to agricultural activities or open space based
land uses. Due to the proximity of the project area to the landfill site, there is no reason to assume
that the legislated permitted land use type for the project area would be changed to an alternative
land-use such as a residential, retail or recreational zone.
The baseline ‘business-as-usual’ land-use scenario would therefore be the continued cultivation of
the project area as per the existing lease between Tongaat Hulett and the eThekwini Municipality
(Appendix C). Such sugarcane cultivation activities would result in GHG emissions generated through
the preparation of the land, planting, the application of fertilizers and herbicides, pre-harvest
burning, transport and machinery used in the process of delivering the cane to the mill.
G2.2 – Additionality
20Alternative Land Use Scenarios: The project site falls within the buffer zone of a landfill site and
there is clear legislation that limits land use practices within the buffer zone to agricultural activities.
There is currently no legislation that obliges the eThekwini Municipality to restore the land to its
original state, other than keeping it clear of invasive alien plant species.
Commercial sugarcane farming is a common and financially viable land-use practice in the area.
Although the actual sugarcane crop can be considered neutral in terms of the net change in biomass
carbon stocks over a year (the crop grows but is harvested and cleared each year), the farming
operations do lead to the generation of GHG emissions. The baseline “business-as-usual” scenario
with regard to GHG emissions, will include emissions from sugarcane planting, fertilization, pest
control and harvesting. GHG emissions are also generated through the sugar milling and sugar by-
product production process, but to be conservative, the scope boundary of the GHG emissions
calculation has been set at the point of delivery of the sugarcane at the gate of the mill.
Investment Analysis: There is very little opportunity for the project to generate any financial
benefits other than income from carbon markets. It is also financially more lucrative for eThekwini
Municipality to lease out the land to Tongaat Hulett than to restore it to an indigenous forest state.
Appendix C is a copy of the lease agreement between the municipality and Tongaat Hulett indicating
the revenues received through the lease of the land for the cultivation of sugarcane.
Barrier Analysis: There is no need to perform barrier analysis as the project is not generating any
income other than that from the carbon markets.
Common Practice Analysis: The project proponent is not aware of any indigenous reforestation
project in South Africa that has been or is currently being undertaken for commercial gains other
than those generated through the carbon markets. There are no indigenous forests in South Africa
that are harvested on a large scale for commercial timber or other products.
G2.3 - Carbon Stock Changes
In terms of the land-use class and carbon pools considered in the calculation of carbon stock changes
and GHG emissions associated with a “without project” baseline reference scenario; as described in
Section G1.4, the only part of the greater project area that will be directly affected by the
reforestation activity are those areas that are currently under sugarcane cultivation which is
considered as ‘perennial cropland’ as per the guidance provided in Section 5.2.1.1 of the IPCC 2006
Guidelines.
Regarding the carbon pools concerned; as described in Section G1.4, the production of sugarcane
does not lead to a significant change in the soil organic carbon pool or the belowground root
biomass carbon pool over time (Galdos et al. 2009) and therefore they are not included in the
calculation of changes in carbon stocks here.
Only changes in the aboveground woody, aboveground non-woody (sugarcane) and belowground
woody carbon pools shall be considered when calculating the net effect of the project activity on
atmospheric GHG concentrations. But as the size of the above- and below-ground woody carbon
pools are currently zero and will only come into existence with the reforestation activity, they are
21also not considered in the estimation of carbon stock changes under a baseline “without project”
scenario.
Therefore, to calculate carbon stock changes and GHG emissions associated with a “without project”
baseline reference scenario using Equation 2.3 of the IPCC 2006 Guidelines (copied in below); only
the potential change in perennial cropland biomass carbon pool (sugarcane) is considered as well as
GHG emissions generated through fire, harvesting and land preparation.
Considering the potential change in the perennial cropland biomass carbon pool
In the absence of the proposed project, the land will remain under sugar cane cultivation. The net
change in the carbon pool located in the biomass of a sugar cane crop over a year is considered to be
zero, as it is burnt, harvested and the land is cleared at the end of each growing season.
As stated in Section 5.2.1.1 of IPCC 2006 Guidelines:
“The change in biomass is only estimated for perennial woody crops. For annual crops, increase in
biomass stocks in a single year is assumed equal to biomass losses from harvest and mortality in that
same year - thus there is no net accumulation of biomass carbon stocks.”
Fallow sugarcane fields that are currently weed infested, would be cleared prior to replanting and
would thus be removed regardless of the reforestation project.
Greenhouse gas emissions due to harvesting and management operations
Sugar cane production requires a substantial amount of mechanised land preparation, portions of
the cultivated area have to be re-planted annually and synthetic fertilizers are applied to the land.
The harvested crop is then transported to the sugar mill. The fuel and fertiliser requirements listed
below and in Table 6 were obtained from the Sugarcane Research Institute (SASRI 2010) and
Tongaat Hulett (David Armstrong pers. comm.)8 .
The sugarcane production system followed at present is as follows:
8
Mr David Armstrong, Tongaat Hulett, Amanzimnyama Hill Road, Tongaat, KwaZulu-Natal, P O Box 3, Tongaat
4400, South Africa
22 The total area that is or recently was under sugarcane is 520.6 ha
A minimum tillage system is followed
80% of the total area is harvested annually and synthetic fertilizer applied
10% of the total area is re-planted annually using minimum tillage, this process includes the
application of herbicides and synthetic fertilizers of which herbicides on average contain 30%
active ingredients and fertilizer 28%.
10% of the total area is left out of production
60% of the harvested area is burnt annually and the tops are windrowed before harvesting
40% of the harvested area is pre-treaded by thrash blanketing because they are too close to
residential areas or the landfill-site to be burnt, this is done by hand and does not result in GHG
emissions.
The harvested crop is first transported to a haulage point 1km away from the cultivation area in
a 6t vehicle.
From the haulage point the crop is transferred to a 30t transporter and taken to the mill, which
is located 24km away.
The site produces on average 45 tons of sugarcane per hectare per year.
The calculation of the annual GHG emissions generated through the various land-preparation and
harvesting activities is included in Table 6 below. The conversion ratios listed in Lal (2004), Carbon
Trust (2010) and DEFRA (2010) where used to calculate GHG emissions due to each activity. These
conversion ratios were chosen in preference to the IPCC 2006 ratios following comprehensive
review, as they are more up to date and more applicable to South African agricultural activities.
(This set of conversion ratios is used by the South African Fruit and Wine Industry Climate Change
initiative: http://www.climatefruitandwine.co.za/ - which following the peer-review of the
conversion ratio set in 2010, reviews the ratios annually)
23Table 6. Baseline greenhouse gas emissions from the cultivation of 520.6 ha for the production of sugarcane at Buffelsdraai, KwaZulu-Natal, South Africa.
Measurement Consumption Application Total Total Total tCO2e
Category Activity Emissions Source Emissions factor
Unit per unit area/Distance Consumption tCO2e/yr 20 yrs
Minimum tillage fuel use replanting 10% of
a
Fossil fuels area annually (includes hoeing and fertilizer l/ha 15 l 52.1 ha 780.9 l Diesel 2.67 kgCO2/l fuel 2.1 41.7
application)
Total fuel consumption to transport entire
Fossil fuels crop from haulage point to mill (18741.6t km/l 5l 29986.6 km 5997.3 l Diesel 2.67 kgCO2/l fuel 16.0 320.5
crop transported in 30t loads 48km at a time)
Total fuel consumption to transport entire
Fossil fuels crop haulage point (18741.6t crop km/l 5l 6247.2 km 1249.4 l Diesel 2.67 kgCO2/l fuel 3.3 66.8
transported in 6t loads 2km at a time)
Ratoon management - cane burnt and tops
Fossil fuels l/ha 10 l 249.9 ha 2498.9 l Diesel 2.67 kgCO2/l fuel 6.7 133.5
windrowed, includes fertilizer application
Annual fertilizer application on area treated
Fossil fuels l/ha 10 l 166.6 ha 1665.9 l Diesel 2.67 kgCO2/l fuel 4.5 89.0
with thrash blanket - fuel usage
Fossil fuels Manual planting – ridging only l/ha 12 l 52.1 ha 624.7 l Diesel 2.67 kgCO2/l fuel 1.7 33.4
b
Re-planting herbicide application minimum 4.84 kgCO2/kg
Herbicides l/ha 2.88 l 52.1 ha 149.9 l Glyphosate 0.7 14.5
tillage system, 10% of total area applied
c
Synthetic Harvested area synthetic fertilizer application N based synthetic 0.72 kgCO2/kg
t/ha 0.4 t 416.5 ha 166.6 t 0.1 2.4
Fertilizers annually (5:1:5), 80% of total area fertilizer applied
c
Synthetic Re-planted area synthetic fertilizer N based synthetic 0.44 kgCO2/kg
t/ha 0.35 t 52.1 ha 18.2 t 0.0 0.2
Fertilizers application annually (2:3:4), 10% of total area fertilizer applied
c
Synthetic Re-planted area synthetic fertilizer N based synthetic 0.77 kgCO2/kg
t/ha 0.25 t 52.1 ha 13.0 t 0.0 0.2
Fertilizers application annually (1:0:1), 10% of total area fertilizer applied
Total 35.1 702.2
a) DEFRA (2010), Carbon Trust (2010), b) Adapted from Lal (2004), c) Adapted from Lal (2004)
24Greenhouse gas emissions due to the pre-harvest burning of cane
The pre-harvest burning of the sugarcane crop results in methane (CH4) emissions (Weier 1998).
Equation 2.27 listed in the IPCC 2006 guidelines and the input data listed in Table X, were used to
calculate the carbon dioxide atmospheric forcing equivalent of the generated methane emissions:
Table X: Input data and conversion ratios used to calculate the average biomass carbon pool currently present
in the project area.
Field Value Metric Reference
Total area under sugarcane 520 ha Tongaat Hulett
Area farmed each year 90 % Tongaat Hulett
Fraction of cultivated area burnt each
60 % Tongaat Hulett
year
A: Area burnt each year 280,8 ha Tongaat Hulett
M: Mass of fuel available for combustion 5 tons.DM / ha SASRI 2010
C: Combustion factor 0,8 Dimensionless Table 2.6, IPCC 2006
Emission factor (CH4) 4 g CH4/ kg Delmas 1993
G: Emission factor (CO2 forcing
84 gCO2/kg DEFRA 2010
equivalent. 1 CH4: 21 CO2)
The annual tCO2e emissions due to pre-harvest burning can therefore be calculated as:
Lfire = A (280.8) x MB (5) x Cf (0.8) x Gef,CO2e (84) x 10-3
Lfire = 94.34 tCO2e.year-1 or 1886 tCO2e over 20 years
Annual GHG emissions generated under a baseline scenario:
The GHG emissions associated with a “without project” baseline reference scenario can be
calculated as the sum of emissions generated through harvesting, land-preparation and fire,
together with the potential change in biomass carbon stocks.
25As described, the change in the biomass carbon pool of perennial crops is assumed to be zero. The
sum of the GHG emissions generated through harvesting, land-preparation and fire is calculated as:
Annual GHG emissions = 35.1 + 94.3 = 129.4 tCO2e
Over 20 years = 702.1 + 1886.9 = 2589 tCO2e
G2.4 – Baseline effect on communities?
The Buffelsdraai Landfill Site Community Reforestation Project is being implemented in a
municipality owned buffer area between the landfill site and adjacent communities. Prior to the
landfill site being established, the entire area was owned by Tongaat Hulett, a major agri-processing
business in Southern Africa for the purpose of sugar cane farming. This is a predominant agricultural
activity in the greater Durban area and it is performed by small scale farmers as well as major
corporations.
At that stage, the land was being farmed by Tongaat Hulett directly as well as a number of small
scale farmers (evaluators have been unable to establish the exact number, but indications are that it
was 1 – 2 small scale farmers).
26You can also read