Improving Public Transport to Meet Community Needs: A Warrnambool Case-study - Report prepared by J & J Stanley for Bus Association Victoria and ...
←
→
Page content transcription
If your browser does not render page correctly, please read the page content below
Improving Public Transport to Meet
Community Needs: A Warrnambool
Case-study

Report prepared by J & J Stanley for
Bus Association Victoria and
Warrnambool Bus Lines

18th October, 2004.

                       1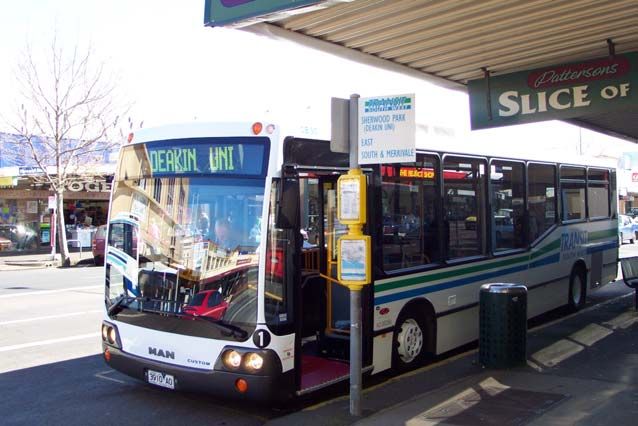
CONTENTS

Executive Summary ............................................................................................................ 4
  Aim ................................................................................................................................. 4
  Warrnambool and its Transport Services........................................................................ 4
  Transport Disadvantaged Groups and Their Travel Needs............................................. 5
  Accessibility Planning .................................................................................................... 6
  Main Proposals................................................................................................................ 7
1. Context........................................................................................................................ 9
  1.1      Rationale for this Study ...................................................................................... 9
  1.2      Aims of the Study ............................................................................................. 12
  1.3      Definitions......................................................................................................... 14
  1.4      Report Structure ................................................................................................ 14
2. The Warrnambool Area and its Public Transport Services ...................................... 16
  2.1      Location and Demographics ............................................................................ 16
  2.2      Transport Services and Use in Warrnambool ................................................... 18
     2.2.1        Route Bus Services and Their Use............................................................ 19
     2.2.2        School Bus Services.................................................................................. 24
     2.2.3        Total Urban Bus Service Boardings ......................................................... 25
     2.2.4        V/Line Passenger Services........................................................................ 26
     2.2.5        Smaller Town Services ............................................................................. 27
  2.3      Community Transport....................................................................................... 27
     2.3.1        Scope......................................................................................................... 27
     2.3.2        Some Regional Examples ......................................................................... 28
     2.3.3        Some Issues in Community Transport Provision...................................... 29
  2.4      Taxis.................................................................................................................. 30
3. Transport and Travel Surveys................................................................................... 31
  3.1      Scope................................................................................................................. 31
  3.2      Warrnambool Shopping and Bus Users’ Survey .............................................. 31
     3.2.1        Main Survey Findings............................................................................... 31
     3.2.2        Transport improvements ........................................................................... 36
  3.3 Young People.......................................................................................................... 37
     3.3.1        Secondary Student Surveys....................................................................... 37
     3.3.2        Other Consultations Concerning Young People’s Transport.................... 39
     3.3.3        Conclusions on Young People .................................................................. 42
  3.4      Deakin University Students in Residence......................................................... 42
     3.4.1        The University .......................................................................................... 42
     3.4.2        Some Transport Issues from the Study Consultations .............................. 43
     3.4.3        Survey of Students in Residence............................................................... 44
     3.4.4        Deakin’s Survey........................................................................................ 46
  3.5      Seniors............................................................................................................... 46
     3.5.1        Travel Questionnaire................................................................................. 47
     3.5.2        Other transport information ...................................................................... 50
     3.5.3        Conclusions on Seniors............................................................................. 51
  3.6      People with a Disability .................................................................................... 51
     3.6.1        Response from the Questionnaires............................................................ 52

                                                                   2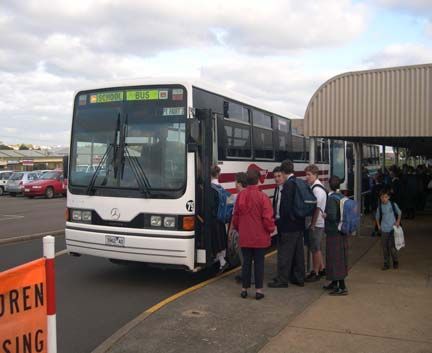
3.6.2      Information from interviews ..................................................................... 53
     3.6.3      Conclusions about people with a disability .............................................. 54
  3.7      Major Employers .............................................................................................. 55
     3.7.1      Midfield Meats.......................................................................................... 55
     3.7.2      Dairy Farmers ........................................................................................... 55
     3.7.3      Hospitals ................................................................................................... 56
     3.7.4      Conclusions on Major Employers............................................................. 57
  3.8      Lower Income Groups ...................................................................................... 57
  3.9      The Indigenous Community ............................................................................. 59
  3.10 Rurally Isolated People ..................................................................................... 59
  3.9      Tourists ............................................................................................................. 60
  3.10 Bus Drivers ....................................................................................................... 61
  3.11 Other Households.............................................................................................. 63
  3.12 Some Data Overviews....................................................................................... 67
     3.12.1     Trip Rates.................................................................................................. 67
     3.12.2     Trips by Day of Week............................................................................... 67
     3.12.3     Trip Length ............................................................................................... 68
4. Institutional Arrangements........................................................................................ 70
  4.1      Scope................................................................................................................. 70
  4.2      Accessibility Planning ...................................................................................... 70
5    Conclusions and Recommendations ......................................................................... 75
  5.1      Public Transport Service Frequency and Coverage.......................................... 75
  5.2      Improved Service Marketing ............................................................................ 78
  5.3      Regulatory Reform............................................................................................ 79
  5.4      System Planning................................................................................................ 80
  5.5      Expected Beneficiaries and Costs of Initiatives................................................ 81
  5.6      Road Improvements .......................................................................................... 84
References......................................................................................................................... 85
Appendix A: Warrnambool Shopping and Bus Users’ Survey ........................................ 87
Appendix B: Persons Interviewed .................................................................................... 91

                                                                  3
Executive Summary
Aim
This study commences Bus Association Victoria’s process of seeking to understand the
connections between public transport service provision, social exclusion and personal
wellbeing in a regional community. This is a vast agenda. The major aim of the present
study is a relatively modest first step along this path. The study aims to explore travel
patterns of groups that typically include many transport disadvantaged people and to
identify the priorities they see for transport improvements that will reduce their
disadvantage, using Warrnambool as a case study and with a focus on the role of public
transport.
Transport disadvantaged groups comprise young people, seniors, persons with a
disability, people on low incomes, rurally isolated and Indigenous people.
Warrnambool and its Transport Services
Warrnambool is located on the coast about 260 kilometres south-west of Melbourne, in
Victoria’s Western District. The Warrnambool regional economic and social catchment
is home to about 35,000 people, who live in one of the fastest growing areas within
Victoria. This growth is adding to needs for improved public transport services.
The area has a higher population concentration in the older and younger age groups than
the rest of the State. Both these age groups tend to be relatively dependent on public
transport for access. They already account for four out of every five tickets sold on the
Warrnambool route bus service. Numbers in both age categories are growing. At the
same time, the population is ageing, with an associated increase in the requirement for
public and/or community transport services.
Warrnambool currently has three major local/regional public transport systems:
1. route bus services: with about 7.8 service kilometers per capita provided, about
three quarters the level available in outer Melbourne. Services do not cater for
normal journey to work times because of the heavy service focus on school travel;
2. school bus services: half a million service kilometers per year are provided, with
about 500,000 student boardings annually. These services are complemented by
shuttle services and urban school services that carry an additional half million
journeys per year. In total, carriage of school children accounts for five out of
every six route plus school service journeys per year;
3. regional bus services (V/Line): 50,000 passengers per year and 450,000 service
kms.
There is also a rail service to Melbourne.
4In addition to these public passenger transport services, a number of community transport
services have grown up, usually centred around various community health, aged or
disability services and/or using Council-provided vehicles. These services are meeting
vital mobility needs for some groups but many of the transport services are facing
operating problems. Service availability is restrictive and efficiency of vehicle use tends
to be low.
Taxis play a minor but important complementary transport role.
Transport Disadvantaged Groups and Their Travel Needs
The study focused mainly on travel needs of transport disadvantaged groups but also
gathered some comparative information on those without such disadvantage.
A shopping survey, where car use clearly dominated travel mode choice, together with a
small household survey, clearly showed the strong attachment to the car in the region and
the high level of mobility it provides. Car use frequently involves traveling
accompanied, indicating an important social benefit from such travel.
Route bus users tend to see they have no travel alternative, 2/3 having no car available
and some others not possessing a drivers’ licence. Bus users often travel alone and the
travel experience itself is an important part of social inclusion. The two-hour ticket tends
to encourage quick trips, which discourages social inclusion and can cause financial
difficulties for those on low incomes.
Young people can be both independent and dependent in terms of travel needs.
Independence comes from being able to walk or cycle for many trips, with weekends
being notable. Dependence comes from reliance on parents/others for car travel,
especially during the week and particularly for those living outside urban Warrnambool.
Some young people are doubly disadvantaged by living in non-urban locations and in low
income households who are unable to pay for alternative transport (e.g. a second
household car or taxi fare). Particular problems were found in relation to youth access to
alternative educational programs, work and entertainment, with rural youth facing the
greatest transport disadvantage.
Deakin University residential students without a car tend to face transport difficulties,
particularly outside route bus service times. Reliance on others for travel is common and
is seen by many as a source of concern. Female international students face particular
problems, being least likely to ask others for lifts. The University sees improved public
transport service levels as an important input to increasing overseas student numbers.
Wednesday night (“pub night”) public transport services were highlighted as an
important need.
5Seniors are a significant and growing part of the regional population. Car use is high and
those with car availability tend to have good accessibility. However, the strong car
culture among many seniors is associated with neglect of planning for personal mobility
requirements in later years, when car use is less of an option or simply not possible.
Road safety issues may arise from this lack of planning.
Those without car access are at greater risk of social exclusion. Community transport
services target some of these groups but tend to focus more on those with a disability.
Many people with a disability have not been part of the car culture and have organized
their mobility requirements around using alternatives. These alternatives include public
transport, community transport, walking, friends’/families’ vehicles and taxis. Those
with a disability living outside urban Warrnambool face particular problems.
Those on low incomes are reliant on public transport, being unable to buy other transport
options. Those in geographically disadvantaged areas and particularly young single
mothers in these areas are a group at high risk of social exclusion.
The region includes several major employers. These are not major markets for public
transport use at present, because of factors like the timing of services and the car culture
in Warrnambool. They remain an opportunity for service development.
The regional Indigenous community has its own buses that are well utilized. The need
for such vehicles is indicative of transport disadvantage faced by many in this
community, who feel uncomfortable using route buses. Many in the Indigenous
community experience multiple sources of transport disadvantage.
Tourism is important in the region but the potential for integration with public transport
services has not been exploited.
Bus drivers are usually well regarded by bus users and provided ideas for service
development that would assist transport disadvantaged groups. Service extensions and
further introduction of low floor buses were favoured options.
Accessibility Planning
Personal transport is essentially about meeting accessibility needs and fostering social
inclusion. However, institutional arrangements for service delivery tend to occur along
different lines (e.g. particular services and modes), such that no government entity is
responsible for accessibility. Public transport services, school bus services and
community transport services operate mainly in isolation, rather than being seen as part
of a single service delivery system.
The British approach is to implement an “accessibility planning” approach, based on
giving local government ownership of accessibility problems. By this approach, clear
6responsibility is assigned for dealing with issues raised by transport disadvantage/social
exclusion.
The nine studies currently being carried out in Victoria as part of the Transport
Connections program are, in some ways, attempting to carry out an accessibility planning
function. However, these studies lack a strategic framework within which to approach
accessibility planning.
Local government should play a co-ordinating role in local/regional accessibility
planning but should not have a direct role in service provision. Higher level (system-
wide) co-ordination should be undertaken at State level. Regional Accessibility Planning
Councils (RAPCs) should be established, based around transport/activity catchment areas
and driven by local government, to undertake needs assessment and propose
improvement priorities. Regional transport resources should be managed in a more co-
ordinated way to meet such needs. Particular focus should be devoted to making greater
use of the school bus fleet to meet transport needs of transport disadvantaged groups.
Main Proposals
The study suggests four main areas for improvements, to better meet the travel needs of
transport disadvantaged groups:
1. public transport service frequency, span and coverage;
2. marketing of public transport services;
3. regulatory reform, to increase the flexibility with which services can be made
available; and,
4. the arrangements for planning of transport systems within the region and State.
The first two sets of proposals relate specifically to Warrnambool, though the proposals
have more general applicability. The last two are proposals for State-wide systemic
change.
The main short term justification for local/regional service improvements is social equity:
bringing Warrnambool service levels closer to those that are available in outer suburban
Melbourne. Longer term, environmental sustainability and road safety arguments also
support a greater role for regional public transport.
The major detailed proposals made by the study are:
SERVICE ENHANCEMENTS
1. Increase service frequency/span of the Warrnambool route bus service
- Evenings to 7.00pm
- Mornings from 7.00am
- Saturdays add an afternoon and Night Rider service
7- Sundays
- Specific services targeted at major employers
2. Service Warrnambool growth suburbs
3. Provide Wednesday “pub night” service for Deakin
4. Trial route/tourist service in Port Fairy, using a school bus
5. Introduce twice weekly day-time services plus Saturday night services from Mortlake
and Hawkesdale to Warrnambool, using school buses
6. Trial charter bus services to special community events at Deakin
MARKETING INITIATIVES
7. Implement an expanded route service marketing program in Warrnambool.
8. Provide enhanced customer service training to route bus drivers.
9. Provide awareness programs for seniors re route bus services.
10. Route bus operator plus Council to promote bus use among Indigenous community
11. Extend transport concessions to international students and carers (the latter on
V/Line)
12. Allow student concession cards to be purchased over time.
13. Change two-hour route ticket to three hours.
14. Route bus service contracts should include marketing incentives.
REGULATORY REFORM
15. Provide greater flexibility in use of school bus services by non-students.
16. Provide Disability Discrimination Act exemption for use of school buses to provide
route services in areas/times lacking other services.
SYSTEM PLANNING
17. Encourage school communities, including tertiary institutes, to develop Sustainable
Travel Plans.
18. Establish a Regional Accessibility Forum, led by Warrnambool Council, to identify
and prioritise regional accessibility needs.
19. State Government responsibilities for transport/accessibility should be centred in the
Department of Infrastructure.
In round terms, the annual cost of implementing the regional initiatives is about $0.38
million in urban Warrnambool, after offsets and increased fare revenue, and $140,000 in
other parts of the region, less increases in fare revenues. In addition, there is some one-
off funding proposed for Sustainable Travel Plans and a marketing campaign.
81. Context
1.1 Rationale for this Study
The Australian Bus Industry Confederation’s (BIC) National Policy Statement 2001:
Building a Public Transport Culture (2001), spells out the industry’s five key goals for
improved sustainability of Australia’s land transport passenger task. One of these five
goals relates to equity in service provision. The Equity Goal reflects both (1) BIC’s view
that public transport should be available to provide mobility options for all, and
especially for those without access to a private car, and (2) an acceptance by BIC that this
is an integral part of providing more sustainable land transport systems.
This value perspective on the need for basic levels of mobility to be available does not
take one far, however, in terms of defining more clearly just what levels of mobility are
required in particular circumstances. Should there be some basic minimum irrespective
of location or should remote regional areas be treated differently to regional cities and to
the outer urban fringes? Do all people, especially those groups who have difficulty
participating fully in society due to age, disability, low income etc. (i.e. those
experiencing social exclusion) have equal access to transport? What measures can be put
in place to achieve the equity goal, outlined above? Is there a way that organizations
with an interest in these issues of transport accessibility and the problems of social
exclusion can work together to improve people’s wellbeing and quality of life?
The notion of social exclusion is presently in use in many policy contexts as a means of
understanding equity issues. Social exclusion is a broad descriptor relating to people or
groups of people who have problems in participating fully in activities essential for
wellbeing. Problems of mobility/access are recognized as being potentially significant
contributors to social exclusion. Groups who are often seen as transport disadvantaged,
in the sense that they have poor access to transport, often tend to coincide with those
groups seen as socially excluded.
Considerable work around the concept of social exclusion has taken place in the United
Kingdom in recent years. The term was originally used to broaden understanding about
poverty, particularly unemployment. Under this concept, the inability of people to be
fully participating members of society is viewed more broadly than only in terms of a
shortage of money, to include other forms of disadvantage. Thus, people may be socially
excluded due to disability, age, unemployment, lack of transport, race, etc. The logic of
this approach is that the way of including people with these disadvantages is not only, or
even necessarily, to give them more money but also to develop social policies which
specifically address their sources of disadvantage. To give a transport example, a person
may be socially excluded due to their unemployment, which in turn may be because of a
lack of transport available to take him or her to and from available employment.
Reducing transport disadvantage may increase the person’s employment prospects and, if
successfully realized, increase social inclusion, and a person’s wellbeing.
9With social exclusion being a significant political issue in the UK, Prime Minister Tony
Blair established the Social Exclusion Unit (SEU) in 1997, the Unit now sitting in the
Office of the Deputy Prime-Minister. Reflecting the expected significance of transport to
the whole concept of social exclusion, the SEU undertook a major study on this issue
very recently (SEC 2003). Links were drawn between the exclusion of people who do
not have access to a car, and their needs for education, employment, access to health and
other services and to food shops, as well as to sporting, leisure and cultural activities.
Findings from the SEU’s transport study have been organized into five groups of barriers
which need to be addressed in order to improve accessibility to key services that are
central to social inclusion and where there is a transport connection (Fig 1.1). These are:
1. The availability and physical accessibility of transport
2. The cost of transport
3. Services are located in inaccessible places
4. Safety and security – fear of crime
5. Travel horizons – people on low incomes were found to be less willing to travel to
access work than those on higher incomes.
1. Improving 2. Making travel
physical accessibility more affordable
and availability
Measures
that can help
tackle
accessibility
5. Widening problems
travel horizons 3. Reducing the
need to travel
4. Safer streets and stations
Fig. 1.1: An Accessibility Planning Framework (drawing on SEU 2003, p.6)
The SEU argued that to remove these barriers and reduce social exclusion through
transport improvements, there is a need to understand how people access key activities
10and link this with planning to improve such accessibility (accessibility planning), as well
as undertaking key strategic policy initiatives, such as:
• reviewing the regulations governing provision of bus services (especially relevant to
the UK context where de-regulation of service provision has taken place outside
London);
• integration of transport planning into planning for services provision (e.g. education);
• a range of initiatives to make transport more accessible, such as reducing cost and
addressing the fear of crime associated with public transport;
• the formation of partnerships between transport providers, local authorities and local
service providers, such as education and health, and work on transport solutions.
To a large degree, the work on transport and social exclusion has been a conversation
about accessibility in a narrow sense, about the need for people to obtain goods and
services and get to work, school, recreation, etc. There does not appear to have been any
systematic attempt to go further and examine how reducing transport disadvantage can
impact on the general wellbeing of those who benefit from transport improvements.
Brief mention has been made about the dynamic nature of the relationship between
transport and social exclusion. For example, as noted above, a person may be socially
excluded because he or she is unemployed, and due to their unemployment status, they
are unable to afford the cost of travel (or there may be no public transport) out of their
local living area in order to seek employment. There is also some discussion in the
literature on the interface between health and transport. For example the UK Royal
Commission on Health (Acheson 1998) argues that better public transport leads to lower
car usage, with resultant health benefits for the general population (e.g. through gaining
the benefits of exercise and resultant impacts on obesity and stress levels). There is also
a beneficial health impact through lower pollution levels. Such issues have recently
received press coverage in Australia in relation to population health in Western Sydney
(Sydney Morning Herald 2004).
The present report also identifies another area where transport may impact on personal
issues around social exclusion and personal wellbeing. Transport accessibility enables
people to form associations or relationships and engage with other people and groups.
This can be understood in terms of the development of social capital (see definition 1.4),
that leads to improved wellbeing, a reduction in stress, anxiety and depression levels. The
act of being on public transport, in itself, may improve social capital, as travel offers
opportunities to engage with other travelers.
BIC is unaware of any Australian Federal or State Government ever having explicitly
tried to deal with the issues discussed above (accessibility, social exclusion, equity,
transport disadvantage etc) in a systematic manner. Instead, governments tend to make
particular decisions that have direct or indirect access rationales and/or consequences
(e.g. subsidizing sea passenger transport to Tasmania; subsidizing regional rail and bus
services), usually without seeing these as part of a specific and comprehensive policy
agenda on meeting access/mobility needs.
11Given:
• the large amounts State Governments, in particular, spend on supporting public
transport services,
• the widely recognized need to improve the sustainability of our land transport
systems,
• the role that changing modal shares in favour of low impact modes such as walking,
cycling and public transport can play in enhancing land transport sustainability, and
• the growing recognition that the social exclusion of some groups/individuals in
society can underpin many wider social and personal problems, such as ill-health,
vandalism, etc,
there are strong grounds for seeking a better understanding of the role that public
transport systems play in providing mobility/accessibility and preventing social
exclusion.
To further its own understanding of the role that access/mobility play in community and
individual welfare and to explore the role that public transport plays in this regard, Bus
Association Victoria, a member of BIC, has initiated two studies:
• this Warrnambool case study, examining access/mobility issues in the Victorian
coastal town of Warrnambool and its surrounds, supported by Warrnambool Bus
Lines;
• the Victorian Access Study, a broader study undertaken with the support of the Royal
Automobile Club of Victoria, the Municipal Association of Victoria and the Victorian
Transport Association. This latter study is examining access/mobility issues in
several Victorian regions but in less detail than the Warrnambool study.
These studies will be supported by a theoretical paper which examines the present
understandings of transport and social exclusion. This report outlines the findings from
the first of these studies, the Warrnambool case study.
1.2 Aims of the Study
The Warrnambool case study commences the BAV’s process of seeking to understand
the connections between public transport service provision, social exclusion and personal
wellbeing in a regional community. This is a vast agenda. The major aim of the present
report is a relatively modest first step along this path. The study aims to explore travel
patterns of groups that typically include many transport disadvantaged people and to
identify the priorities they see for transport improvements that will reduce their
disadvantage, using Warrnambool as a case study.
The major focus is on the current and prospective role of public transport in meeting the
needs of transport disadvantaged groups, both because public transport (or, more
specifically, buses) is the constituency that BAV represents and because public transport
12is believed to play a vital role in providing mobility for transport disadvantaged groups
and individuals.
This process will shed light on the broader question of social exclusion and it will suggest
ways in which public transport improvements can assist in reducing such exclusion. It
should also help to more clearly define a longer term study process that will enable a
broader understanding of the links between public transport service provision, transport
disadvantage, social exclusion and personal wellbeing. BAV/BIC’s suggested model of
the relationships between these conditions is shown in Figure 1.2, with the present study
working at the front end of the model. BAV and BIC are in discussion with Monash
University about a more comprehensive study that will examine the connections through
to social exclusion and wellbeing.
While this study is an investigation into the connections between public transport services
and transport disadvantage in a Victorian regional community, it is intended to both (1)
produce specific proposals for improving public transport services that will meet the
needs of transport disadvantaged people in the Warrnambool community and (2) to
suggest ways in which regional public transport service provision more generally might
be better organized to meet the needs of transport disadvantaged groups and individuals.
Public transport
availability/quality
Transport
disadvantage
Other
influences
Social exclusion
Wellbeing
Fig 1.2: Model of relationships between public transport and personal conditions
131.3 Definitions
In this report, the following definitions are used:
accessibility = the ease with which a person can get to particular services, locations,
and/or other people, as required by that person;
mobility = the ease with which a person moves around;
transport disadvantage = a situation where people experience a shortage of transport
options, which restricts their mobility and hence their access to goods, services and
relationships;
social exclusion = the existence of barriers which make it difficult or impossible for
people to participate fully in society
social capital = a measure of networks, trust and reciprocity within a community.
Thus, it is possible (for example) for a person to be able to move around freely (have high
levels of mobility) but not have good access to shops, banks, etc, because of a poor
residential location choice. Equally, a person may live next door to a bank but not be
able to access this facility because of some personal disability. Other factors relevant to
social exclusion, such as low income, ethnicity or disability, may reduce accessibility. A
person’s social capital reflects that person’s social networks or contacts and is both a
contributor to, and a resultant outcome of, mobility, accessibility and social exclusion.
1.4 Report Structure
As background to considering travel needs of transport disadvantaged groups in the
Warrnambool area, Chapter Two of this report provides an overview of the Warrnambool
area and its surrounds in terms of location and demographics and its various forms of
public and community transport, including some benchmarking of services. This
highlights some of the demographic trends affecting the likely incidence of transport
disadvantage in the community and places service provision in a broader Victorian
context. It also summarises some of the community transport services that exist in the
area and highlights some of the issues facing services delivered through that sector.
Chapter Three focuses on transport disadvantaged groups and on bus users, because
many bus users experience transport disadvantage. It presents information gained from
consultations and surveys with such groups about their travel patterns and needs and
identifies some ways in which transport services could be improved to assist such groups,
focusing on issues raised by the groups concerned.
Chapter Four deals with institutional arrangements for the delivery of public and
community transport services. It presents the concept of accessibility planning, as a new
framework within which regional public transport service provision might be improved.
This framework seeks to involve key regional stakeholder groups and individuals in the
process of identifying priorities for regional public/community transport improvement
and to improve the efficiency with which resources are used in service delivery. The
14discussion in this chapter emerges from the Warrnambool analysis but is relevant State-
wide.
Chapter Five sets out the report’s main findings and recommendations for improving
public transport in the region. It indicates the expected beneficiaries, if the
recommendations are implemented, together with the expected costs of implementation.
Adoption of the proposals that are presented should do much to reduce social exclusion in
the region and enhance the equity of service provision, both within the region and
between the region and other parts of the State. It is only, however, one step along the
path of better understanding the connections between regional public transport provision,
social exclusion and personal wellbeing.
152. The Warrnambool Area and its Public Transport
Services
2.1 Location and Demographics
Warrnambool Local Government Area is located on the coast about 260 kilometres
south-west of Melbourne, in Victoria’s Western District. The Princes Highway provides
a direct road link to Geelong and Melbourne to the east and Adelaide to the west. The
central core of Warrnambool is south of the Princes Highway, just inland from the coast.
Portland and Port Fairy, both on the coast to the west, are also significant centres,
Portland well known for its aluminium smelter and port and Port Fairy for its heritage
values.
Residential development in Warrnambool is located mainly north of the Princes Highway
but also to the east and west/north-west on the southern side of the Highway. Small
satellite towns have developed at Allansford (east) and Dennington (north-west), with
small rural residential developments at Woodford and Bushfield to the north.
Industrial development is mainly located to the north west of the centre. Major employers
include Midfield Meat, Nestle, Dairy Farmers, two large hospitals (St John of God and
Warrnambool Base) and Deakin University. Future industrial development is likely to
include the Allansford area.
At the time of the 2001 Census, Warrnambool City had a population of about 27,750
(rounded, including Dennington and surrounding rural areas). Population grew by about
4,200 from 1991 to 2001, a gain averaging over 400 persons per year. The population
growth rate averaged 1.8% p.a. from 1991-96 and 1.5% p.a. from 1996-2001
(Department of Sustainability and Environment, 2004). These are strong growth rates.
This high rate of population growth, well above the State average, will quickly put
pressure on land supply, reflected in Council’s decision to undertake the Warrnambool
Land Use Strategy.
Table 2.1 compares the age structure of the Warrnambool municipality with that for
Victoria as a whole, in 2001. It shows that Warrnambool has a higher concentration in the
60+ age groups than the state as a whole (17.74%, compared to 16.86%), with the
difference mainly concentrated in the 70-84 years age group. Warrnambool is also more
highly concentrated in the younger age groups (0-4, 5-17, 18-24), with the 5-17 years
grouping being 1.5 percentage points higher than the state average in 2001. The higher
share in the 18-24 years age group may reflect the tertiary educational role played by the
area (e.g. Deakin University; Warrnambool TAFE). Conversely, Warrnambool’s
population shares are a little lower than the state as a whole in the working age groups of
25-59.
16Table 2.1: Age Structure
Age Group (years) Warrnambool (%) Victoria (%)
0-4 7.24 6.50
5-17 19.66 18.15
18-24 10.12 9.54
25-34 13.16 14.95
35-49 21.48 22.42
50-59 10.6 11.63
60-69 7.61 7.59
70-84 8.43 7.74
85+ 1.7 1.49
Source: http://www.doi.vic.gov.au/Doi/knowyour.nsf
The Warrnambool Land Use Strategy (Parsons & Brinkerhoff, 2004, p.4) refers to two
sets of population projections for the area. It points out that the Department Of
Infrastructure’s projections suggest population growth rates averaging 0.4 to 0.8% over
the two decades to 2021, while the Department of Sustainability and Environment’s
projections are for an average growth rate of 0.6% per annum. Both sets of projections
are low in comparison with the experience of the preceding decade. The Warrnambool
Land Use Strategy quite rightly implies that a higher population outcome would not
surprise. The number of households is projected to grow faster than the population (at
1.0% p.a.), in light of the trend to smaller household sizes.
The Warrnambool Land Use Strategy quotes State Government projections that the 60-
69 and 50-59 years age groups will have the greatest net growth over the coming two
decades (Parsons & Brinkerhoff 2004, p.5). The Warrnambool Aged and Disability
Strategic Plan (J. Prideaux and Assoc. 2003) points out that 6,610 people are expected to
be aged over 60 in 2011, up from 5,070 in 2011, a growth rate averaging a high 2.7% p.a.
By 2021, the number aged over 60 is projected to increase to 8,800 people, or 26.2% of
the Warrnambool population. This reflects both the general ageing amongst the Victorian
(and Australian) population and the tendency for coastal locations with well developed
service centres, including regional health and community facilities, to be attractive
retirement destinations.
The numbers of young people (5-19) are projected to grow by about 860 between 2001
and 2011 and then to fall by about 680 to 2,021. If overall population growth exceeds the
rates projected by DOI/DSE, then the rate of decline on the younger age groups would be
expected to slow. These numbers suggest that the market for school bus travel in
Warrnambool (ignoring surrounding municipalities) is growing at present, is likely to
continue growing for some years and then to decline by about 10% between 2011 and
2021, unless strong population growth is sustained. Numbers in 2021, on this basis,
would probably be similar to today, in total.
Associated with the projected increase in numbers of older people is a projection of
growing numbers of people with a disability. The Warrnambool Aged and Disability
17Strategy estimates that 5,550 people in Warrnambool had a disability in 2001. This
number is expected to grow to 6,810 by 2010, with the number aged over 65 growing
fastest. Those with mobility difficulties are, and are projected to remain, the largest
disability group (about 930 estimated to be in this group in 2001). Those requiring
transport assistance were estimated at 1,370 in 2001.
Halstead (2002) summarises a range of socio-economic indicators for Warrnambool and
the neighbouring Corangamite and Moyne municipalities, in the Healthy Communities:
Community Profile report. That report concludes:
Taken as a separate Local Government Area, Warrnambool has a higher proportion of
single parent families, Indigenous Australians, more single person households, more
single parent households, fewer sixteen years olds at school, a higher unemployment rate
and fewer households in owner-occupied dwellings, than the other two municipalities and
the state as whole. It scores lower on the Index of Relative Disadvantage (ie is more
disadvantaged) … than Corangamite, Moyne and the state as a whole (p.16).
In short, there is a higher than usual likelihood of disadvantaged people living in the area,
with an associated likelihood of higher than usual numbers of transport disadvantaged
people.
Halstead (2002) also summarises a number of health indicators for Warrnambool. Injury
rates are above average for both males and females, road traffic accidents being
suggested as a contributor. Hospital admissions were higher than expected for both men
and women. Some of these indicators may be high because Warrnambool is a regional
base for health and medical services, attracting people needing such services. From a
transport planning and policy perspective, however, the area is starting with some issues
in the health area and these will presumably only get worse as the population ages. This
will create growing demands, for example, for health-related transport.
2.2 Transport Services and Use in Warrnambool
There were just under 11,000 households in Warrnambool in 2001. Of these, 8.8% had
no motor vehicle and 38.4% had only one vehicle. In short, almost one in two
households had only one or no cars.
Reflecting the orientation of peak hour bus services to school travel (discussed further
below), only 41 people used bus services for their journey to work at 2001 census time.
Only 173 rode a bicycle to work. Bus services sought to cater for the journey to work
some years ago but declining patronage led to the deletion of these services. Nearly
9,000 people travelled to work by car at 2001 census time, 8,083 as a car driver (75.3%)
and 904 (8.4%) as a passenger. 5.9% walked.
There are four major sets of public transport services provided for people in the
Warrnambool area. These are:
18• route bus services;
• school bus services;
• regional coach services, including the Warrnambool to Port Fairy services; and,
• the rail service to Melbourne via Geelong.
In addition to these “regular” services, there are various charter services, provided to
groups such as schools, seniors, etc, and services provided by a range of community
transport providers and taxi operators, together with air services.
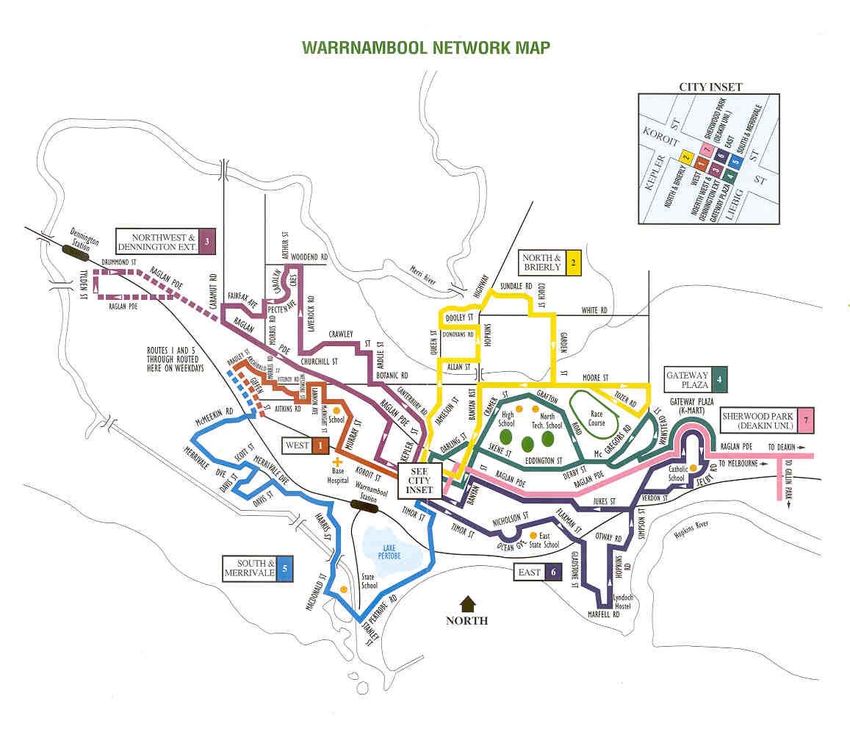
2.2.1 Route Bus Services and Their Use
Transit Southwest provides regular route bus services in Warrnambool. There are seven
main routes, as shown in Map 2.1: West; North and Brierly; North West; Gateway Plaza;
South and Merrivale; East; and Deakin. A further Transit Southwest route service
operates between Warrnambool and Port Fairy, and there are morning worker services to
the industrial locations of Fletcher Jones and Nestles.
During the week, the route services primarily operate on an hourly frequency,
commencing after the school peak and finishing around 6.00pm. On Saturdays, most
services have three or four runs, with an hourly frequency and the last service finishing
before 1.00pm. There are no Sunday services. Dennington and Allansford, growing
suburbs on the western and eastern edges respectively, have considerably fewer daily
services than are provided to most areas (4 compared to 8-10 to most areas on weekdays
with no Saturday services to Dennington and Allansford).
Service frequencies are lower and the span of hours is shorter than in Metropolitan
Melbourne. Saturday services are also lower in Warrnambool, and Sunday services non-
existent.
Bus service provision can be looked at in terms of the amount of service provided
relative to population size (vehicle kilometers per capita). Warrnambool has 266,000
vehicle kilometers of route bus service for a population today in route service areas of
about 34,000, or about 7.8 vehicle kilometres/per capita. This compares to about 10 in
the Greater Dandenong area, an area encompassing the very fast growing outer suburb of
City of Casey, with low levels of public transport service, as well as the central area of
Dandenong, with much higher service levels. Bus services in the Greater Dandenong
area have poor frequencies in the growth areas, poor weekend service availability and
poor weekday service spans, which is similar to the Warrnambool service characteristics.
Figure 2.1 broadens the comparison and shows that Warrnambool has a relatively low
level of service provision compared to a number of larger centres. Its service level is
closer to that in outer suburban Melbourne, where the need for improved service levels is
recognized by the State Government’s Melbourne 2030 Strategy (Booz Allen Hamilton
2002), than to the other centres shown.
19Map 2.1: Warrnambool Route Services
FIg. 2.1: Public Transport Service
Kilometres Per Capita
80
70
60
Kms/pc
50
40
30
20
10
0
g
ne
ra
ol
g
rt
on
on
ba
bo
er
ur
en
l
nb
Ho
am
ee
bo
nd
Ca
G
el
rn
Da
M
ar
W
er
at
re
G
20If all the route and school bus services (including shuttles) are combined, the end result is
a total of about 25 vehicle kilometers per capita per annum of service available in the
wider Warrnambool area (excluding V/Line), which is about 6 kms/p.c. below the figure
for metro public transport services provided in Melbourne as a whole. The main
difference is that the Warrnambool outcome is very heavily geared towards school
student travel, where the services are for particular users and are not available to any user
wishing to travel, whereas the Melbourne services cater for a wider range of users and
travel purposes.
The Koroit Street bus interchange
Figure 2.2 shows boardings on each of the Warrnambool urban bus routes in 2003, based
on ticket sales plus passenger transfers data. Total boardings were 163,000 in that year,
with the most highly patronized services being North West, Gateway Plaza, East and
Deakin (all exceeding 20,000 boardings for the year). The services with the lowest
patronage levels were the “Other” services in Figure 2.1, these being the limited worker
specials run to Fletcher Jones and Nestles and a connection to the station. It is suggested
that the two special worker runs be reviewed to understand why patronage has decreased,
investigate whether other work locations can be encompassed in this run or whether the
runs should cease. The connection to the station only counts those people traveling
between the station and Koroit Street. Most people will board elsewhere and will be
therefore counted in their longer route trip. Apart from these very minor services, the
West service and South and Merrivale service are the two that stand out as having the
poorest patronage performance in aggregate terms.
Patronage can also be looked at in terms of boardings per vehicle kilometer (BVK), to
get around the problem that low patronage on any particular route may be due to low
service kilometers. Figure 2.3 shows BVK for the Transit Southwest routes, arranged in
descending order. The best patronized route is Gateway Plaza at 1.13 BVK. This is very
similar to the average BVK for all Melbourne route bus services (1.16), as identified in
Melbourne Bus Plan (Booz Allen Hamilton 2002). Both the North West and East
21services also exceed 1.0 BVK. The Other and West services are again ranked lowest in
patronage terms, as they were in the aggregate patronage analysis. South and Merrivale
is also on the low side. All other services equal or exceed 0.66 BVK, which is reasonable
for a centre of the size of Warrnambool. These data suggest the ‘Other” services need to
be closely examined for justification and ways of increasing patronage should be pursued
on the West and South and Merrivale services.
Fig. 2.2: Transit Southwest
Route Service Boardings: 2003
30000
25000
Boardings
20000
15000
10000
5000
0 e
n
st
rly
t
t
a
er
es
es
al
ki
az
Ea
th
ri e
riv
ea
W
W
Pl
O
er
B
D
th
ay
M
d
or
an
ew
d
N
an
th
at
or
G
h
ut
N
So
Fig. 2.3: Transit Southwest Route Bus
Service Boardings/Vehicle Km: 2003
Boardings/Km
1.20
1.00
0.80
0.60
0.40
0.20
0.00
e
in
er
rly
a
st
t
t
es
es
al
az
ak
Ea
th
ie
r iv
W
W
Pl
O
De
Br
er
rth
ay
M
&
ew
No
rth
&
at
h
No
ut
G
So
22Figure 2.4 shows Warrnambool lagging behind a range of cities shown in terms of BVK1.
However, except for Burnie, those cities are all considerably larger than Warrnambool
and there is no doubt that a scale effect exists in public transport patronage: small urban
areas find it hard to achieve the critical mass in service provision to attract high loadings.
Equally, service levels in Warrnambool have been shown to lag those in Melbourne, for
example, which itself has a relatively low level of bus service provision.
Fig. 2.4: Boardings per Vehicle Km
for a Range of Cities
Warrnambool
Canberra
Burnie
Hobart
Christ church
Pert h
City Bus Service
Darwin
Wodonga
Launcest on
Geelong
Adelaide
Brisbane
M elbourne
Newcast le
Bendigo
Ballarat
Vancouver (bus)
Ot t awa
0 0.5 1 1.5 2
Boardings per Vehicle Km
The Transit Southwest urban route services in Warrnambool are primarily used by
pensioners and students. Ticket sales data2 show pensioners accounted for 57.3% of
tickets sold in 2003 and students a further 23.4%, these two categories representing over
four out of every five tickets sold. This is higher than in Melbourne, primarily because
the Warrnambool route services do not commence until after the student peak. This
means that many workers simply cannot catch a bus to work, whether they would like to
or not.
1
The data in this figure was kindly supplied by Professor Graham Currie of Monash University Institute of
Transport Studies.
2
Excluding transfers (where customer type is not recorded).
232.2.2 School Bus Services
There are two major types of school bus service provided in Warrnambool area. The first
is the free country school bus service provided for students living more than 4.8
kilometres from their school. There are 29 services to the Warrnambool Service Centre,
with load capacity of 1,525 students a day and total eligible numbers of 1,471 as at April
20043,4. Numbers on the service have been increasing, with an additional 195 students
this year. Based on a daily loading rate of 85% of the 1,471 eligible students (as
estimated by the School Bus Co-ordinator at Warrnambool Secondary College) and
assuming 195 student days a year, some 244,000 student return bus trips per year, or
488,000 one-way trips, are implied. Total daily distance traveled by the 29 services is
2,524 kms, or 502,256 kms per year (199 days).
Many of the students using these bus services transfer to a school shuttle service at
Brauer College or at Warrnambool Secondary College. Typical daily numbers are 1,400
or about 273,000 boardings on these shuttles per year. The shuttle service appears to
work very well and loading operations are undertaken in a carefully managed
environment, as shown in the accompanying photo.
There are also school students taking trips on City School Bus services within the
Warrnambool area. There are 19 such services, carrying an estimated 228,000 student
trips over the course of a year (based on average daily loads in March 20045). The
vehicles performing this transport task travel an estimated 106,000 vkms/year.
The well-managed load/transfer point at Brauer Secondary College.
3
This is 96.5% capacity utilization if full, which is indicative of a well-run program, a view supported by
the Warrnambool School Bus Co-ordinator, who commented on the good relationship between bus
operators providing the service and the school system.
4
The relevant contracts are held by South Western Roadways (13), Warrnambool Bus Lines (9), W.
Christian (Terang) P/L (6) and Coles Coaches P/L (1).
5
585 students/day*2 trips/day*195 student days/year.
242.2.3 Total Urban Bus Service Boardings
Using the information from sections 2.2.1 and 2.2.2, it is possible to provide an estimate
of total annual bus boardings within Warrnambool for regular urban route and school
services. This estimate includes several elements (latest year data):
urban route services = 163,000 boardings (266,000 vkms)
school bus services => country school bus trips = 488,000 boardings (502,000vkms)
=> shuttles = 273,000 (transfers of students from the 488,000;
distances are included in the school bus vehicle kilometres)
=> urban school bus services = 228,000 boardings (106,000 vkms)
Across all these services, total boardings are an estimated 1.15million a year (rounded),
with about 85% of these being for school travel. These numbers include transfers, which
account for about 47,000 urban route plus 273,000 country school service boardings, or
about 28% of total boardings. Table 2.1 summarises this data in terms of public transport
trips per capita. Total trips thus number about 830,000 from the 1,150,000 boardings.
Table 2.1: Public Transport Trips Per Capita in Warrnambool
Service Type Trips per capita
Urban route 3.8-5.4*
Country school 13.9**
Country school shuttles 7.8**
Urban school 7.5
Total of the above 11.3 (urban only and excluding
shuttles/transfers) to
34.6 (total boardings and all trips)
Note: * The lower figure is based on trips, which excludes transfers, and the higher on boardings,
including transfers.
** The numbers for the school services assume 35,000 population, which makes an allowance for
surrounding areas in the school bus catchment.
The far outer suburbs of Melbourne typically show about 36 public transport trips per
capita (based on Victorian Activity and Travel Survey data) and the outer suburbs about
54 trips per capita, half of which are rail and half bus. The comparable numbers from
Table 2.1 would be about 11.3 (urban route 3.8 + urban school 7.5
If the country school bus services are added (but not those transferring to shuttles),
Warrnambool would still fall about 10 trips per capita below the numbers recorded in the
far outer suburbs of Melbourne and about 30 below the number for Melbourne’s outer
suburbs. This reflects a high level of attachment to the private car in Warrnambool,
where car access is easy, the lack of a peak hour journey to work bus service within the
25You can also read