The true value of rail - The Australasian Railway Association 3 June 2011 - Deloitte
←
→
Page content transcription
If your browser does not render page correctly, please read the page content below
The true value of rail

The Australasian Railway
Association

3 June 2011
Deloitte Access Economics Pty Ltd
                                                                                                                          ACN: 149 633 116

Bryan Nye                                                                                                                 Level 1, 9 Sydney Ave
Chief Executive Officer                                                                                                   Barton ACT 2600
                                                                                                                          PO Box 6334
Australasian Railway Association                                                                                          Kingston ACT 2604

                                                                                                                          Tel: +61 2 6175 2000
Suite 4, Level 4                                                                                                          Fax: +61 2 6175 2001
Plaza Offices (East)                                                                                                      www.deloitte.com.au

Canberra Airport Terminal Complex
ACT 2609

3 June 2011

Dear Bryan

The true value of rail

I am pleased to attach our report examining the true value of rail in Australia. The analysis
identifies and quantifies, where possible, the benefits from rail transport that are not captured
in prices and which accrue to the community at large. The level and type of investments
needed to help rail achieve its potential are also considered and compared to the benefits that
could flow from increased rail use.

We hope this report will add to the policy debate around where and how to invest in
Australia’s transport infrastructure.

Yours sincerely,

Ric Simes
Partner
Deloitte Access Economics

General use restriction

This advice is prepared for the use of the Australasian Railway Association. The advice is not intended to and should
not be used or relied upon by anyone else and we accept no duty of care to any other person or entity. The advice
has been prepared for the purpose of estimating the externalities associated with rail travel. You should not refer
to or use our name or the advice for any other purpose.

Liability limited by a scheme approved under Professional Standards Legislation.

Deloitte refers to one or more of Deloitte Touche Tohmatsu Limited, a UK private company limited by guarantee, and its network of member firms,
each of which is a legally separate and independent entity.
Please see www.deloitte.com/au/about for a detailed description of the legal structure of Deloitte Touche Tohmatsu Limited an d its member firms.

© 2011 Deloitte Access Economics Pty Ltd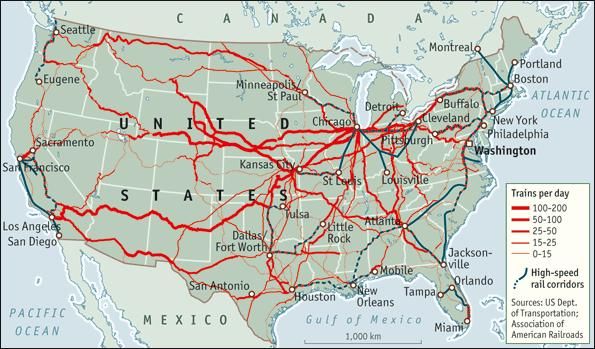
The true value of rail

Contents
Glossary ..................................................................................................................................... i
Executive Summary.................................................................................................................... i
1        The policy setting ............................................................................................................ 6
2        Transport background ..................................................................................................... 9
3        The state of transport in Australia ................................................................................. 14
         3.1       Road in Australia ............................................................................................................. 14
         3.2       Rail in Australia ............................................................................................................... 19
         3.3       Economic characteristics of road and rail transport and infrastructure............................. 23
4        Transport costs to society ............................................................................................. 27
         4.1       Passenger ....................................................................................................................... 28
         4.2       Freight ............................................................................................................................ 40
5        Impact of modal shift and investment in rail ................................................................. 46
         5.1       The north-south corridor................................................................................................. 46
         5.2       Sydney’s passenger network ........................................................................................... 51
         5.3       Elsewhere in Australia ..................................................................................................... 56
6        Other considerations..................................................................................................... 57
         6.1       Fuel security ................................................................................................................... 57
         6.2       Broader economic benefits ............................................................................................. 60
7        Implications for public policy ......................................................................................... 63
References .............................................................................................................................. 68
Appendix A : Overview of TRESIS ............................................................................................. 75
Appendix B : Approach to identifying congestion externalities ................................................ 79
         Limitation of our work ............................................................................................................... 81

Charts
Chart 1.1 : Value of major transport infrastructure engineering construction, $ million ............. 6
Chart 3.1 : Total domestic freight task by transport mode, billion tonne-kms .......................... 15
Chart 3.2 : Total passenger travel by transport mode, billion passenger-kms........................... 15
Chart 3.3 : Road-related expenditure by jurisdiction, $billion (2006-07 prices) ........................ 17
Chart 3.4 : Estimated rail freight task ...................................................................................... 21
Chart 4.1 : Modelled relationship between rail journeys and total travel time in Sydney 2011 33
Chart 6.1 : Total road transport energy consumption by fuel type, energy units ...................... 58
Liability limited by a scheme approved under Professional Standards Legislation.

Deloitte refers to one or more of Deloitte Touche Tohmatsu Limited, a UK private company limited by guarantee, and its network of member firms,
each of which is a legally separate and independent entity.
Please see www.deloitte.com/au/about for a detailed description of the legal structure of Deloitte Touche Tohmatsu Limited an d its member firms.

© 2011 Deloitte Access Economics Pty Ltd
The true value of rail

Chart 6.2 : Total rail transport energy consumption by fuel type, energy units ........................ 59
Chart 7.1 : Relationship of congestion costs ($) to city population ........................................... 64

Tables
Table 4.1 : Carbon emissions from passenger transport, 2006 ................................................ 28
Table 4.2 : Carbon pollution costs per commuter trip .............................................................. 29
Table 4.3 : Carbon emissions costs at different carbon prices .................................................. 30
Table 4.4 : Congestion costs, travel time ................................................................................. 34
Table 4.5 : Congestion costs, carbon emissions ....................................................................... 34
Table 4.6 : Ranges for value of travel time as percent of wage ................................................ 35
Table 4.7 : Average weekly earnings around Australia, August 2010 ........................................ 35
Table 4.8 : Congestion costs per journey, dollars (2010) .......................................................... 35
Table 4.9 : Congestion cost sensitivity analysis, dollars (2010) ................................................. 36
Table 4.10 : Number of accidents by severity for road and rail ................................................ 37
Table 4.11 : Accident costs from passenger travel ................................................................... 37
Table 4.12 : Accident costs per trip ......................................................................................... 38
Table 4.13 : Total costs per average commuter trip (2010$) .................................................... 40
Table 4.14 : Carbon emissions from freight, 2010 ................................................................... 41
Table 4.15 : Example carbon costs for intercity freight ($) ....................................................... 42
Table 4.16 : Carbon emissions costs at different carbon prices ................................................ 42
Table 4.17 : Accident costs from freight transport ................................................................... 43
Table 4.18 : Example accident costs for intercity freight ($) ..................................................... 43
Table 4.19 : Total freight costs ................................................................................................ 44
Table 4.20 : Example total costs for intercity freight ($) ........................................................... 45
Table 5.1 : Potential yearly rail benefits on the north-south corridor ($m) ............................... 50
Table 5.2 : Change in key transport indicators in Sydney from 2010 to 2025 ........................... 53
Table 5.3 : Cost savings from increased rail usage in Sydney in 2025 ($2010 million) ............... 53
Table B.1 : Congestion externality modelling results................................................................ 80

Figures
Figure 2.1 : Freight Rail Movements in the United States of America ....................................... 13
Figure 3.1 : Auslink national road network .............................................................................. 16

Deloitte Access Economics
The true value of rail

Figure 3.2 : Major rail links in Australia.................................................................................... 20
Figure 4.1 : TRESIS regions in Sydney ....................................................................................... 32
Figure 5.1 : The north-south corridor ...................................................................................... 47
Figure A.1 : TRESIS' component systems ................................................................................. 76

Deloitte Access Economics
The true value of rail

Glossary
ABARE                                        Australian Bureau of Agricultural and Resource Economics
ABS                                          Australian Bureau of Statistics
ACF                                          Australian Conservation Foundation
ACG                                          Applebaum Consulting Group
ARA                                          Australasian Railway Association
ARTC                                         Australian Rail Track Corporation
ATC                                          Australian Transport Council
ATSB                                         Australian Transport Safety Bureau
BITRE                                        Bureau of Infrastructure, Transport and Regional Economics
BTE                                          Bureau of Transport Economics
BTRE                                         Bureau of Transport and Regional Economics
CNG                                          Compressed natural gas
COAG                                         Council of Australian Governments
CPI                                          Consumer price index
CPRS                                         Carbon pollution reduction scheme
CRAI                                         Charles River Associates International
CRC                                          Cooperative Research Centre
CRRP                                         COAG Road Reform Plan
DFAT                                         Department of Foreign Affairs and Trade
DRET                                         Department of Resources, Energy and Tourism
FIRS                                         Federal Interstate Registration Scheme
IPART                                        Independent Pricing and Regulatory Tribunal
ITLS                                         Institute of Transport and Logistics Studies
NSW                                          New South Wales
NTC                                          National Transport Commission
OECD                                         Organisation for Economic Cooperation and Development
PWC                                          PricewaterhouseCoopers
QR                                           Queensland Rail
RIS                                          Regulatory Impact Statement
RTA                                          Roads and Traffic Authority
Liability limited by a scheme approved under Professional Standards Legislation.

Deloitte refers to one or more of Deloitte Touche Tohmatsu Limited, a UK private company limited by guarantee, and its network of member
firms, each of which is a legally separate and independent entity.
Please see www.deloitte.com/au/about for a detailed description of the legal structure of Deloitte Touche Tohmatsu Limited an d its member
firms.

© 2011 Deloitte Access Economics Pty Ltd
The true value of rail

SPC                         Sydney Ports Corporation
TRESIS                      Transport and Environmental Strategy Impact Simulator
USA                         United States of America
VFT                         Very fast train
VSL                         Value of statistical life

Deloitte Access Economics
The true value of rail

Executive Summary
          Understanding the true value of rail in Australia requires that the benefits from
          rail transport which are not captured in prices and which accrue to the
          community at large are identified and quantified. In this report some of these
          social, environment and economic impacts of rail transport are identified and
          quantified.

          The analysis indicates that, for passenger journeys, every trip made on rail
          rather than road can reduce costs to society by between $3 and $8.50,
          depending on the city. For freight the savings are estimated to be around 95
          cents for every tonne kilometre (this translates to around $150 for a normal
          container transported between Melbourne and Brisbane).

          These estimates are based on congestion, accident and carbon emission costs
          and so benefits from social inclusion, reduced infrastructure maintenance
          costs and fuel security could also be added.

The situation today
Australia’s approach to the planning of cities, land use and transport has changed
dramatically over the last half century as a result of population growth. Our major cities
have expanded and their centres have grown denser. Demand for passenger and freight
transport services have steadily grown, both within and between urban centres. The
pressure on transport infrastructure is set to progressively intensify over the coming years
as Australia’s population increases to a forecast 30.5 million by 2030 (ABS 2008). In this
environment, decisions must be made about how much and where to invest in transport
infrastructure. These decisions must be informed by the true value of rail or the wrong
investments will be made.

Historically, much of the increased demand for transport services has been met by road.
For example, the share of interstate, non-bulk freight met by road transport has risen from
around 22% in 1970 to around 70% today, while that met by rail has fallen from around
45% to under 30% over the same period (BTE 1999 and Port Jackson Partners 2005).
Similar trends can be observed in passenger services within cities.

Indeed, Australia is now the most intensive user of road freight in the world 1 and has the
least energy efficient road passenger transport among members of the International Energy
Association (DFAT 2008 and Prime Minister’s task group on energy efficiency 2010).

These trends cannot continue if our freight systems are to be managed efficiently and our
passenger networks are to not be overburdened by congestion as populations grow.

In order to meet the land transport challenges confronting the nation, a suite of
complementary measures will be needed; involving:

1
    When measured on a tonne-kilometre per person basis.

    Deloitte Access Economics                                                                    i
The true value of rail
effectively integrating investment in transport infrastructure in all metropolitan
strategies;
reforming pricing to encourage efficient choices between different transport modes;
and
taking a long-term view of the benefits that accrue from investment in core transport
infrastructure.
Policy-makers have been engaged in developing elements in each of these three areas for
action but progress has been slow. Congestion, carbon emissions and inefficiencies in
supply chains have continued to worsen. A greater sense of urgency is required.
As is evident from international experience, an increased use of rail will be vital to meeting
these challenges as the population, and population densities, increase. Rail provides many
benefits over road transport which are not incorporated into costs and prices. These
benefits include:
improved land use and urban densification;
lower carbon emissions;
reduced congestion;
fewer accidents;
removing barriers to social inclusion;
improving land values; and
enhanced energy security.
Rail is already price competitive with road in some areas of the transport network,
particularly freight, and would become more competitive with improved infrastructure
and/or suitable pricing signals. These benefits should grow as the population increases and
rail infrastructure can be more fully utilised allowing the infrastructure costs to be spread
between more users.
Benefits of rail
A key part of ensuring correct investment decisions are made is to recognise the true value
of rail. This report provides evidence on the level of the benefits not captured in prices or
costs that arise from shifting passengers or freight from road to rail. The benefits identified
are:
Passenger transport:
• Road travel produces more than 40% more carbon pollution than rail travel per
passenger kilometre.
• Road transport generates almost eight times the amount of accident costs as
rail transport does.
• In the longer term, high speed rail provides the potential to alleviate pressures
that will emerge to move people between major cities and along east coast
corridors as Australia’s population grows.
Urban passenger transport:
• An additional commuter journey by rail reduces congestion costs alone by
between around $2 and $7.
Deloitte Access Economics iiThe true value of rail
• For every passenger journey made on rail rather than road in Australia’s four
largest cities, between $3 and $8.50 can be saved in congestion, safety and
carbon emission costs.
• In Sydney, for example, if rail absorbed 30% of the forecast increase in urban
travel then congestion, safety and carbon emission costs could be reduced by
around $1 billion a year by 2025.
Interstate freight transport:
• Heavy vehicle road freight users do not face the full maintenance costs that
they cause. Under-recovery of these costs has been estimated at between
$7,000 and $10,500 per truck each year (Productivity Commission 2006 and
NTC 2006). The National Transport Commission (NTC) has recommended
changes which seek to address this issue.
• Freight moved between Melbourne and Brisbane by rail instead of road
reduces carbon costs by around $56 per container and reduces accident costs
by around $92 per container.
• Along the North-South freight corridor, for example, if rail was to achieve a
40% share of the market then savings, in terms of carbon pollution and
accidents, would currently be around $300m a year or $630m a year by 2030.
Freight transport within urban centres:
• Along with the use of the mass transit of people, a greater use of rail for freight
within, especially, Sydney and Melbourne will be needed to alleviate the
increasing congestion on road networks. Environmental and safety benefits
would also accrue.
• The NSW and Victorian Governments have recognised the need to develop
more effective rail freight services within their cities and have set targets
accordingly. These goals aim to ease congestion on arterial roads and improve
use of existing rail infrastructure and port land.
These costs have tangible effects on the lives of all Australian’s and the economy.
Congestion eats away at leisure time and reduces economic productivity as workers and
goods take longer to reach their destination and cost more to transport. Carbon pollution
creates social costs to be borne by future generations who will face the duel costs of a
changed climate and the need to reduce emissions. In addition to deaths caused by vehicle
accidents, injuries create ongoing effects in terms of pain, reduced ability to work and the
need for care.
Investing in infrastructure
The costs in terms of congestion, carbon emissions and safety that have been outlined
above will increase in coming years. Increases in congestion costs are set to outpace the
increase in either the size of the economy, the size of our cities or the size of our
population. Policy makers are, therefore, faced with difficult decisions. Investment which
recognises the value of rail could lead to significant benefits for Australia but these
investments are large and can be administratively difficult.
For example, to meet the needs of this growing population, there is a choice between
investing in mass transit now or building road or rail networks through already developed
urban areas in the future. The high cost of retro-fitting road networks is already reflected
Deloitte Access Economics iiiThe true value of rail in Sydney’s M4 East expansion, which is expected to amount to more than $500 million per km (NRMA 2011). In contrast, Brisbane is looking to invest in Cross River Rail to prepare for a denser population. There are currently some key bottlenecks holding back the efficient use of rail in Australia. Freight movements between Melbourne and Brisbane are constrained by congestion in northern Sydney. The North Sydney Freight Corridor would go a long way to addressing this issue. Fixing this key point of infrastructure is estimated to cost around $4.4 billion today. A number of other projects on this route such as modern intermodal facilities in Sydney and Melbourne and many minor adjustments to the track might also be needed. These investments are costly but will help drive a modal shift towards rail freight which creates benefits from reduced carbon pollution and accidents. If rail was to achieve a 40% market share then by 2030 the savings from accidents and carbon pollution could be worth well over $600 million a year. The key choke point for freight is intimately linked with Sydney's metropolitan network. The metropolitan network is currently constrained by capacity through the city. Expanding capacity in the city, through the Western Express project, would currently cost around $4.5 billion. Again, there are large savings in carbon pollution, accident and congestion costs which work to offset the initial infrastructure investment. If a congestion charge and carbon tax were introduced, this could result in around 150 million extra rail journeys a year. All these extra passengers would reduce carbon pollution, congestion and accident costs on the roads by around $1.2 billion a year. Projects to relieve current bottlenecks should be put through a rigorous cost benefit analysis before being committed to and the full benefits of rail should be included in this analysis. The policy challenge Rail has a central role to play in meeting this transport challenge; it can provide mass transport and links across cities, reducing congestion, accidents and pollution. It can also play a key role in transporting freight efficiently between and through population centres. Rail, therefore, should be a focus of policymakers when considering how best to support and accommodate future transport and economic growth. Investment in rail should be made through a mix of public, private and public-private partnership (PPP) funding. No matter which method of funding is used investment should be made in a coordinated manner with reference to longer term transportation goals and incorporating the full costs of different modes of transport. The most prominent involvement of State governments has been in metropolitan rail. State governments, through their metropolitan plans, therefore have an essential role to play in ensuring investments in rail infrastructure are made which keep pace with their growing cities and capture the full range of benefits that rail offers (including social inclusion, reduced congestion, reduced road accidents and reduced pollution). Rail will play a key role under any reasonable transport plan. Deloitte Access Economics iv
The true value of rail

In addition to making investments in rail, state governments can also focus on addressing
existing inefficiencies in the pricing of road transport. First through ensuring that heavy
freight vehicles cover the costs they impose and then by moving towards mass-distance
pricing.

The Australian Government, by being less focused on the operation and maintenance of rail
networks themselves, can take on a coordination and leadership role as well as their central
funding role. Leadership can be made through continued investigation of new rail
developments and planning strategies which place an emphasis on rail.

In terms of funding, ideally, the benefits of rail (such as reducing congestion, carbon
emissions and accidents) would be directly internalised using policy options such as carbon
pricing, congestion charges and accurate vehicle registration fees. This is a long term goal,
however, and, in the shorter term, a second best approach is for the Australian
Government to take into account the full benefits of rail when considering which
investments to support.

Funding from the Australian Government is also important in overcoming myopic
investments. Given the past pattern of transport investment in Australia it is often the case
that an incremental investment in road seems more appealing than an investment in rail.
Following along this path will only lock Australia in more closely with road transport and will
miss the opportunities presented by making use rail transport.

A series of bold and innovative policy options should be considered. Over the very short
term, the CRRP process should be strongly pursued and supported with a goal of more
closely tying truck operating costs to the actual costs they create.

In the medium term, allocating some of the funds from a carbon tax to the development of
public transport networks could present a particularly appealing policy.

In the longer term, introducing congestion charging in Australia’s capital cities and levying a
per tonne charge on road freight transport within cities should be seen as overall policy
goals.

Effective action along these lines would result in very large gains to the national economy.
Indeed, the potential gains would result in improvements in national productivity of a scale
that would compare favourably with some of the major microeconomic reforms delivered
over the past few decades.

Deloitte Access Economics

Deloitte Access Economics                                                                     v
The true value of rail

1 The policy setting
         The increasing demand for transport associated with the expansion of our
         major cities has been predominantly met by building roads. Governments
         have played a key role in guiding these investment choices. With a movement
         towards integrated planning of transport investments across modes and
         jurisdictions supported by a number of key policy documents, there is an
         opportunity for a fresh approach to investment planning.

         To make appropriate policy decisions, decision makers must take into account
         all the costs for each different transport mode.

  Australia’s approach to the planning of cities, land use and transport has changed
  dramatically over the last half century as a result of population growth. Our major cities
  have expanded, leading to greater demand for the transport of both passengers and
  freight, within and between cities. The expansion of our cities reflects a change in land use,
  from a relatively dense hub-and-spoke configuration, to a low density suburban sprawl,
  supported by an expanding road network (BTRE 2007). Over the last few decades, this
  increasing transport need has typically been met by investment in roads, with little relative
  investment in rail (see Chart 1.1 below).

     Chart 1.1: Value of major transport infrastructure engineering construction, $ million

      14 000.0

      12 000.0

      10 000.0

       8 000.0

       6 000.0

       4 000.0

       2 000.0

           0.0

                              Roads and Bridges   Railways   Ports and Harbours

  Source: BTRE (2009c)

  Deloitte Access Economics                                                                      6
The true value of rail
Government policy plays a significant role in guiding investment choices in Australia’s
transport infrastructure. Looking ahead, it will continue to play a coordinating role for
infrastructure development because, while many transport operators are private entities or
government corporations, the planning of cities and major infrastructure investments
remain, largely, the purview of government, as does control of transport’s regulatory
environment.
A program of microeconomic reform in the 1990s, as part of the National Competition
Policy Review, led to changes in the operating environment of the transport industry. For
example, restructuring occurred in the rail industry, where below and above rail
infrastructure was vertically separated and a number of rail access regimes were created
(Everett 2006). It is arguable that in the decades since, however, reform and investment in
infrastructure have stagnated. That attention is now shifting back, with freight and
transport policy both firmly in the spotlight (BCA 2009).
In the freight sector, government policy towards freight transport has recently shifted
towards an integrated planning model, in contrast to the previous parallel planning model
where transport modes were planned separately and state and territory regulations did not
align. The Australian Government and the Council of Australian Governments (COAG)’s
reform agenda has been a driving force behind this shift. Several steps have already been
taken towards an approach to transport policy that is integrated across jurisdictions and
across modes, some recent highlights include:
The release of a draft National Land Freight Strategy (Infrastructure Australia 2011)
The National Ports Strategy (Infrastructure Australia 2010a)
The Road Reform Plan (ATC 2009)
A report commissioned by the National Transport Commission (NTC) looking at the
development of an inter-modal supply chain (Booz & Company 2009)
A Regulatory Impact Statement (RIS) recommending the implementation of a
national framework for the regulation, registration and licensing of heavy vehicles
(Department of Infrastructure, Transport, Regional Development and Local
Government 2009)
A RIS recommending the creation of a national safety investigator across all transport
modes (NTC 2009)
Dedicated transport infrastructure spending, with the creation of Building Australian
Fund and the Nation Building Program, both under the jurisdiction of Infrastructure
Australia
The role of rail freight within Australia’s cities has also been recognised with, for example,
renewed efforts for the integration of rail into the Port of Melbourne and Port Botany and
planning for investments into intermodal terminals.
Similarly, there has been increased attention on urban transport planning at both a Federal
and State level. Recent examples include:
Initial Federal movement into urban infrastructure planning, with the development
of a Major Cities Unit within Infrastructure Australia.
A Discussion Paper looking at Sydney’s Metropolitan Strategy for 2036 (NSW
Planning 2009)
Deloitte Access Economics 7The true value of rail
A call for submissions regarding Sydney’s proposed M5 corridor expansion (RTA
2009a)
The Victorian Transport Plan (Department of Transport 2008)
A draft Integrated Transport Plan for South East Queensland (Department of
Transport and Main Roads 2010)
An Infrastructure Plan and Program for South East Queensland (Department of
Infrastructure and Planning 2010)
A research report into ‘Population growth, jobs growth and commuting flows in
Perth’ (BITRE 2010b).
Australia’s population is forecast to increase to 30.5 million by 2030 (ABS 2008). As such,
both the population and freight task are likewise forecast to continue growing in the
decades to come. The policy shift towards an integrated planning model bodes well for the
task ahead, as it has been found that multiple regulatory systems are inherently unstable
(BTRE 2006). A more populous Australia will inevitably further change the landscape of our
cities and infrastructure requirements. This will require significant investment in transport
infrastructure for the efficient movement of more people and more goods. A focus on
improving Australia’s transport infrastructure is integral to continuing to build on the
productivity gains that began with economic reform and competition policy in earlier
decades (BCA 2009). Efficient transport is a key input to the production of goods and
services in Australia and, as such, designing the right transport policy for both freight and
passengers is integral to achieving future productivity growth. Without addressing
efficiency and capacity constraints, there will be significant negative implications for the
national economy (IPA and PWC 2009).
This begs the question; how best to grow as a nation? To sufficiently answer this question,
it is important to understand the full implications of different investment choices. The
question then becomes what is the best approach to the provision of funding of
infrastructure, services and pricing to ensure that the most efficient modal mix is achieved.
Policy architecture that lends itself to the efficient development of the transport sector
must ensure that stakeholders take into account all the costs for each different transport
mode. Hence, one important consideration for transport planning decisions is an
appreciation of the externalities associated with each mode. It is not the only
consideration, but a failure to include it in the decision making process will likely lead to an
outcome with a distortionary effect.
This report seeks to outline the potential advantages of investment in rail and its potential
to best meet the challenges of a growing population and freight task. Issues affecting the
policy decision making process are discussed further in this report. Background is given in
Section 2, the current state of road and rail in Australia, including their economic
characteristics, is discussed in Section 3, transportation costs are addressed in Section 4 and
other considerations are discussed in Section 6. Finally, implications for public policy are
addressed in Section 7.
Deloitte Access Economics 8The true value of rail
2 Transport background
Rail is well suited to meeting the needs of Australia's future population growth
whether this be as mass transit in Australia's increasingly large and dense
cities, interstate passenger transport or freight transport (both within and
between cities).
Rail presents benefits of enabling increased density, reducing congestion and
accidents, being less fossil fuel dependent and negating the need for
investment in airport and road expansions.
Rail has been held back by historical underinvestment, especially when
compared to other modes of transport, which has led to an unnecessary
reputation of poor performance. With sufficient infrastructure rail could
significantly increase its share of the transport task.
As Australia’s population grows over the coming decades, the potential value of rail will
likewise grow. A more populous country is better able to tap into the efficiencies and
benefits of rail, as its advantages lie in mass transportation, whether that be of people or of
goods.
For the transport of passengers, rail has particular advantages at an intra-city, or metro,
level. Australia has, for a long time, had a highly urbanised population and a growing
population is likely to result in larger, denser cities. Investment in passenger rail networks
offers one way of addressing how Australia’s cities will be organised.
The ability of our major cities’ footprints to expand is limited by geographic barriers to what
are already sprawling suburbs. As a result, cities accommodating larger populations will
inevitably become denser. This increased density and increased numbers of people make
investment in rail an attractive option. Rail is able to move people in mass, resulting in a
more efficient use of capital and transport corridors, and a reduction in congestion. Other
notable benefits accrue from increased safety, partly as a result of reduced congestion.
Environmental benefits are also derived from the economies of scale achieved through the
mass transit of people and because rail is a less fossil fuel-dependent mode of transport
than road.
Rail also potentially offers advantages for the transport of passengers at an inter-city level.
In addition to the population growth of major cities, regional centres are also growing and
sizeable population corridors are beginning to take shape. This trend is particularly strong
along the East coast of Australia between Sydney and Brisbane, but is also becoming
apparent to the South of Perth and around Melbourne.
With sufficient population density and with more nodes along potential routes in the
future, the option of a very fast train (VFT) for passenger transport along the east coast of
Australia may be increasingly attractive. The BITRE reports that, as a general rule, a viable
high speed train line should connect cities with over one million residents that are at
around three hours apart, and requires 6 to 12 million passengers a year (BITRE 2010c). In
Deloitte Access Economics 9The true value of rail a similar manner to intra-city metro services, inter-city rail has potential advantages for addressing congestion and environmental issues. The most important transport mode in this space is currently air. However, in the future, a reliance on air transport among a larger population may lead to congestion problems at airports. Air travel also has higher negative environmental costs than both rail and road (BITRE 2010), as well as fuel security concerns, both of which may reduce its relative appeal over time. Research in this area asserts that an east coast high speed rail corridor achieving speeds of 350km/h could compete with air travel (IPA and AECOM 2010). Deloitte Access Economics 10
The true value of rail

      Case study: Rail passenger transport in America

      Those American cities with ‘large rail’ systems are found to receive economic,
      social and environmental benefits from their public transport system relative
      to cities with ‘small rail’ or a ‘bus only’ public transport system.

      A large, well-established rail public transport system is found to significantly
      increase per capita public transport use through two mechanisms. First, with
      access to rail transportation, more people choose to commute by public
      transport rather than by car (also called ‘discretionary riders’), reducing total
      vehicle mileage. Secondly, people change their car ownership patterns,
      thereby reducing levels of car ownership.

      Through a higher per capita use of public transport, these large rail systems are
      found to achieve expected benefits, relative to comparably sized ‘small rail’
      and ‘bus only’ cities. These include less traffic congestion and lower traffic
      death rates, as well as lower consumer expenditure on transport and higher
      public transport service cost recovery. Chart Box.1 below shows that American
      cities with large rail transport systems have far lower congestion costs than
      cities of comparable size with a small rail or bus only transport system.

                  Chart Box.1: Estimated congestion cost in American cities

             Source: Litman (201)

      New York, Boston, San Francisco and Chicago are examples of American cities
      with successful established rail transport systems. However, Portland has a
      relatively new rail system and has achieved similar outcomes in
      neighbourhoods with access to rail transport, such as increasing public
      transport patronage and a reduction of private car use. This suggests that new
      rail systems can affect transport and land use patterns at a fast enough rate to
      be considered worthwhile investments.

      Source: Litman (2010)

Deloitte Access Economics                                                                  11
The true value of rail By 2020, Australia’s freight task is forecast to double in size (PWC and IPA 2009). Like for the movement of passengers, rail has advantages for the movement of large quantities of goods. Rail has a particular advantage over very long distances moving from point to point where economies of scale can be achieved (BITRE 2009d) but can also play a key role over shorter distances, particularly within cities where rail offers ways to manage congestion and staffing concerns. For example, rail already performs very well in the movement of freight between the West and East coasts of Australia. As Australia’s population grows and the freight task between major population centres also grows, rail may be the most efficient transport mode for the movement of goods between cities. Like in the case of metro passenger transport, it offers benefits in terms of congestion, safety, health and environmental costs. It is arguable that historical under-investment in capital along rail corridors in east coast hubs and along the North-South corridor between Melbourne and Brisbane has affected line haul performance and limited the demand for rail services along these tracks. With increased capital investment, it is estimated that rail could increase its modal share. Some estimates place the potential for rail share to be between 30 and 40% for freight movements between Melbourne and Sydney, and up to 80% for freight movements between Melbourne and Brisbane (Booz & Co 2009). The US, particularly along the West coast with the Alameda Corridor and in the mid-West, provides a best practice example for the use of rail for the movement of freight. Figure 2.1 shows the main rail corridors in the US and the average daily patronage of each route. Long-distance routes along East-West corridors receive the highest number of trains per day, while the populous West coast supports high-speed rail corridors. An OECD (2006) study finds that the US has a fairly balanced modal share for freight, with rail taking on the highest share at 39%, followed by road at 31% and pipelines/inland navigation/short-sea shipping at between 7 and 8%. This is relative to both Europe and Japan, where rail does not hold a significant modal share and road and short-sea shipping dominate. In Japan 41% of the freight task is undertaken by short-sea shipping and 55% by road. In the EU-15 countries 44% is done by road and 39% by short-sea shipping. Given its geographic similarities and similar requirement to navigate a federal system, this bodes well for the potential of rail to take on a similar role for the movement of freight in Australia. Deloitte Access Economics 12
The true value of rail

             Figure 2.1: Freight Rail Movements in the United States of America

Source: The Economist (2010)

Moving forward, rail may also play a greater role in connecting regional and metro areas to
Australia’s major ports. Rail already facilitates the transport of many bulk commodities to
Australia’s ports for export. Furthermore, several significant Australian ports have flagged a
goal to improve rail’s modal share of their respective port trades, particularly in
containerised exports (Sydney Ports Corporation 2008; Port of Melbourne Corporation
2009a; Port of Hastings Corporation 2009). An increase in rail’s modal share of this task
would aim to relieve road congestion, improve port land use and improve linkages with the
interstate rail freight network (BITRE 2009d). Booz & Co (2009) predict that in the absence
of landside logistics reform to better favour rail, an additional 1.3 million truck trips will
occur each year adding to the congestion problems for ports.

A better understanding of the potential benefits of rail is important when considering
Australia’s future transport infrastructure planning. The development of rail infrastructure
in the certain areas of the transport network where its benefits are clearest has the
potential to efficiently and productively meet Australia’s growing passenger and freight
transport tasks.

Deloitte Access Economics                                                                  13
The true value of rail
3 The state of transport in
Australia
The potential role for rail in Australia should be compared to its current state.
There are extensive road and rail networks both within and between
Australia’s major cities. There is, however, a clear difference in outcomes. The
share of interstate non-bulk freight met by road transportation has risen from
around 22% in 1970 to around 70% today, while the share met by rail has
fallen from around 45% to under 30% over the same period (BTE 1999 and Port
Jackson Partners 2005). In an environment where the total transport task has
been growing, rail, although showing recent gains, has been largely confined to
areas such as the transport of bulk minerals, very long freight hauls and for
mass transit in Australia’s largest cities.
Part of the explanation for this outcome is the different infrastructure
investments made in both networks. Historical trends have shown greater
investment by government in road than rail infrastructure. Given the
economics of infrastructure networks, such as the increasing returns to scale
due to network effects and high fixed costs, these past supply decisions have
driven current demand outcomes.
3.1 Road in Australia
Transport in Australia is highly reliant on its road network, which is vast. In 2007 Australia
had a total 815,074 kms of roads (BITRE 2009c). Australia is the most intensive user of road
freight in the world on a tonne-kilometre per person basis (DFAT 2008) while a survey of
members of the international energy association has also shown that Australia has the least
energy efficient road passenger transport and one of the lowest levels of new passenger
vehicle fuel efficiency (Prime Minister’s task group on energy efficiency 2010).
Australia’s reliance on its road network has been increasing over recent decades; both for
the movement of passengers and of freight (see Chart 3.1 and Chart 3.2). In terms of the
freight task, in 1970-71 road moved 19% of goods, measured in tonne-kms and by 2006-07
this had increased to 36%. Total passenger-kms travelled by passenger cars increased by
256% over the same timeframe; however passenger cars’ share of total passenger travel
did not increase. The steady role of passenger road travel, as a proportion of total
passenger travel, is due to the rise of air passenger travel, which has increased its
passenger kms almost ten-fold over this time and is the only transport mode to have
increased its share of passenger travel from 1970-71 to 2006-07.
Deloitte Access Economics 14The true value of rail
Chart 3.1: Total domestic freight task by transport mode, billion tonne-kms
600
500
400
300
200
100
0
Road Rail Coastal shipping
Source: BITRE (2009c)
Chart 3.2: Total passenger travel by transport mode, billion passenger-kms
400.00
350.00
300.00
250.00
200.00
150.00
100.00
50.00
0.00
Passenger cars Air Buses Rail Other
Source: BITRE (2009c)
Deloitte Access Economics 15The true value of rail
Most road infrastructure in Australia is provided by government, with all three levels of
government contributing in different ways. State, territory and local governments have
ownership and control over Australia’s road networks, with the former responsible for
major roads and the latter responsible for smaller local roads. The Australian government
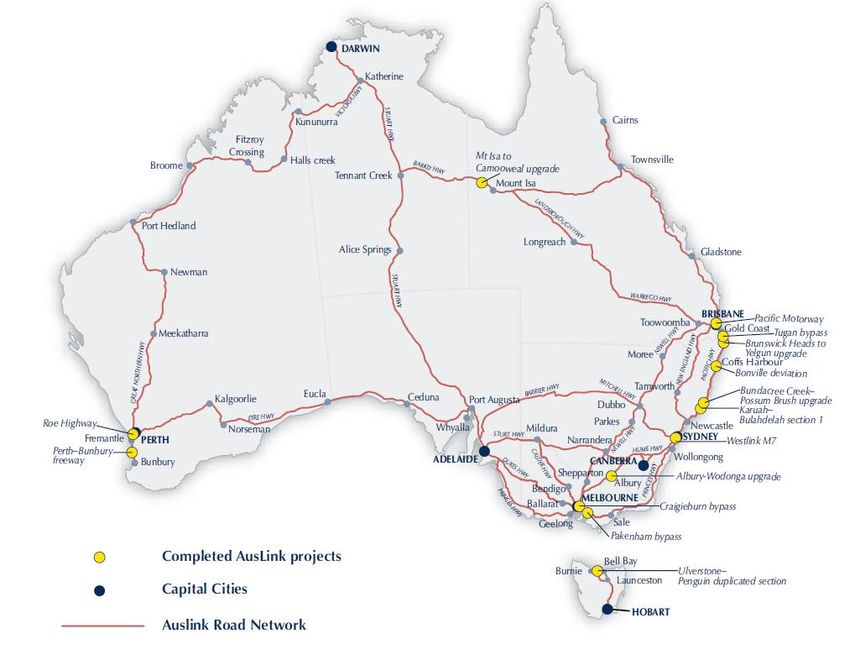
is responsible for funding of the interstate highway network (formerly known as Auslink),
shown in Figure 3.1. The Australian government also has some influence over the
governance of roads, through its distribution of funding and through its role in negotiating
COAG reforms.
At a state and territory level, each jurisdiction’s respective transport department is
responsible for distributing funding for roads, registration and licensing of vehicles,
managing road networks and for transport safety. Local councils are responsible for
managing local roads.
Figure 3.1: Auslink national road network
Source: BITRE (2009c)
Generally speaking, state and territory government make the largest funding contributions
to Australian roads, followed by local governments and the Australian government,
respectively (see Chart 3.3). A limited proportion of road infrastructure is also provided by
private sector transfers. Private sector transfers refer to roads that are constructed by the
private sector and are then transferred to local government, for example, roads in new
housing developments (BITRE 2009d). According to the BITRE’s most recent figures, road
related expenditure by all levels of Australian governments totalled $13.9 billion in 2007-
08, including transfers from the private sector.
Deloitte Access Economics 16The true value of rail
Chart 3.3: Road-related expenditure by jurisdiction, $billion (2006-07 prices)
14.0
12.0
10.0
8.0
6.0
4.0
2.0
0.0
Federal Government State and Territory Governments Local Governments
Source: BITRE (2009c)
However, since 2008 the Australian Government has taken on a greater role in the funding
of roads. Major new programs for funding road infrastructure by the Australian
government include:
The Nation Building Program, which distributes Australian Government funding for
roads. Funding under this program will average of $4.6 billion per year between
2008-09 and 2013-14. This is a significant increase in funding compared to the
previous total federal spending level of $2.7 million in 2007-08 (BITRE 2009d).
The Building Australia Fund contributes to critical infrastructure projects, including
road projects. Funding is distributed based on an Infrastructure Priority List
(Department of Infrastructure and Transport 2010a).
The Roads to Recovery program contributes federal funding to local councils and to
state and territory government for local roads in unincorporated areas. $1.75 billion
will be distributed between 2009-10 and 2013-14 (Department of Infrastructure and
Transport 2010b).
The Black Spots Program provides funding to high-risk road locations around
Australia. It will provide $59.5 million per year until 2013-14.
The pricing of road use is generally managed by state and territory governments. For
passenger road transport, the price of road use consists of a vehicle registration fee, a
license fee and toll charges for the use of privately constructed roadways. In the first two
cases, these are fixed cost compulsory fees where vehicle registration is an annual charge
and the term of vehicle licenses varies. Toll charges are marginal costs to road users, but
are discretionary to the extent that they can be avoided.
Deloitte Access Economics 17The true value of rail
For freight road transport, road use prices consist of charges to heavy vehicles, which in
turn include a diesel fuel excise and heavy vehicle registration fees. The diesel fuel excise is
a marginal cost for heavy vehicle users and varies with the amount of fuel consumed and,
therefore, with distance travelled. It is charged at 38.14 cents per litre. However, most
heavy vehicles (those over 4.5 tonnes) are eligible for a fuel tax credit if they meet a
minimum one of four environmental criteria under the Fuel Tax Act 2006. Heavy vehicles
meeting this condition receive a fuel tax credit of 18.51 cents per litre, leaving a net diesel
fuel excise of 19.63 cents per litre (Productivity Commission 2006).
The interstate registration of heavy vehicles is called the Federal Interstate Registration
Scheme (FIRS) and provides national registration for heavy vehicles over 4.5 tonnes
operating solely in interstate transport. The National Transport Commission (NTC)
recommends the level of interstate heavy vehicle registration charges. These
recommendations are then taken into account by the Australian Transport Council (ATC),
an element of COAG, when it forms its decisions. Over the past few years there has been a
tendency for the ATC to not implement recommendations from the NTC, this was noted in
a 2009 review of the NTC which found that its “impact on transport outcomes has fallen
short of what should be expected” (NTC Review Steering Committee 2009). The relevant
State and Territory transport authorities administer these charges on behalf of the
Australian government. Each jurisdiction also administers registration of heavy vehicles
that are registered to that State or Territory. Both systems, individual State and Territory,
and FIRS, have registration fees that vary by vehicle type.
There has been debate in Australia recently about whether road freight has been subsidised
relative to rail. In 2006 the Productivity Commission released a report into Road and Rail
Freight Infrastructure Pricing which found that there was no compelling case that heavy
vehicles are subsidised relative to rail, there was some indication that there may be cross-
subsidisation within vehicle classes (Productivity Commission 2006). The conclusions of this
report should be tempered by the persistent data problems identified by the Productivity
commission. At various points in the report the lack of data for both road and rail
infrastructure is highlighted as a problem which restricted the commission’s ability to fully
analyse the issues:
“A lack of reliable data in relation to some issues has affected both the emphasis and
approach [to the terms of reference+.”
“Data on the expenditure within each jurisdiction that is attributable to heavy
vehicles is needed to test this claim [of under-compensation to local government],
but these data are not available.”
“Data on State and Territory rail expenditure do not identify expenditure on capital
works or new assets, nor are they comparable across jurisdictions due to significant
differences in accounting policies.”
“there is considerable uncertainty about the accuracy of the road capital stock data”
In addition, advocates of rail have argued that because heavy vehicle road user charges
have been capped at CPI since 2002, and steep increases in road infrastructure investment
have been made over this time, that road freight operators have been subsidised (CRC for
Rail Innovation 2009). The outcome of this debate is, as yet, unclear.
Following on from the Productivity Commission report, over the past few years COAG has
been proceeding along its road reform plan. The COAG road reform plan (CRRP) has
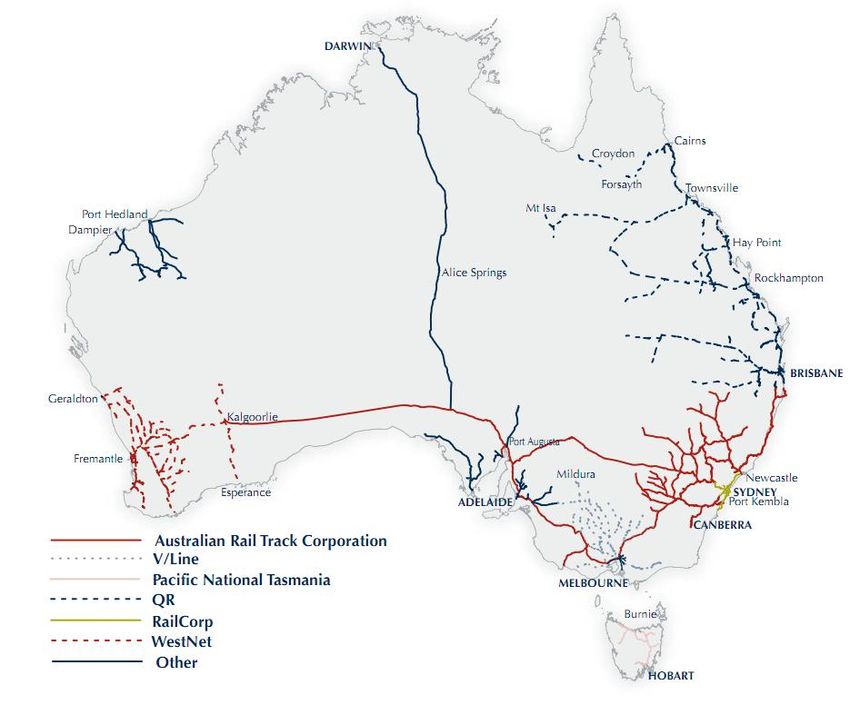
Deloitte Access Economics 18The true value of rail focussed on the finding that prices for larger road vehicles were highly averaged and did not always reflect the distance travelled, vehicle mass and the maintenance costs of different road types. This is a somewhat narrow target for reform and CRRP has explicitly stated that it does not intend to include social costs such as congestion, air pollution, greenhouse gas emissions and accidents in the pricing reform process (CRRP 2010). COAG is therefore interested in implementing a pricing structure which more closely reflects mass, distance and location. One likely element of this would be to increase registration charges for larger heavy vehicles making long journeys (such as road trains or b-doubles) when compared to smaller heavy vehicles making shorter journeys. These changes are currently expected to be implemented no earlier than 2014. This variety of externality, cross subsidisation between road users, is further investigated later in this report. 3.2 Rail in Australia Australia has an extensive, complex, rail network covering the major capital cities. Australia’s rail infrastructure can broadly be broken down into interstate railways, intrastate railways and metropolitan passenger networks, some of the major links are shown in Figure 3.2 below. Deloitte Access Economics 19
The true value of rail

                            Figure 3.2: Major rail links in Australia

Source: BITRE 2009c

Interstate railways join Perth to Adelaide; Adelaide to Melbourne, Sydney and Darwin and
Sydney, Melbourne and Brisbane along the east coast. These interstate connections, all
standard gauge, carry passengers and freight.

Within states there are many different types of rail infrastructure including:
       networks such as the Goonyella system in Queensland or the Hunter Valley Coal
       network in NSW which primarily connect mines to the port;
       intercity rail networks such as that operated North of Brisbane by Queensland Rail
       (QR);
       regional freight networks, often used to transport grain; and
       private railways used to transport cane, timber and ore.

Looking to metropolitan passenger networks, there are electrified heavy rail networks in
Sydney, Melbourne, Brisbane and Perth and a non-electrified network in Adelaide.

The volume of freight moved by rail, measured in billion tonne kilometres has been growing
strongly over recent years from around 136.9 billion tonne kilometres in 2000-01 to around

Deloitte Access Economics                                                                   20
The true value of rail
198.7 billion tonne kilometres in 2006-07, accounting for around 39% of total freight
transported in 2006-07. This is an average growth rate of around 5.8% a year. Bulk
transport has been growing faster than non-bulk transport, around 5.9% a year for bulk
freight compared to 5.5% a year for non-bulk freight. This compares to a growth rate in
total road freight of around 4.5% a year over the same period and in costal shipping of
around 3.1% a year (BITRE 2009c).
Chart 3.4: Estimated rail freight task
billion tkm
250.0
200.0
150.0
100.0
50.0
0.0
1972-73
1974-75
1976-77
1978-79
1980-81
1982-83
1984-85
1986-87
1990-91
1992-93
1996-97
1998-99
2002-03
2004-05
1988-89
1994-95
2000-01
2006-07
Non-bulk Bulk
Source: BITRE 2009c, Access Economics calculations
Rail has not performed quite as well when measurements are made in millions of tonnes.
Rail has grown at an average rate of 3.4% a year between 2003-04 and 2006-07 as
compared to road’s 8.4% a year average growth. By this measurement, rail transport
makes up around 23% of the freight task. The better performance of rail when measured in
tonne kilometres, rather than just kilometres, indicates that rail has performed well in long
haul markets (BITRE 2009c).
As Chart 3.4 shows, bulk commodity transport currently makes up the majority of net tonne
kilometres transported by rail. In 2006-07, the latest year for which there are
comprehensive statistics available, bulk transport made up around 87% of freight net tonne
kilometres transported by rail (BITRE 2009c, BITRE 2010a).The major bulk commodities
transported by rail in terms of tonnage are iron ore and coal which together make up
around 75% of net tonne kilometres of bulk goods transported by rail (ACG 2008). Bulk
goods transported by rail are predominantly moved within, not between states (BITRE
2010a).
In terms of passenger transport, rail makes up a very small portion of passenger kilometres,
around 3.8% in 2007-08 but has been growing at an average rate of around 3.8% a year
since 2000-01, this is a faster growth rate than either road (1.1% a year) or bus transport
(1.2% a year) since 2000-01 (BITRE 2009c).
Deloitte Access Economics 21You can also read