Techno-economic Assessment for Generation III+ Small Modular Reactor Deployments in the Pacific Northwest
←
→
Page content transcription
If your browser does not render page correctly, please read the page content below
000000

         PNNL-30225

                      Techno-economic
                      Assessment for
                      Generation III+ Small
                      Modular Reactor
                      Deployments in the
                      Pacific Northwest
                      April 2021

                      Mark R. Weimar, Ali Zbib, Don Todd, PNNL;
                      Jacopo Buongiorno, Koroush Shirvan, MIT

                                    Prepared for the U.S. Department of Energy
                                    under Contract DE-AC05-76RL01830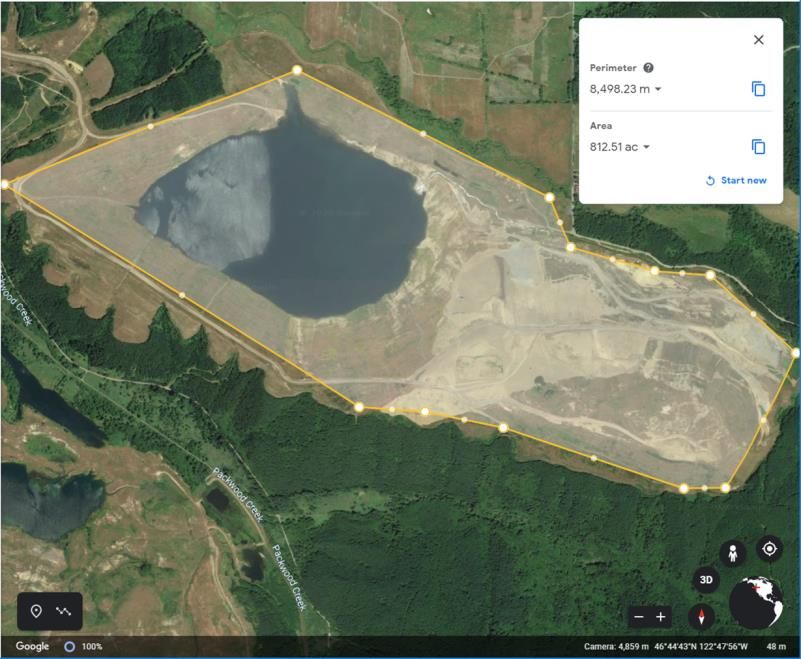
DISCLAIMER

This report was prepared as an account of work sponsored by an agency of the
United States Government. Neither the United States Government nor any agency
thereof, nor Battelle Memorial Institute, nor any of their employees, makes any
warranty, express or implied, or assumes any legal liability or responsibility
for the accuracy, completeness, or usefulness of any information, apparatus,
product, or process disclosed, or represents that its use would not infringe
privately owned rights. Reference herein to any specific commercial product,
process, or service by trade name, trademark, manufacturer, or otherwise does not
necessarily constitute or imply its endorsement, recommendation, or favoring by
the United States Government or any agency thereof, or Battelle Memorial
Institute. The views and opinions of authors expressed herein do not necessarily
state or reflect those of the United States Government or any agency thereof.

            PACIFIC NORTHWEST NATIONAL LABORATORY
                               operated by
                              BATTELLE
                                  for the
              UNITED STATES DEPARTMENT OF ENERGY
                   under Contract DE-AC05-76RL01830

                         Printed in the United States of America

                    Available to DOE and DOE contractors from the
                     Office of Scientific and Technical Information,
                       P.O. Box 62, Oak Ridge, TN 37831-0062;
                                    ph: (865) 576-8401
                                   fax: (865) 576-5728
                             email: reports@adonis.osti.gov

         Available to the public from the National Technical Information Service
                        5301 Shawnee Rd., Alexandria, VA 22312
                                 ph: (800) 553-NTIS (6847)
                  email: orders@ntis.gov
                           Online ordering: http://www.ntis.gov

                                Choose an item.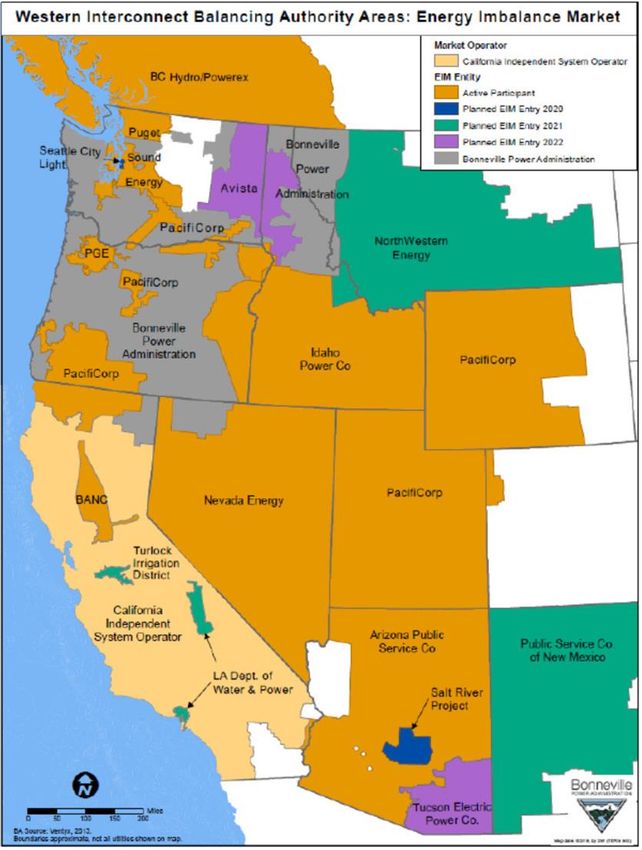
PNNL-30225

Techno-economic Assessment for Generation
III+ Small Modular Reactor Deployments in the
Pacific Northwest

April 2021

Mark R. Weimar, Ali Zbib, Don Todd, PNNL;
Jacopo Buongiorno, Koroush Shirvan, MIT

Prepared for
the U.S. Department of Energy
under Contract DE-AC05-76RL01830

Pacific Northwest National Laboratory
Richland, Washington 99354
PNNL-30225

       Acknowledgments
       We thank Paul Boyadjian, Jose Reyes, Rudy Murgo, Kent Welter from NuScale, Doug McDonald and
       Martin Owens from GEH Hitachi, Greg Cullen and Don Gregoire from Energy Northwest, and Mason
       Baker from Utah Association of Municipal Power Systems (UAMPS) for their input on the content of this
       report.

Abstract                                                                                                       ii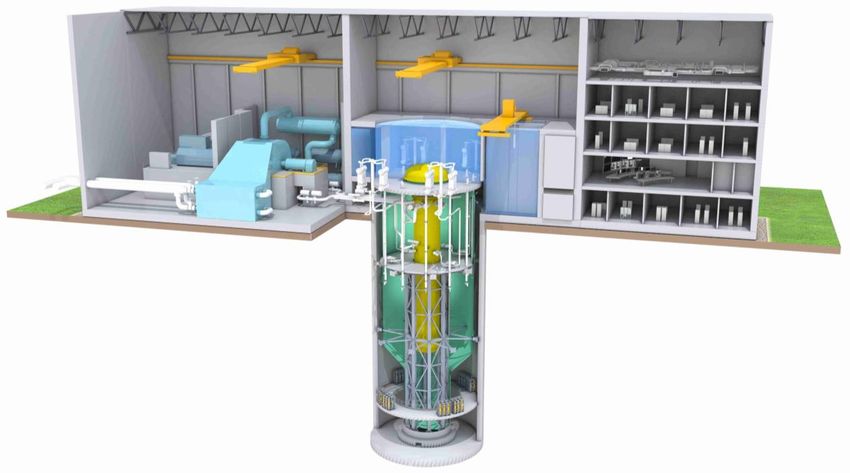
PNNL-30225

       Abstract
       Legislative changes in the Pacific Northwest (PNW), notably in Washington State, are driving the
       electricity sector to be carbon neutral by 2030 and ultimately carbon free by 2045. The legislative changes
       have renewed interest in nuclear power as a sustainable, carbon-free source of baseload electricity. The
       renewed interest aligns with the U.S. Department of Energy’s objectives of restoring U.S. leadership in
       nuclear energy and accelerating the deployment of nuclear power plants, including small modular reactors
       (SMRs), in the United States. Thus, Pacific Northwest National Laboratory (PNNL) in collaboration with
       the Massachusetts Institute of Technology, conducted a study that evaluated siting Gen III+ SMR
       concepts in Washington State. The study evaluated the market changes in consideration of Washington
       State’s legislation. The study included the integration of advanced reactor concepts in a clean energy
       portfolio. The legislative changes along with projected levelized costs of energy and the projected
       electricity market were analyzed to determine the feasibility of introducing SMRs to meet the goals of
       zero carbon emissions. Five case studies were analyzed combining two SMR technologies and three
       potential sites: The NuScale SMR was evaluated at three potential sites and the GEH BWRX-300 was
       evaluated at two potential sites. The first case study evaluated NuScale at the Idaho National Laboratory
       as a potential Utah Association of Municipal Power Systems project. Case 2 evaluated a NuScale SMR at
       the Energy Northwest site (Site 1) in eastern Washington State. The third case study evaluated placing a
       GEH BWRX-300 at Site 1 with the same cost reductions as the NuScale Plant. Cases 4 and 5 evaluated
       NuScale and an GEH BWRX-300, respectively, at the current Centralia coal plant site. Although
       Levelized Costs of Electricity (LCOEs) were developed for both NuScale and GEH, the sets of LCOEs
       are not comparable. NuScale’s estimate is based on the current design. GEH is using a design-to-cost
       methodology with target pricing that is being confirmed as the design matures. The feasibility study
       indicated that in a future carbon-free electricity sector, deployment of advanced SMRs would be
       competitive if the projected LCOEs for these designs can be attained. An LCOE in the range of
       $51/MWh–$54/MWh was calculated for the NuScale design using NuScale’s design estimates. An LCOE
       in the range of $44–$51/MWh was calculated for the BWRX-300 using GEH’s design-to-cost and target
       pricing input.

Abstract                                                                                                             iii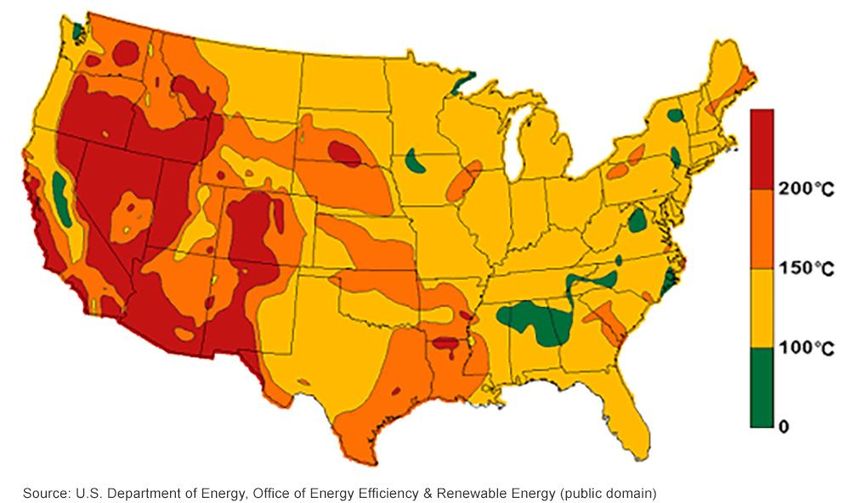
PNNL-30225

Abstract           iv
PNNL-30225

      Executive Summary
      Legislative changes in the Pacific Northwest, notably in Washington State, are driving the electricity
      sector to be carbon neutral by 2030 and ultimately carbon free by 2045. The legislative changes have
      stimulated renewed interest in nuclear power as a sustainable, carbon-free source of firm, flexible
      electricity. The renewed interest aligns with the U.S. Department of Energy’s objectives of restoring U.S.
      leadership in nuclear energy and accelerating the deployment of nuclear power plants including small
      modular reactors (SMRs) in the United States (U.S.). Thus, Pacific Northwest National Laboratory
      (PNNL) and the Massachusetts Institute of Technology (MIT) conducted a study that evaluated the value
      proposition of deploying Generation (Gen) III+ SMRs advanced reactor concepts in the Pacific
      Northwest.

      The feasibility study indicated that in a future carbon-free electricity sector, deployment of advanced
      SMRs would be competitive if the projected LCOEs for these designs can be attained. An LCOE for an
      nth-of-a-kind (NOAK) SMR in the range of $51/MWh–$54/MWh was calculated for the NuScale design
      using NuScale’s design estimates. An LCOE in the range of $44–$51/MWh was calculated for the
      BWRX-300 using GE-Hitachi’s (GEH’s) design-to-cost and target pricing input. All results are in 2019$
      with the exception of Utah Association of Municipal Power Systems’ (UAMPS’) price of $55/MWh,
      which is in 2018$. The NuScale and GEH BWRX-300 LCOEs are not intended to be directly compared
      in this study. NuScale’s estimate is based on the current design. GEH is using a design-to-cost
      methodology with target pricing that is being confirmed as the design matures. Whether there needs to be
      a subsidy for the NOAK plant to enter the market depends on the price and quantity of competing
      resources, the size of the future market, the quantity of non-emitting resources that need to be replaced,
      and whether the UAMPS subscription price indicates that municipal utilities are willing to purchase firm
      electricity at $55/MWh. In addition, the quantity of future non-emitting capacity depends on the amount
      of emitting resources Washington utilities must replace, the availability and cost of unbundled renewable
      energy credits (RECs), and the quantity of energy conservation projects that have a positive net present
      value. Utilities can substitute up to 20 percent of the total sales with unbundled RECs and energy
      conservation projects through 2045.

      A study of the Pacific Northwest electricity market showed significant variation in load on a monthly,
      daily and even 5-minute increment basis. An emerging clean energy market with a significant penetration
      of variable and intermittent renewable energy sources will require additional flexible power sources to
      address the load fluctuations. In addition to being a source of baseload power, these advanced nuclear
      reactor concepts are being designed with attributes that will address the characteristics of the emerging
      clean energy markets including flexible operation, black start capabilities, and island mode operation,
      which will help augment the variable and intermittent sources.

      SMRs may face competition from other firm power sources. The Energy Information Administration
      (EIA) estimates geothermal entering the market in 2025 at $37/MWh (2019$), while advanced
      geothermal is estimated to cost $47/MWh (2019$). Entities can get a $2/MWh tax credit that reduces the
      cost to $35–$45/MWh if the project is properly structured. All estimates are probably in the same error
      range. Natural gas combined cycle (NGCC) power could be purchased between 2030 and 2045 at a
      penalty price of $97/MWh. These two resources bound the market for firm resources. If NGCC is
      required, no subsidy would be required because NGCC would set the market price. However, near-firm
      renewable resources could provide a portion of the energy required by the time the first SMR reaches
      commercial operation. Variable renewable resources with batteries or other storage could provide
      approximately 4 percent of the firm power requirements at current prices. According to two separate MIT
      studies, wind plus battery could provide between 16 and 95 percent of firm power requirements in the
      future at battery prices of about $150/MWh.

Executive Summary                                                                                                  v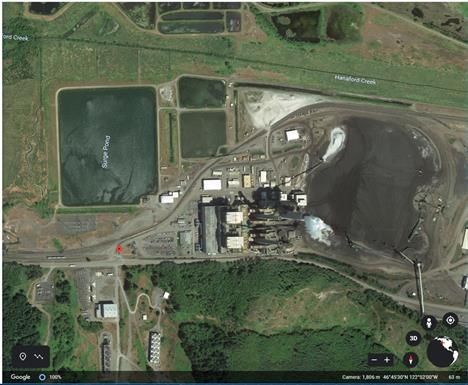
PNNL-30225
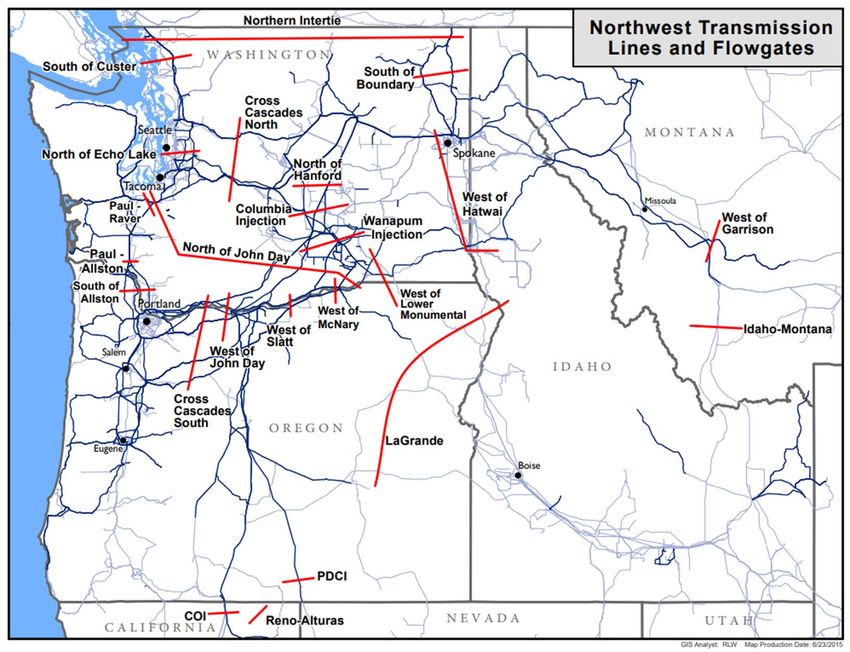
UAMPS suggested an exchange agreement with Bonneville Power Administration (BPA) to reduce
current pancaking1 transmission costs. With BPA’s entry into the Energy Imbalance Market (EIM), a
potential for a Western Electricity Coordinating Council (WECC) area-wide market, and assuming the
potential one balancing authority like the Midwest Independent System Operator, the probability of
having a larger wholesale power market increases. With a wider wholesale power market, energy could
flow inexpensively from other EIM areas with an abundance of solar and wind at significantly reduced
transmission costs. Only one transmission cost is applied rather than pancaking the transmission costs
without the EIM and a wider wholesale market. One issue that will need to be understood is how the state
of Washington will handle the mix of electricity coming over the transmission system, which will include
carbon-emitting resources. The benefits of the EIM could be exemplified by the UAMPS shipping power
to Washington State. The EIM reduces the overall transmission costs from Idaho to BPA from $24/MWh
to $4/MWh.
The estimated market capacity derived from replacing carbon-emitting resources is about 5 GWe. With a
growing population and increasing electric vehicle (EV) penetration, the capacity requirement could be
larger. Near-firm production provides a narrow range for geothermal and SMRs to fill because near-firm
generation could provide up to 5 GWe, which is the current coal and natural gas generating capacity in
Washington State.
In a Day-Ahead Market like the California Independent System Operator’s (CAISO’s), the marginal cost
of providing energy provides the supply curve for electricity delivery. As such, geothermal and SMRs
would enter the market up to the quantity meeting their marginal costs. Everyone would receive the
highest bid price. The price obviously does not cover long-run costs, but the expectation is that power
shortages over time will provide prices high enough to cover the costs. In this scenario, no subsidy would
be required. Under the current system each Balancing Area Authority is responsible for assuring their
loads are balanced.
Bilateral agreements such as those occurring with UAMPS and subscribers to their plant are another
approach to determining if a subsidy is required. Subscribers will purchase a mix of generation to meet
their energy needs. If the UAMPS subscription target is an indicator, utilities appear to be willing to pay
$55/MWh for firm power, which indicates that a subsidy in the range $15–$30/MWh is required for the
first-of-a-kind (FOAK) plant depending on the assumptions used to derive the subsidy. This also suggests
that if the price of the NOAK plant is below the $55/MWh target, utilities might not need any further
subsidy for firm power. If the price for SMR electricity is higher, then a subsidy would be required to
bring the cost down to the point where utilities would buy the power. In addition, if the project can be
properly structured, the production tax credit could be potentially sold, which would provide an
approximate $7/MWh subsidy according to EIA, This indicates that if both NuScale and GEH can reach
their estimates for an NOAK plant they would need no additional subsidy.
Energy Northwest (ENW) is evaluating adding SMR capacity in Washington State. ENW, formerly the
Washington Public Power Supply System, was formed in 1957 and has a history of providing nuclear
power. It operates the Columbia Generating Station (CGS), a boiling water reactor (BWR) that is just
north of Richland, Washington, on a site that includes another partially built nuclear power plant. The
CGS produced power for $35.6/MWh and $47.6/MWh in fiscal year (FY) 2018 and FY 2019,
respectively. The fluctuation depends on refueling outages and other activities (ENW 2019). The
projected LCOE (2014–2043) is between $47/MWh and $52/MWh (ENW 2020). They are selling power
at cost to the BPA.
1
Pancaking refers to each transmission owner adding their transmission costs to the Power Purchase Agreement
price.
Executive Summary vi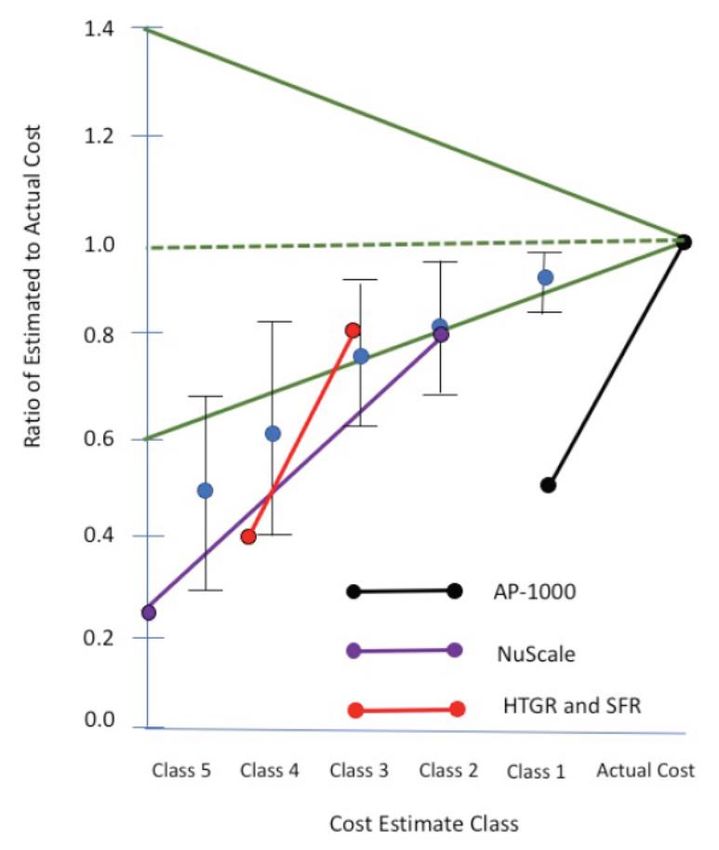
PNNL-30225

      This study evaluated the market changes considering Washington State’s legislation. The legislative
      changes along with projected LCOEs and the projected electricity market were analyzed to determine the
      feasibility of introducing Gen III+ SMRs to meet the goals of zero carbon emissions. Five cases studies
      were analyzed:
       • The first case study evaluated a NuScale SMR at the Idaho National Laboratory (INL) site as a
         potential UAMPS project. The INL site is currently under development and UAMPS provided a
         Power Purchase Agreement (PPA) price and suggested a way to get the electricity to Washington
         State at lower costs.
       • Case 2 evaluated a NuScale SMR at ENW’s Site 1 in eastern Washington State. The site was
         previously evaluated for construction of a light water reactor (LWR) nuclear power plant. Cost
         reductions associated with leveraging the existing infrastructure and documentation on the site, the
         benefits of building the plant in proximity to an operating BWR (CGS), and the benefits of
         constructing a plant in an area that already has a skilled nuclear energy workforce were assessed.
       • The third case study evaluated placing an GEH BWRX-300 at Site 1 with the same cost reductions
         as those of the NuScale plant.
       • Cases 4 and 5 evaluated NuScale and an GEH BWRX-300, respectively, at the site of the current
         coal plant in Centralia, Washington.

      As this report was being finalized, two awards for advanced reactor demonstrations were announced by
      the U.S. Department of Energy: TerraPower’s Natrium reactor, a 345 MWe sodium-cooled fast reactor
      with a molten salt thermal energy storage that can flex the power output to 500 MWe, and X-Energy’s
      Xe-100 reactor, a 320 MWe (4-80 MWe modules) high-temperature gas reactor. The impact of these
      projects on the future energy markets were not evaluated in this study.

Executive Summary                                                                                                vii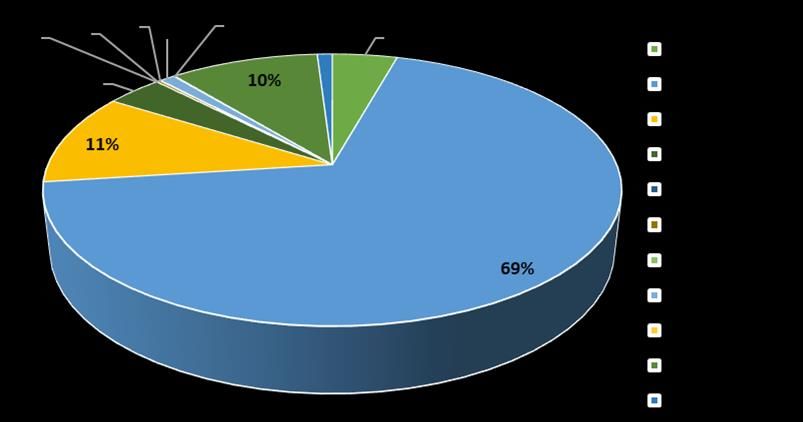
PNNL-30225

Executive Summary          viii
PNNL-30225

      Acronyms and Abbreviations
      AAPS                   Alternate AC Power Source
      AC                     alternating current
      ADS                    accelerator driven system
      ARPA-E                 Advanced Research Projects Agency–Energy
      ASME                   American Society of Mechanical Engineers
      B&W                    Babcock & Wilcox
      BA                     Balancing Authority
      BAA                    Balancing Authority Area
      BPA                    Bonneville Power Administration
      BWR                    boiling water reactor
      CAISO                  California Independent System Operator
      CCS                    carbon capture and sequestration
      CETA                   Clean Energy Transformation Act
      CFPP                   Carbon-Free Power Plant
      CGS                    Columbia Generating Station
      CMSR                   CUBE Molten Salt Reactor
      DCA                    Design Certification Application
      DoD                    U.S. Department of Defense
      DOE                    U.S. Department of Energy
      E3                     Energy + Environmental Economics
      EEDB                   Energy Economics Data Base
      EIA                    Energy Information Administration
      EIM                    Energy Imbalance Market
      EIS                    environmental impact statement
      ENW                    Energy Northwest
      EPA                    U.S. Environmental Protection Agency
      EPC                    Engineering, Procurement and Construction
      EPR                    European Pressurized Reactor
      EPRI                   Electric Power Research Institute
      EPZ                    Emergency Protection Zone
      ER                     Environmental Report
      EV                     electric vehicle
      FOAK                   first-of-a-kind
      FRP                    full rate production
      FTE                    full-time equivalent (employee)
      GEH                    GE-Hitachi

Acronyms and Abbreviations                                                       ix
PNNL-30225
GW gigawatt
HFC hydrofluorocarbon
HLH High Load Hour
HX heat exchanger
I&C instrumentation and controls
IAEA International Atomic Energy Agency
ICBM Inter-Continental Ballistic Missile
ICS isolation condenser system
INL Idaho National Laboratory
IOU investor-owned utility
IRR internal rate of return
ITC investment tax credit
kgHM kilogram(s) heavy metals
kgIHM kilogram(s) initial heavy metals
LCOE levelized cost of electricity
LCOH levelized cost of heat
LDV light-duty vehicle
LEU low-enriched uranium
LLH Light Load Hour
LMP Locational Marginal Price
LWR light water reactor
MIT Massachusetts Institute of Technology
MMBTU million British thermal units
MW megawatt(s)
MWh megawatt-hour(s), unless otherwise stated, it is megawatt-hour electric
MWhe Megawatt-hour(s) electric
MWht megawatt-hour(s) thermal
NA not available
NEI Nuclear Energy Institute
NG natural gas
NGCC natural gas combined cycle
NGNP Next Generation Nuclear Plant
NOAK nth-of-a-kind
NPCC Northwest Power and Conservation Council
NPM nuclear power module
NPP nuclear power plant
NRC U.S. Nuclear Regulatory Commission
NREL National Renewable Energy Laboratory
Acronyms and Abbreviations xPNNL-30225
NRIC National Reactor Innovation Center
NW northwest
O&M operations and maintenance
ORNL Oak Ridge National Laboratory
PAC PacifiCorp
PCU power conversion unit
PJM Pennsylvania Jersey Maryland Independent System Operator
PNNL Pacific Northwest National Laboratory
PPA Power Purchase Agreement
PTC production tax credit
PUD Public Utility District
PWR Pressurized Water Reactor
REC Renewable Energy Credit
RPV Reactor Pressure Vessel
SCO Strategic Capabilities Office
SG steam generator
SIE South Idaho Exchange
SMR Small modular reactors
SNF Spent Nuclear Fuel
SSC structures, systems, and components
SWU Separative Work Unit
TE Terrestrial Energy
TRL Technology Readiness Level
TWR Traveling wave reactor
UAMPS Utah Association of Municipal Power Systems
U.S. United States
USD U.S. dollars
WA Washington
WACC weighted average cost of capital
WADOE Washington Department of Ecology
WAPA Western Area Power Administration
WEC Westinghouse Electric Company
WECC Western Electricity Coordinating Council
WLFR Westinghouse Lead Fast Reactor
WNP-1 Potential SMR site north of Richland next to WNP-2; also called Site 1 in this
report
WNP-2 Columbia Generating Station
Acronyms and Abbreviations xiPNNL-30225
Table of Contents
Abstract ........................................................................................................................................................ iii
Executive Summary ...................................................................................................................................... v
Acronyms and Abbreviations ...................................................................................................................... ix
Figures …………………………………………………………………………………………………...xiii
Tables …………………………………………………………………………………………………...xiv
1.0 Introduction ......................................................................................................................................... 1
1.1 Study Purpose and Scope .................................................................................................... 1
1.2 Clean Energy Transformation Act ...................................................................................... 2
1.3 Commercial Nuclear Energy in the Pacific Northwest ....................................................... 4
1.4 Report Contents and Organization ...................................................................................... 4
2.0 Review of Nuclear Power Plant Characteristics.................................................................................. 5
2.1 Electrical Generating Characteristics Relevant to the Emerging Clean Energy
Market ................................................................................................................................. 5
2.1.1 Beyond Baseload ................................................................................................ 7
2.1.2 Response to Rapid Changes in Generation or Demand ...................................... 9
2.1.3 Island Mode ........................................................................................................ 9
2.1.4 Black Start Capabilities ...................................................................................... 9
2.1.5 Additional Services .......................................................................................... 10
2.2 Overview of Generation III+ Small Modular Reactor Concepts ...................................... 10
2.2.1 NuScale SMR ................................................................................................... 11
2.2.2 GEH BWRX-300.............................................................................................. 12
3.0 Significant Relevant LCOE Studies and the Approach to Estimating LCOEs ................................. 14
3.1 LCOE Literature ............................................................................................................... 14
4.0 Current Energy Market and Projected Electricity Demand............................................................... 17
4.1 Current Supply and Demand for Electricity ..................................................................... 17
4.2 Impact of BPA Entry into the Energy Imbalance Market ................................................. 18
4.3 Projections of Electricity Demand and Supply ................................................................. 20
4.3.1 Adjustments to Future Market Projections ....................................................... 20
4.3.2 Impact of Moving to EVs on Electricity Demand ............................................ 21
4.4 Electricity Price Projections .............................................................................................. 22
5.0 Case Studies ...................................................................................................................................... 23
5.1 Approach to Estimating LCOE ......................................................................................... 24
5.2 Case 1: NuScale Facility at the Idaho National Laboratory Site ...................................... 28
5.3 Energy Northwest Site 1 ................................................................................................... 30
5.3.1 Case 2: NuScale at the Energy Northwest Site 1 .............................................. 31
5.3.2 Case 3: GEH BWRX-300 at the Energy Northwest Site 1 ............................... 38
5.4 Coal Plant Site in Centralia Washington .......................................................................... 40
Acronyms and Abbreviations xiiPNNL-30225
5.4.1 Case 4: NuScale Facility at the Coal Plant Site in Centralia Washington ........ 44
5.4.2 Case 5: GEH BWRX-300s at the Coal Plant Site in Centralia
Washington ....................................................................................................... 47
6.0 Firm and Near-firm Carbon-Free Generation Competition .............................................................. 51
6.1 Long-term Storage ............................................................................................................ 51
6.2 Wind and Solar with Long-Term Storage ......................................................................... 51
6.3 Future LCOEs ................................................................................................................... 52
7.0 Analysis of Results for NuScale and GEH BWRX-300 ................................................................... 59
7.1 Comparison of NuScale Results ....................................................................................... 59
7.2 Comparison of GEH BWRX-300 Results ........................................................................ 60
8.0 Conclusions ....................................................................................................................................... 62
9.0 References ......................................................................................................................................... 64
Appendix A – Questionnaires ................................................................................................................... A.1
A.1 GEH and NuScale Questionnaire.................................................................................... A.1
A.2 Energy Northwest Questionnaire .................................................................................... A.2
Figures
Figure 2.1. 2019 monthly and February 2019 daily average load on the BPA network. ...................... 6
Figure 2.2. Net load and total wind generation on select days. ............................................................. 7
Figure 2.3. Schematic of one NuScale SMR module. ......................................................................... 11
Figure 2.4. Schematic of the GEH BWRX-300 plant layout. ............................................................. 13
Figure 4.1. Washington State generation capacity by shares in 2018 (for a total generating capacity
of 30,983 MWe). ............................................................................................................... 17
Figure 4.2. The Western Interconnect Balancing Authority Areas in the EIM in 2019. ..................... 18
Figure 4.3. Components of the EIM wholesale price at Redmond WA ($/MWh). ............................. 20
Figure 4.4. Congested lines (indicated in red)with EV penetrations. .................................................. 22
Figure 5.1. Cost change from conceptual design to completion for mega-projects as designs mature.
(The blue data points are non-nuclear projects of similar complexity.) (Buongiorno et al.
2018) 24
Figure 5.2. Prices by month BPA rate proceeding for Light Load Hour (LLH) and High Load Hour
generation (HLH) (BPA 2016). ........................................................................................ 34
Figure 5.3. Example of NuScale plant load-following capability. The graphic indicates how well the
NuScale plant can follow demand and meet the gap between Horse Butte (wind project)
and demand. ...................................................................................................................... 35
Figure 5.4. Aerial view of the Centralia coal fire plants. (Graphic obtained from Google
Earth.)…..………………………………………………………………………………...41
Figure 5.5. TransAlta coal mining site. (Graphic obtained from Google Earth.) ................................ 42
Figure 5.6. Seismic map of the Centralia area. The lines indicate faults (DNR 1981). ...................... 43
Figure 6.1. Geothermal resources of the United States. ...................................................................... 56
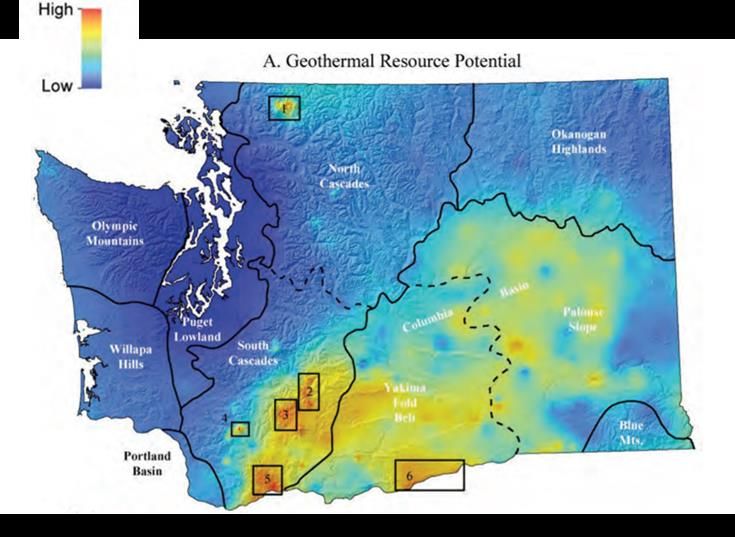
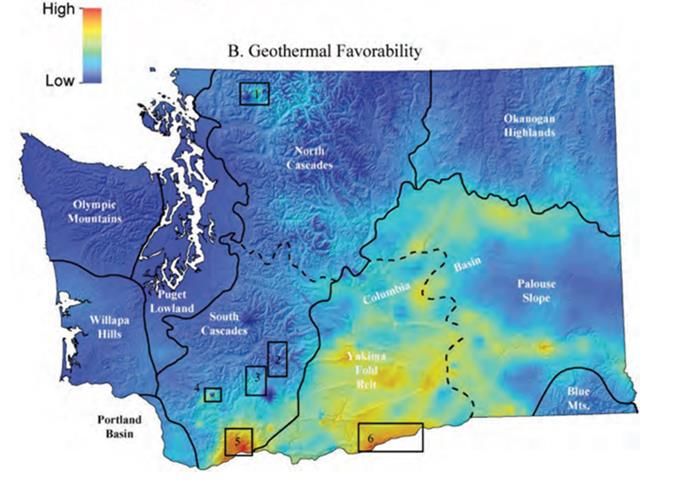
Figure 6.2. Geothermal resource potential in Washington State. ........................................................ 57
Figures xiiiPNNL-30225
Figure 6.3. Geothermal resource favorability (accessibility to transmission) in Washington State.
………………………………………………………………………………...58
Tables
Table 1.1. 2018 fuel mix for power generation in Washington State. ................................................. 3
Table 2.1. NuScale SMR design data (12-module plant) .................................................................... 12
Table 2.2. GEH BWRX-300 design data. ........................................................................................... 13
Table 3.1. Comparison of conventional nuclear cost at the low and high end ($/MWh), Lazard (2019)
study ………………………………………………………………………………...14
Table 3.2. Capital costs with interest for advanced reactors, .............................................................. 15
Table 5.1. Comparison of the environmental characteristics at the proposed sites. ............................ 26
Table 5.2. NRC total cost for new reactors business line fee estimates (NRC 2020a)........................ 27
Table 5.3. Nuclear fuel prices.............................................................................................................. 28
Table 5.4. Added costs of delivering power from INL ($/MWh). ...................................................... 29
Table 5.5. A list of savings from Site 1 derived from using previous plants’ remaining structures
($000 2014$). .................................................................................................................... 31
Table 5.6. NuScale’s LCOEs at Site 1 for different real interest rates for the WACC ($/MWh). ...... 32
Table 5.7. Project length at Site 1 ($/MWh)........................................................................................ 32
Table 5.8. Operational period length at Site 1 ($/MWh). .................................................................... 32
Table 5.9. Impact of improving operating efficiency at Site 1 ($/MWh). ........................................... 33
Table 5.10. Impact of different capacity factors at Site 1 ($/MWh). ................................................... 33
Table 5.11. NuScale flexibility capabilities (Colbert 2019). ............................................................... 36
Table 5.12. Priority firm power rate and demand charges (BPA 2019c). ........................................... 36
Table 5.13. BPA load shaping rate. ..................................................................................................... 37
Table 5.14. Base transmission rates for main and secondary systems. ............................................... 37
Table 5.15. GEH BWRX-300’s LCOEs at Site 1 for different real interest rates for the WACC
($/MWh). ………………………………………………………………………………...39
Table 5.16. Project length at Site 1 ($/MWh)...................................................................................... 39
Table 5.17. Operational period length at Site 1 ($/MWh). .................................................................. 39
Table 5.18. Impact of improving operating efficiency at Site 1 ($/MWh). ......................................... 39
Table 5.19. Impact of different capacity factors at Site 1 ($/MWh).................................................... 40
Table 5.20. NuScale’s LCOEs for different real interest rates for the WACC at the Centralia site
($/MWh)………………………………………………………………………………... 45
Table 5.21. Project length at the Centralia site ($/MWh). ................................................................... 46
Table 5.22. Operational period length at the Centralia Site ($/MWh). ................................................ 46
Table 5.23. Impact of improving operating efficiency. ....................................................................... 46
Table 5.24. Impact of different capacity factors ($/MWh).................................................................. 47
Table 5.25. GEH BWRX-300’s LCOEs for different real interest rates for the WACC at the Centralia
site ($/MWh). .................................................................................................................... 48
Tables xivPNNL-30225
Table 5.26. Project length at the Centralia site ($/MWh). ................................................................... 48
Table 5.27. Operational period length at the Centralia Site ($/MWh). ............................................... 48
Table 5.28. Impact of improving operating efficiency. ....................................................................... 49
Table 5.29. Impact of lower capacity factors. ..................................................................................... 49
Table 6.1. LCOE for wind in the Columbia Basin before tax credits. ................................................ 52
Table 6.2. Forecast weighted1 LCOEs for generation resources entering service in 2025 ($/MWh
2019$) ………………………………………………………………………………...53
Table 6.3. Forecast unweighted LCOEs for generation resources entering service in 2025 ($/MWh
2019$)……………………………………………………………………………………
55
Tables xvPNNL-30225
1.0 Introduction
Legislative changes in the Pacific Northwest, notably in Washington State, are driving the electricity
sector to be carbon neutral by 2030 and ultimately carbon free by 2045. The legislative changes have
prompted renewed interest in nuclear power as a sustainable, carbon-free source of baseload electricity.
This renewed interest aligns with the U.S. Department of Energy’s (DOE’s) objectives of restoring U.S.
leadership in nuclear energy and accelerating the deployment of flexible nuclear power plants, including
small modular reactors (SMRs), in the United States (U.S.). Regionally, nuclear power may have an
advantage over near-firm and firm renewables, because the renewable resource levelized cost of
electricity (LCOE) differs from region to region. Thus, while small nuclear reactors may be too expensive
in some regions, they may be cost competitive in others. To explore the implications for Washington
State and its Clean Energy Transformation Act (CETA 2019), which commits the state to an electricity
supply free of greenhouse gas emissions by 2045, Pacific Northwest National Laboratory (PNNL) in
collaboration with Massachusetts Institute of Technology (MIT) conducted a study that evaluated the
value proposition of deploying Generation (Gen) III+ SMRs in in the Pacific Northwest and Washington
State.1
1.1 Study Purpose and Scope
The study reported here evaluated the market changes considering Washington State’s legislation—
CETA. The characteristics of SMRs were reviewed to evaluate their capability to meet flexibility
requirements. The legislative changes along with projected LCOEs and the projected electricity market
were analyzed to determine the feasibility of introducing SMRs to meet the zero carbon emission goals.
Both near-term and long-term potential deployment options were assessed.
Five case studies were analyzed; near-term options included evaluating placement of NuScale-designed
plants (each containing 12 SMR units) delivering roughly 600–700 MW of electricity at three different
sites, and the GE-Hitachi (GEH)-designed SMR plants delivering roughly 300 MW of electricity at two
different sites:
• Case 1 evaluated a NuScale SMR at the Idaho National Laboratory as a potential UAMPS project.
This case provides the estimate of a first-of-a-kind (FOAK) SMR.
• Cases 2 and 3 evaluated a NuScale SMR and a GEH BWRX-300 at the Energy Northwest (ENW)
site in eastern Washington State. The site had been evaluated previously for a light water reactor
(LWR) nuclear power plant construction. Cost reductions associated with leveraging existing
infrastructure and documentation on the site, the benefits of building the plant in proximity to an
operating boiling water reactor (BWR) plant (Columbia Generating Station operated by ENW), and
the benefits of constructing a plant in an area that already has a skilled nuclear energy workforce
were assessed. The two LCOEs are not comparable because the approach to estimating them is
different. NuScale’s costs are based on designs, while GEH is designing to a cost target.
• Cases 4 and 5 analyzed placing an SMR at a strategically important site in Washington State—the
Centralia site where the last remaining coal plants in the state are located and will be closed by 2025.
1
Gen I refers to the prototype and power reactors that launched civil nuclear power. All commercial Gen I plants in
the U.S. have been permanently shut down. Gen II refers to power reactors designed in the 1960s/1970s. All
commercial reactors currently operating in the U.S. are Gen II plants. Gen III refers to advanced Gen II type
reactors, none of which have been built in the U.S. Gen III+ refers to Gen III type reactors that have evolutionary
designs offering improved economics and expanded use of passive safety features. Two Gen III+ plants are currently
under construction in the U.S. Gen IV refers to advanced reactor concepts that are a significant departure from LWR
technology. No Gen IV plants have been built in the U.S.
Introduction 1PNNL-30225
With the loss of the coal plants, a source of dispatchable power will be lost. Two alternatives were
evaluated. One evaluated replacing the coal plants with SMRs. A second option evaluated adding an
SMR at the site but not at the current location of the facility. A brownfield site where coal had been
previously mined was chosen and one NuScale SMR or two GEH BWRX-300s were evaluated.
1.2 Clean Energy Transformation Act
Washington State’s CETA may provide opportunities for flexible nuclear power.1 The law calls for
carbon neutrality by 2030 and carbon-free power by 2045 in the state’s electricity sector. The law applies
to both investor-owned utilities and consumer-owned electricity—all electricity will be coming from non-
emitting resources by 2045. The law calls for the elimination of coal by 2025 and imposes potential
penalties for electricity generation for all carbon-emitting resources starting in 2030 (WA 2019). The
movement to non-dispatchable variable resource generation will require flexible non-carbon-emitting
resources to meet ramping and frequency regulation requirements. SMRs are a probable resource for
meeting the required flexibility, as are renewable methane (made with green hydrogen and carbon dioxide
[CO2]), renewable natural gas from decomposition of organic matter, and natural gas combined-cycle
(NGCC) generators with carbon capture and sequestration (CCS) (Roberts 2019).
Beginning in 2022, utilities must develop plans that lead to carbon neutrality by 2030 and carbon-free
generation by 2045. Utilities must pursue conservation measures first to meet load and then renewable
resources and non-emitting resources for 100 percent of load. Between 2030 and 2040, utilities can satisfy
up to 20 percent of their retail sales using alternative compliance options. Starting in 2030, compliance
with the law can be achieved by providing a compliance payment, using unbundled Renewable Energy
Credits (RECs), investing in energy transformation projects, and/or using energy recovery facilities to
generate electricity.
Compliance payments are based on $150/MWh for coal generation, $84/MWh for natural gas generation,
and $60/MWh for NGCC generators (WA 2019). These payments are consistent with a $150/T CO2 tax.
Unbundled RECs could provide the lowest cost of the approaches because they have been as low as
$0.35/REC for 1 MWh of renewable generated electricity (EPA ca 2018). As recently as 2019, the price
of a REC was below $1. Thus, a very inexpensive choice may be used by most Washington State utilities
to meet their requirements. As of 2018, only 17.5 percent of electricity generated was from natural gas or
coal (see Table 1.1) (WADOC 2019). The latest utility-by-utility information indicates that three
investor-owned utilities and two Public Utility Districts (PUDs) accounted for 77 percent of the carbon-
emitting resources in 2016. Thus 62 of 67 utilities may be able to purchase RECs to meet their obligations
before 2045 while the remaining 5 utilities may purchase RECs for a portion but will be required to make
the compliance payment on the remaining emitting resources (WADOC 2017) if they do not obtain non-
emitting generation resources. The remaining amount that needs to be filled by non-emitting resources or
pay the penalty is about 13 TWh currently or 1.5 to 2.0 GW.
1
Flexible nuclear power moves beyond inflexible baseload electric generation and delivers carbon-free electricity,
and other useable commodities such as process heat, to complement intermittent and variable generation sources.
Introduction 2PNNL-30225
Table 1.1. 2018 fuel mix for power generation in Washington State.
Total Electric
Power Share of
Fuel Type (MWh) Total (%)
Hydro 55,340,207 59.16
Unspecified 12,095,395 12.93
Coal 9,556,048 10.22
Natural Gas 6,861,147 7.33
Nuclear 4,441,378 4.75
Wind 4,288,021 4.58
Biomass 417,963 0.45
Solar 263,695 0.28
Biogas 184,859 0.20
Other Biogenic 42,931 0.05
Waste 35,627 0.04
Petroleum 15,854 0.02
Geothermal 3,540 0.00
Total 93,546,665 100.00
The law also constrains retail price increases to 2 percent per year (WA 2019), which may push energy
conservation and RECs as low-cost options for achieving compliance. Utilities can also meet the 20
percent compliance requirement by building carbon-reducing infrastructure such as electric car charging
stations, or weatherization, or investing in renewable natural gas facilities. An open question is whether
there will be enough unbundled RECs or enough viable energy conservation projects to meet the 20
percent requirement, which could lead to a higher amount of capacity being required.
New hydroelectric generation is restricted in the Act so that new hydro generation will probably not be
allowed as a new non-emitting generation source. All existing hydroelectric generation is allowed, but no
impoundment of streams and rivers, expansion of reservoirs, bypass reaches can be used for new
generation. Hydroelectric energy can be developed for pumped storage as long as it does not conflict with
fish recovery plans and complies with all laws. The law does allow hydroelectric generation on canals, in
irrigation pipes, or other manmade waterways (WA 2019). Thus, some new NGCC with CCS, small
hydroelectric, land fill gas, and biomass plants may compete with SMRs in meeting flexible generation
requirements.
The Northwest Power Pool is considerably more dependent on coal and natural gas than the state of
Washington. Coal and natural gas provide more than 38 percent of the mix. The Northwest Power Pool
represents more of the fuel mix for the Energy Imbalance Market (EIM) than the current supply balance
with bilateral contracts for Washington utilities. With the entry of most of the Pacific Northwest into the
EIM, a question for rulemaking will be how Washington State handles the EIM mix of emitting and non-
emitting resources.
Rulemaking is managed by the Washington State Department of Commerce. The process will make some
provisions and implementation of the law clearer. Washington electricity carbon emissions contain
95 g/kWh, while the U.S. averages 450 g/kWh, primarily because the Washington electric grid relies
primarily on hydro and nuclear energy (EIA 2019c).
Introduction 3PNNL-30225
1.3 Commercial Nuclear Energy in the Pacific Northwest
ENW, formerly the Washington Public Power Supply System, was established in 1957. The current
nuclear power plant, Columbia Generating Station (CGS), is located 8 miles north of Richland,
Washington, at the site of nuclear power plant 2 (WPN-2) at Hanford. The plant cost $7.63 billion
(2018$) to construct and has a net capacity of 1,174 MWe. In fiscal year (FY) 2018, CGS generated 9,722
GWh at a cost of $35.6/MWh and in FY 2019, it generated 8,873 GWh at a cost of $47.6/MWh. The
fluctuation depends on the timing of the refueling outage and other activities (ENW 2019). The projected
levelized cost of electricity (2014–2043) is between $47/MWh and $52/MWh (ENW 2020). They are
selling power at cost to the Bonneville Power Administration (BPA).
Initially, ENW attempted to build five nuclear generating facilities. The projects’ cost estimate reached
almost $24 billion in 1981. WNP-4, at Hanford, and WNP-5, at Satsop, Washington, neither project
supported by BPA, were discontinued in 1982. ENW completed WNP-2, at Hanford, and has two
partially completed plants—WNP-1 and WNP-4 at Hanford. Significant effort was put into determining
whether the two plants should be completed. WNP-4 has been put through a restoration process involving
the removal of equipment and materials and 28 of the 30 prefabricated buildings. Two other plants, WNP-
3 and WNP-5, at Satsop, Washington, were turned over to the Satsop Redevelopment Project. Currently,
BPA is paying for the upkeep of the two plants and is responsible for the restoration costs if alternative
uses cannot be found. If the sites are returned to brownfield status, the costs for the two sites could be as
high as $100 million. The WNP-1 site was 70 percent complete when construction was stopped on the
traditional large Gen II nuclear plant. WNP-1, referred to as Site 1 in this study (Case Study 2 and Case
Study 3), is now a potential site for SMRs because a significant amount of the construction and
infrastructure has already been completed (Miller 2013).
1.4 Report Contents and Organization
The ensuing sections of this report review the characteristics of nuclear power plants (Section 2.0), and
present information about and approaches to estimating LCOEs derived from reviewing related literature
(Section 3.0). The current energy market and projected electricity demand are discussed in Section 4.0.
The case studies analyzed to determine the feasibility of introducing SMRs to meet the goals of zero
carbon emissions are presented in Section 5.0, followed by discussion in Section 6.0 of firm and near-firm
renewable energy grid generation resources that may provide competition to SMR generation. Finally, the
results derived from the case studies that evaluated the NuScale SMR and GEH’s BWRX-300 are
analyzed in Section 7.0, and study conclusions are presented in Section 8.0. Appendix A contains related
questionnaires developed to estimate the LCOE for the SMRs.
Introduction 4PNNL-30225
2.0 Review of Nuclear Power Plant Characteristics
Flexible nuclear power technologies that have evolved in the past decade can provide significant
benefits—including characteristics that assist the electric grid in operating reliably and flexibly when
siting the technologies—when transitioning to the emerging clean energy market of tomorrow. Nuclear
power technology is one of the few carbon-free sources that can provide flexibility in deployment in
terms of total electrical output (from 1 MW to more than 1,000 MW depending on the design), and newer
technologies are free from many siting constraints associated with wind, solar, geothermal, and hydro
installations. Indeed, modern nuclear installations may not require emergency evacuation zones and some
technologies will discharge excess thermal energy to the air instead relying on water from a river or
another source.
This section summarizes SMR characteristics that are important for assuring smooth operation of the
electric grid.
2.1 Electrical Generating Characteristics Relevant to the Emerging
Clean Energy Market
The characteristics of flexible nuclear power summarized in this section support a range of electrical
distribution networks in assuring optimal, reliable, and efficient operation of the electrical grid. While
discussion here is relevant to electric grids of today, the emerging clean energy market of tomorrow will
drive innovation in the infrastructure toward new kinds of capable, flexible, and affordable generating
assets.1 From highly integrated and robust multi-gigawatt–scale electric distribution networks (such as
that operated by BPA) to isolated networks of the megawatt scale, integration of large amounts of
variable or intermittent generating sources in the electric distribution and consumption network requires
adaptable, flexible, and dispatchable generating (and energy storage) assets to make sure reliable on-
demand delivery of electricity is available to augment variable and intermittent sources.
Electric generating assets of the emerging market may require adaptability to local natural resources. For
example, the geographic location of a localized megawatt-scale electric network may not provide
adequate cooling water sources for operation of a traditional steam turbine/generator system to reject
excess heat through the steam cooling towers used by plants such as CGS. Or, environmental permits may
not be readily secured for a project. Or, there may be a large commercial facility, such as a paper mill,
that can use the residual thermal energy left over from electric generation.
Even when supporting today’s large BPA electric distribution network, the mixing and matching of
generating characteristics is necessary to make sure an electric grid functions on the hottest days and
coldest nights. This requires a mix of reliable and affordable baseload generation and dispatchable
generation that covers the daily and seasonal variations in electric consumption.
The challenges faced in operating the BPA electric distribution network are illustrated in Figure 2.1. The
figure illustrates the average monthly net load2 for 2019 and the average daily load in February 2019
1
A generating asset in this section refers to any system that can deliver net-positive usable electricity to the electric
grid at 60 Hz. Novel technologies may incorporate generation and storage capabilities for instance, but unlike an
electric (battery), pumped storage, or thermal energy storage asset, the generating asset is capable of net positive
contributions of power.
2
Net load represents loads within BPA's Balancing Authority and does not include loads transferred out of the
region or scheduled for use by customers with their own Balancing Authorities, such as Seattle and Tacoma.
Review of Nuclear Power Plant Characteristics 5PNNL-30225
using data obtained from BPA.1 As illustrated here, the average monthly load varied by over 2,100 MW
between February and September that year. And within the month of February, the average daily load
varied (coincidentally) by more than 2,100 MW. This variation in load is nearly equivalent to twice the
output of CGS. The challenge is further illustrated in Figure 2.2 which displays the BPA net load based
on 5-minute interpolated data for February 2 through 5 of 2019.2 Over this period of time, the change in
net load was 4,400 MW—which is four times the total output of CGS. Also shown in the figure is the
total wind generation for the days for which BPA is responsible for accounting. Note that Figure 4.3 (in
Section 4.2) shows the variation of electricity costs for the year—and an especially strong change in costs
during this time period.
12000 12000
10000 10000
Average BPA Load (MW)
Average BPA Load (MW)
8000 8000
6000 6000
4000 4000
2000 2000
0 0
Jan Feb Mar Apr May Jun Jul Aug Sep Oct Nov Dec 01 02 03 04 05 06 07 08 09 10 11 12 13 14 15 16 17 18 19 20 21 22 23 24 25 26 27 28
2019, Monthly February 2019, Daily
Figure 2.1. 2019 monthly and February 2019 daily average load on the BPA network.
During the timeframe depicted in Figure 2.2, wind only provided significant generation on February 3
when it generated the equivalent of 22,000 MWh of energy—which if stored and returned to the grid in
the future with 100 percent efficiency over a 24-hour period would represent 917 MW of continuously
delivered electricity throughout the future day.
1
See https://transmission.bpa.gov/business/operations/wind/ item “Data for BPA Balancing Authority Total Load,
Wind Gen, Wind Forecast, Hydro, Thermal, and Net Interchange.”
2
The dates represent the lead up to, and initial phase of, a significant winter storm in the Pacific Northwest.
Review of Nuclear Power Plant Characteristics 6PNNL-30225
12000
BPA Load Total Wind Generation
10000
8000
Power (MW)
6000
4000
2000
0
12:00 AM 12:00 PM 12:00 AM 12:00 PM 12:00 AM 12:00 PM 12:00 AM 12:00 PM 12:00 AM
February 2nd through 5th, 2019
Figure 2.2. Net load and total wind generation on select days.
The fundamental challenge to a modern electric grid is that electricity is ephemeral—there is currently no
affordable and large-scale capability to store 1,000s of megawatt-hour equivalents of energy generated in
one moment for future use. And this is the driver for innovation in flexible nuclear power technologies—
to deliver carbon-free infrastructure to deliver the capable, flexible, and affordable generating assets
needed for the emerging clean energy market of tomorrow.
Several generating characteristics summarized in the following sections are anticipated to be important to
the emerging electric generation network. The inherent value of a project is increased for a flexible
nuclear power generating asset if it incorporates any of these characteristics. However, “pricing-in” this
inherent value into a pure economic analysis is challenging (some examples are addressed later in this
document), especially for the innovations that will drive the emerging clean energy market of tomorrow
that has not yet arrived. See IAEA Nuclear Energy Series No. NP-T-3.23 for additional information in a
broader worldwide context (IAEA 2018).
2.1.1 Beyond Baseload
Baseload electric supply involves delivery of ultra-cheap electricity with uninterrupted performance over
a period of weeks and months. Generating assets delivering baseload electricity, such as the current fleet
of nuclear power plants and modern NGCC plants, are highly optimized with complex arrangements of
systems that maximize thermal efficiency1 for the cheapest attainable electric cost. And baseload units
may not function as efficiently at reduced power levels. Overall, the performance of these assets is
measured by the capacity factor, the percentage of time during the year that an asset generates power at
its rated power level. Increased costs associated with the complexity of baseload generating assets are
recovered by maximizing the capacity factor, and hence revenue through the near-continuous generation
of electricity.
1
Thermal efficiency is the efficiency of converting chemical or nuclear heat released from fuel into electricity. A
high efficiency means less fuel is consumed per unit of generated electricity.
Review of Nuclear Power Plant Characteristics 7You can also read