Edison international
2017 sustainability report
←
→
Page content transcription
If your browser does not render page correctly, please read the page content below
Edison international 2017 sustainability report

Introduction                 Leading the Transformation of   Operating with Excellence    Appendix
                                         the electric power industry

             4 CEO Letter                14 Leading the Transformation   33 Safety                    61 Global Reporting Initiative
                                                                                                         Content Index
             5 Company Overview          17 Clean Energy                 36 Customers & Communities
             8 Managing Sustainability   21 Efficient Electrification    45 Workforce
            10 2017 Sustainability       27 Grid of the Future           51 Governance & Ethics
               Scorecard
June 2018                                29 Customer Choice              55 Environment
Edison International
2017 Sustainability Report

                                                                46
Introduction
  CEO Letter

  Company Overview
                             Introduction
  Managing Sustainability
                             4 CEO Letter
  2017 Sustainability
  Scorecard                  5 Company Overview
                             8 Managing Sustainability

Leading the
transformation
of the Electric
Power Industry
                             10 2017 Sustainability Scorecard

                                                                 %
                                                                 carbon-free in 2017
                                                                 46% of the electricity that Southern
                                                                 California Edison delivered to
Operating                                                        customers in 2017 came from
With Excellence                                                  carbon-free resources.

Appendix

            3
Edison International
2017 Sustainability Report
CEO Letter
Introduction At Edison International, we are leading the transformation of the electric by 2030. Our “Clean Power and Electrification Pathway” calculates that,
power industry toward a clean energy future by focusing on opportunities to achieve this reduction at the lowest cost to the California economy,
CEO Letter
in clean energy, efficient electrification, the grid of the future, and we must have a robust, modern electric grid that is supplied by 80%
Company Overview
customer choice. As we pursue this vision, sustainability remains at the carbon-free energy and supports aggressive electrification of vehicles and
Managing Sustainability core of who we are and what we do. With roots dating back 130+ years, buildings. This is not just the right strategy for us— it is right for California
2017 Sustainability we know that our long-term success is based on delivering value to all of and for our country. We underscored this commitment to fighting climate
Scorecard our stakeholders, and we’re committed to doing well by making a positive change in 2017 by signing on to the “We Are Still In” campaign in support
impact and doing our part to respond to broader societal challenges, such of the Paris Climate Agreement.
as climate change.
Leading the Meeting the challenges and opportunities ahead is a big job, which is why
In 2017, our principal subsidiary, Southern California Edison, was named one of our top priorities is to foster an innovative and forward-thinking
transformation
Utility of the Year by Utility Dive and recognized for its leadership in energy work environment for our 12,000+ employees. Key to our success is
of the Electric storage, solar, and the use of innovative technology to modernize its aging embracing diversity and inclusion in all we do, and we are continuously
Power Industry grid. At our Edison Energy competitive business, we procured more than striving to make sure our workforce — and our leadership — reflects
400 megawatts of renewable energy for large commercial and industrial that commitment.
Operating customers and supported 17 of the Fortune 100 in aligning energy
Part of our commitment to diversity includes gender parity. We have
investments with their strategic and sustainability goals.
With Excellence endorsed two national initiatives focused on gender parity in compensation
2017 was also a year marked by natural disasters throughout the United practices and corporate leadership. As a company, we have also made
States, including right here in California. Our thoughts remain with those a commitment to stand united against workplace harassment. We
Appendix who lost loved ones and are recovering from the impact of the devastating established our own “We Stand Together” pledge, which sets the bar at
California wildfires. Wildfires have become larger and more frequent in zero tolerance for any form of abuse at our company.
California due to weather extremes caused by climate change. This poses
This report is part of the ongoing dialogue we strive to maintain
a major threat to all Californians, to our economy, and to achieving our
with our stakeholders. Please share your thoughts with us at
collective clean energy goals. We are working hard to make our operations
sustainability@edisonintl.com.
more resilient to the threat of climate change and have engaged with state
and federal officials to address this situation with urgency.
Given the impacts of climate change that we are already seeing, we believe
that our electric-led clean energy strategy is more important than ever.
Pedro J. Pizarro
Last October, we released a blueprint for achieving California’s ambitious
President and CEO, Edison international
mandate to reduce greenhouse gas emissions 40% below 1990 levels
4
Edison International
2017 Sustainability Report
                             Company Overview
Introduction
  CEO Letter

  Company Overview           At Edison International (NYSE:EIX), our vision is to lead the
  Managing Sustainability    transformation of the electric power industry toward a clean energy
  2017 Sustainability        future. Through our subsidiaries, we generate and distribute
  Scorecard
                             electric power, as well as provide energy services and technologies,
                             including renewable energy. Headquartered in Rosemead,
Leading the                  California, Edison International is the parent company of Southern
transformation               California Edison (SCE), one of the nation’s largest electric utilities.
of the Electric              Edison International is also the parent company of Edison Energy,
Power Industry               an independent advisory and services company with capabilities
                             to develop and integrate energy solutions for the largest energy
Operating                    users nationwide. Edison Energy is independent from SCE.
With Excellence
                             About This Report
Appendix                     This report reflects our sustainability strategy and 2017 sustainability performance and related
                             metrics. It is organized around the areas that are most important to the long-term success of our
                             business — leading the transformation of the electric power industry and operating our business
                             with excellence by focusing on customers, communities, and employees.

                             This report, which is an annual snapshot in time, references specific disclosures from the Global
                             Reporting Initiative’s (GRI) Standards, as well as disclosures from the GRI Electric Utility Sector
                             Supplement. Please see the complete GRI index and visit our website for the latest sustainability news.

                             We strive to be responsive to all of our stakeholders, including customers, communities, employees,
                             investors, suppliers, and regulators and legislators, and to be transparent and straightforward when
                             we discuss our sustainability performance. Your feedback informs our reporting. To share your
                             thoughts and suggestions, please contact us at sustainability@edisonintl.com.

            5
Edison International
2017 Sustainability Report
                             Our values
                             Our values of Safety, Integrity, Excellence, Respect, Continuous
                             Improvement, and Teamwork are the foundation of our work and the
                             principles that guide everything we do. Throughout our 130+ year history,
Introduction                 the character of our people has shaped our success and defined these
  CEO Letter                 values. Learn more about our commitment to upholding our values in our
  Company Overview
                             Employee Code of Conduct.

  Managing Sustainability

  2017 Sustainability
  Scorecard

Leading the
transformation
of the Electric
Power Industry
                                We live                                           We conduct our business with   We pursue

Operating
With Excellence                 Safety                                            integrity                      excellence
Appendix

                                                                                  We strive for

                                We treat everyone with                            continuous                     We recognize the strength of

            6
                                respect                                           improvement teamwork
To be massaged
Edison International
2017 Sustainability Report 2017 At a Glance UTILITY YEAR OF
THE
#
1 UTILITY
by industry publication for energy storage nationally1
Utility Dive
Introduction
Transition to a Clean Energy Future
CEO Letter
Company Overview
Managing Sustainability
2017 Sustainability
46%
Of the electricity that SCE
Edison electric institute
edison award
400 MW+
of off-site renewable
we are still in
Edison International joined other U.S.
Scorecard
delivered to customers came energy procurement businesses, universities, and state
for installing the world’s first
and local leaders in signing an open
from carbon-free resources. battery and gas turbine hybrid for Edison Energy customers letter to the international community
No coal in owned generation or system at two peaker sites
Leading the contracts for specified resources.
demonstrating support for the 2015
Paris Climate Agreement.
transformation
of the Electric Operations
Power Industry
Operating
With Excellence
50,000
Square miles
$
12.3B
Total operating revenue
80%+
of SCE power generation
118,000
Miles of distribution
of SCE service area across coastal, from third-party sources &transmission lines
central, and southern California 3,200 MW of owned generation.
Appendix
Customers, Communities & Employees
12,521
Full-time employees
$
21.8m
In Philanthropic funding
5m+
Customer accounts
3,574
Solar Installations
of Edison International and including $1.2 million in college covering SCE’s service area, connected on average per month
consolidated subsidiaries scholarships to 30 Edison Scholars which has 15 million residents
1
The Smart Electric Power Alliance ranked SCE Number 1 in energy storage in 2017 for adding more megawatts
7 (MW) of energy storage than any other utility based on a survey of more than 400 utilities across the nation.
Edison International
2017 Sustainability Report
                             Managing Sustainability
Introduction
  CEO Letter

  Company Overview           Sustainability is inseparable from our vision to lead the
                                                                                                         Our Material ESG Issues
  Managing Sustainability    transformation of the electric power industry toward a clean
  2017 Sustainability        energy future. From how we manage our operations, to                        Transition to a Clean Energy Future
  Scorecard
                             how we engage with our stakeholders, to how we deliver on                   Business Model                                  Renewable Energy & Distributed
                                                                                                                                                         Energy Resources
                                                                                                         Climate Change & Greenhouse Gas
                             our promise to provide safe, reliable, affordable, and clean                (GHG) Emissions                                 Service & Product Innovation
Leading the                  power — we are committed to doing our work with a long-                     Grid Modernization & Innovation                 Transportation Electrification
transformation               term view in mind. As a company with roots dating back to                   Local Air Quality
of the Electric              1886, we know that our success is tied to the strength and
Power Industry                                                                                           Operations & Governance
                             health of the communities that make up where we live and                    Cyber & Physical Security                       Infrastructure Reliability & Resilience
                             serve. We believe that we have a responsibility to make a                   Environmental Footprint                         Public Policy Engagement
Operating                    positive impact on society and are committed to doing our                   Governance, Transparency & Compliance           Water Use & Management
With Excellence
                             part to respond to broader societal challenges.
                                                                                                         Customers, Communities & Employees

Appendix                     Environmental, Social & Governance (ESG) Materiality
                                                                                                         Safety & Health                                 Customer Relations
                                                                                                         Affordability & Access                          Diversity & Inclusion
                             In order to identify the ESG topics that are fundamental to our long-term   Community Development                           Employee Engagement & Workforce
                             success, we recently completed an ESG materiality assessment in line                                                        Development

                             with best practice. The assessment, which included internal and external
                             stakeholder perspectives and was reviewed by the Edison International
                                                                                                             What is a material ESG issue?
                             Managing Committee, identified 19 ESG topics as priorities. Many of the         A “material” ESG issue is one that has the potential to impact long-term
                             topics relate to our strategy and core operations, and the results will         sustainability, based on the perspectives of internal and external stakeholders.
                             be an input into future strategic planning efforts. We recognize that the       This is different from, but related to, financial materiality, which is a threshold for
                             assessment reflects a single point in time and look forward to continuing       influencing the economic decisions of investors.
                                                                                                             Read the definitions of our material ESG issues.
                             engagement with our stakeholders on these issues.

            8
Edison International
2017 Sustainability Report
Esg oversight Building climate resilience
Incentives for Performance
At Edison, we are
Our annual also committed
incentives to making
for performance our operations
are based on financial, resilient to the
strategic, and
Our Board of Directors oversees climate change and other ESG risks
effectsoperational
of climategoalschange,
tied toincluding
key elementswildfires
of our of theenergy
clean magnitude andcore
vision and beyond
and opportunities as an integrated part of its oversight of the company’s operations,California
including many related to at ourthe
material ESG issues. The More
2017 goals
what Southern experienced end of 2017.Learn about
strategy. The Board’s oversight includes annual in-depth strategy meetings are summarized below; for more information, visit Edison International’s and
Introduction and regular updates from management on corporate sustainability issues
wildfires in the Strategy section. [This sentence needs review.] Since 2015,
SCE’s 2018 Joint Proxy Statement (pp. 34-37).
SCE has been involved in national efforts, partnering with the Department
CEO Letter such as energy and environmental legislation and regulation, risks arising
of Energy along with other utilities, to accelerate investment in technologies,
from climate-related activities, stakeholder engagement on climate change Goal Category Weight (%)
Company Overview practices, and policies that will enable a resilient 21st century energy system
and other ESG concerns, and corporate goals. Oversight of specific ESG-
Managing Sustainability to reduce climate-
Edison and weather-related vulnerabilities. SCE has completed
International
related issues is allocated among the Board’s four standing committees.
an initial analysis of our system using future climate models in order to
2017 Sustainability Financial Performance (Core earnings goal) 60
Scorecard Edison International’s Senior Vice President of Strategy and Corporate better understand how to prepare for changes in our environment. In 2018,
Development leads the development of our ESG strategy and periodically SCE plans to refine
Strategic the analysis
Initiatives andrelated
(Includes goals prepare an investment
to affordable customer plan to deal with 30
rates, business and clean energy strategy, transportation electrification,
briefs the Edison International Managing Committee on ESG risks and near-term severe weather events that are becoming increasingly intense, as
Edison Energy, safety, and other initiatives)
Leading the opportunities. In 2017, we formed a Sustainability Council, which includes well as long-term issues such as sea-level rise.
People and Culture (Includes goals related to diversity, employee 10
transformation a cross-functional group of company leaders to provide input into our ESG
engagement, and work environment)
of the Electric strategy and related activities.
Foundational Goals (Includes goals related to safety, compliance, and [Deduct only]
Power Industry system operations)
Reporting & Disclosure
Southern California Edison
Operating In 2017, we enhanced our voluntary ESG disclosure by reporting through
Financial Performance (Core earnings goal) 40
With Excellence a pilot program developed by the Edison Electric Institute (EEI), the
electric utility industry’s trade association, in collaboration with investors Safety (Includes goals related to response time and injury rate) 10
and member companies. The goal of the pilot is to provide investors and
Appendix other stakeholders with relevant, consistent, and easily accessible ESG Operational and Service Excellence (Includes goals related to
affordable customer rates, system reliability, customer satisfaction, and
20
data for electric utilities. Our report using the EEI template is available on other initiatives)
our website.1
Strategic Initiatives (Includes goals related to business and clean 20
energy strategy, transportation electrification, grid modernization, and
other initiatives)
People and Culture (Includes goals related to diversity, employee 10
engagement, and work environment)
Foundational Goals (Includes goals related to safety, compliance, and [Deduct only]
system operations)
1
Metrics included in the EEI template may differ from metrics included herein in order to conform to
the reporting requirements of the EEI template, which is industry-standardized.
9
Edison International
2017 Sustainability Report
2017 Sustainability Scorecard
Introduction
CEO Letter
2015 2016 2017
Company Overview
Company Overview Definitions
Managing Sustainability
Net Income (millions) $1,020 $1,311 $565 CO2e: Carbon dioxide equivalent
2017 Sustainability
Scorecard MWh: Megawatt-hour
Basic Earnings per Share $3.13 $4.02 $1.73
NOX: Nitrogen oxide
Total Operating Revenue (millions) $11,524 $11,869 $12,320
Scope 1: Emissions under direct
Leading the Total Assets (millions) $50,229 $51,319 $52,580 control of the company, including
transformation Total Annual Capital Expenditures (millions) $4,225 $3,734 $3,828
utility-owned generation, trans-
portation, SF6 from transmission
of the Electric and distribution equipment
Power Industry Number of Customer Accounts* 5,033,330 5,060,528 5,094,818 Scope 2: Indirect emissions re-
quired for business processes,
Number of Employees 12,777 12,390 12,521 including transmission losses and
facility energy use (electricity and
Operating Transition to a clean energy future natural gas)
With Excellence Renewables Portfolio Standard: Eligible Renewables (% of delivered electricity)* 24.3% 28.3% 31.6% Scope 3: Indirect emissions
released as a consequence of the
CO2e Emissions from Owned Electricity Rate (lbs/MWh)* 429 322 250 activities of the company including
Appendix CO2e Emissions from Delivered Electricity Rate (lbs/MWh)* 517 529 549
specified and unspecified power
purchases
SF6: Sulfur hexafluoride
Scope 1 Emissions (million metric tons CO2e)* 2.7 2.4 1.9
Scope 2 Emissions (million metric tons CO2e)* 1.7 1.6 1.3 *
All metrics reflect data associated
with Edison International and its
Scope 3 Emissions (million metric tons CO2e)* 18.1 20.6 16.6 consolidated subsidiaries, with
the exception of metrics denoted
by (*), which reflect SCE data only,
SF6 Emissions Rate*,** 0.4% 0.1% 1.1% and the "Community Investments"
metrics related to contributions
SF6 Emissions (million metric tons CO2e)*,** 0.04 0.02 0.13 to non-profit organizations by
employees and employee and retiree
volunteer hours, which reflect Edison
NOX Emissions Rate of Utility-Owned Generation (lbs/MWh)* 0.1 0.1 0.1 International and SCE data only.
**
In 2018, SCE revised SF6 data for
NOX Emissions from Power Generation (metric tons)* 179.4 157.7 153.5 prior years. The 2015 and 2016
values reflect these revised numbers.
10Edison International 2015 2016 2017
2017 Sustainability Report
SO2 Emissions Rate of Utility-Owned Generation (lbs/MWh)* 0.005 0.005 0.005 Definitions
SO2 Emissions from Power Generation (tons)* 13.9 11.8 8.9 CAIDI: Customer Average
Interruption Duration Index
Introduction Mercury Emissions (lbs/MWh)* 0 0 0
CAIFI: Customer Average
CEO Letter Interruption Frequency Index
Customer Energy Efficiency: GWh % of CPUC Goals*,** 155% 113% 128%
CPUC: California Public Utilities
Company Overview Customer Energy Efficiency: MW % of CPUC Goals*,** 107%
192% 127% Commission
Managing Sustainability GWh: Gigawatt-hour
Customer Energy Efficiency: MW*,** 307 286 292
2017 Sustainability NOV: Notice of Violation
Scorecard Percent of Active Customer Accounts with Smart Meters* 99.08% 99.11% 99.15%
SAIDI: System Average
Operations & Governance Interruption Duration Index
SAIFI: System Average
Leading the System Reliability: SAIFI (occurrences)* 0.86 0.99 0.87
Interruption Frequency Index
transformation System Reliability: SAIDI (minutes)* 100.15 109.98 91.72 SO2: Sulfur dioxide
of the Electric System Reliability: CAIDI (minutes)* 116.56 110.69 105.40
Power Industry
System Reliability: CAIFI (occurrences)* 1.70 1.79 1.04
*
All metrics reflect data associated
with Edison International and its
Board of Directors: Total Number of Directors 10 10 11
Operating consolidated subsidiaries, with the
exception of metrics denoted by (*),
With Excellence Board of Directors: Females as % of Directors 10% 30% 27% which reflect SCE data only, and the
“Community Investments” metrics
related to contributions to non-
Board of Directors: Diverse Background as % of Directors 30% 30% 45% profit organizations by employees
and employee and retiree volunteer
Appendix Environmental-Related Inspections with No NOVs Issued (% of total inspections)* 96% 97% 97% hours, which reflect Edison
International and SCE data only.
**
Customer Energy Efficiency for 2014,
Environmental-Related Settlements, Fines and Penalties* $600 $3,003,218 $21,137 2015, and 2016 was incorrectly
provided as 1,378 MW, 1,453 MW,
Number of Air Permit Non-Compliance Events with Fine* 1 2 3 and 1,408 MW, respectively, in last
year’s Scorecard. The correct data for
those years is 211 MW for 2014, 307
Number of Water Permit Non-Compliance Events with Fine* 0 2 1 MW for 2015, and 286 MW for 2016.
***
Amount of Hazardous Waste
Consumptive Water Use – Fossil Fuel Generation (million gallons)* 848 703 637 disposed (in tons) was incorrectly
provided in the initial publication
of this report and in past reports as
Amount of Hazardous Waste Disposed (tons)*,*** 8,992 16,939 9,035 8,909 tons, 16,827 tons, and 23,875
tons, respectively, for 2015, 2016, and
Habitat Protected, Enhanced or Restored that Supports Natural Habitat and 2017. The correct data for those years
2,808 3,206 3,906 is 8,992 tons for 2015, 16,939 tons for
Biodiversity as Required for Mitigation (acres)*
2016, and 9,035 tons for 2017.
11Edison International 2015 2016 2017
2017 Sustainability Report
Customers, Communities & Employees Definitions
Safety: Employee OSHA Recordable Rate 2.34 1.92 2.03 DART: Days Away, Restricted,
Transferred
Introduction Safety: Employee Lost Workday Case Rate 0.61 0.58 0.76
OSHA: Occupational Health and
CEO Letter Safety Administration
Safety: Employee DART Rate 0.93 0.80 0.97
Company Overview
Safety: Employee Fatalities 1 2 0
Managing Sustainability
Safety: Contractor OSHA Recordable Rate 1.68 0.89 0.71
2017 Sustainability
Scorecard Safety: Contractor DART Rate 1.14 0.66 0.37
Safety: Contractor Fatalities 1 2 0
Leading the Customer Satisfaction: J.D. Power & Associates Survey Results – Electric Residential
(out of possible score of 1000)*
676 682 726
transformation
Customer Satisfaction: J.D. Power & Associates Survey Results – Electric Business
of the Electric (out of possible score of 1000)*
678 763 759
Power Industry Women as % of Workforce 32% 30% 30%
Women as % of Management 23% 23% 24%
Operating
Women as % of Executives 30% 30% 27%
With Excellence
Diverse Background as % of Workforce 57% 57% 57%
Appendix Diverse Background as % of Management 44% 45% 47%
Diverse Background as % of Executives 29% 31%** 29% *
All metrics reflect data associated
with Edison International and its
Supplier Diversity Spend (billions)* $1.83 $1.68 $1.72 consolidated subsidiaries, with
the exception of metrics denoted
by (*), which reflect SCE data only,
Supplier Diversity Spend Rate* 42.9% 44.7% 43.9% and the “Community Investments”
metrics related to contributions
Community Investments: Pre-Tax Earnings from Operations (millions) $20.0 $20.0 $21.8 to non-profit organizations by
employees and employee and retiree
Community Investments: Contributions to Nonprofit Organizations by volunteer hours, which reflect Edison
$2.4 $2.1 $2.3 International and SCE data only.
Employees (millions) **
Diverse Background as % of
Executives for 2016 was incorrectly
Community Investments: Employee and Retiree Volunteer Hours 168,733 143,675 134,319 provided as 30% in last year’s
Scorecard. The correct figure is 31%.
12Edison International
2017 Sustainability Report
Introduction
Leading the
Leading the
transformation
of the Electric transformation of the
Electric Power Industry
Power Industry
Leading the
Transformation
Clean Energy
Efficient Electrification
14 Leading the Transformation
Grid of the Future
Customer Choice 17 Clean Energy
21 Efficient Electrification
Operating 27 Grid of the Future
With Excellence 29 Customer Choice
Appendix
eV charge ports installed through Charge Ready pilot in 2017
~1,250 electric vehicle (EV) charge ports will be installed when pilot complete
13Edison International
2017 Sustainability Report
Leading the Transformation
Introduction
Our vision is to lead the transformation of the electric
Leading the
transformation power industry, focusing on opportunities in clean energy,
California’s GHG Emissions Reduction goals*
of the Electric efficient electrification, the grid of the future, and
Getting to a 40% reduction in GHG emissions in a short 12 years is no small
Power Industry customer choice to strengthen and grow our business. feat. For context, California has reduced GHG emissions just 9% from their peak
in 2004. Meeting 2030 and 2050 GHG emissions reduction goals will require
Leading the With 130+ years of innovation in our history, Edison
reductions at more than three times the annual rate achieved between 2004 and
Transformation
International is well-positioned and prepared for the work 2015 — equivalent to eliminating emissions from 2.6 million homes each year.
Clean Energy
that lies ahead.
Efficient Electrification
Grid of the Future
Our Strategy 440
Customer Choice
At Edison International, we are advancing our vision by growing our
431 1990 levels CO2e Million Metric Tons
business toward a clean energy future, striving for best-in-class operations,
and providing superior value to our customers and shareholders.
Operating
Our principal subsidiary, SCE, is focused on priorities such as cleaning
With Excellence the power system, helping customers make cleaner energy choices,
258
strengthening and modernizing the grid, and achieving operational and 40% below 1990 levels
Appendix service excellence. At Edison Energy, we are helping the nation’s largest
energy users simultaneously reduce their energy costs, improve the
environmental performance of their operations, ensure energy resiliency,
and manage exposure to energy price risk.
86
Limiting global warming to 2 degrees Celsius 80% below 1990 levels
Through our clean energy-led strategy, we look to partner with California 1990 2015 2030 2050
to achieve ambitious climate change and air quality goals. California’s
climate change goals include a 40% reduction in GHG emissions from
Source: California Air Resources Board (CARB)
1990 levels by 2030 and an 80% reduction by 2050. These science-based
*
goals are consistent with the 2015 Paris Climate Agreement to limit global
14Edison International warming to no more than 2 degrees Celsius over pre-industrial levels. In
2017 Sustainability Report addition, California’s air quality goals include a 90% reduction in emissions
of nitrogen oxides from 2010 levels in some of the state’s most polluted 2015 California GHG Emissions By Sector*
areas by 2032.
Introduction In June 2017, we declared that “We Are Still In,” joining other U.S. businesses, Agriculture
universities, and state and local leaders in signing an open letter to the Residential
& Commercial
international community demonstrating support for the 2015 Paris 8%
Leading the Climate Agreement. 11 %
transformation Transportation
of the Electric Our industry’s role 39 %
Power Industry The electric power sector has already made significant headway in
reducing its GHG emissions, which are down 24% since 1990, and we are 19 % Electric Power
Leading the
prepared for the work that lies ahead. We cannot do it alone, however.
Transformation
This shift requires a collaborative effort across the California economy.
Clean Energy 6% 17%
Today, the electric power sector accounts for only 19% of California’s GHG
Efficient Electrification
emissions. The transportation sector (including fuel refining) and fossil Transportation-Related
Grid of the Future Industrial
fuels used in space and water heating now produce almost three times as Industrial
Customer Choice many GHG emissions as the electric sector1 and more than 80% of the air
*
Source: California Air Resources Board (CARB)
pollution in California. With the size, scope, and infrastructure assets to
deliver clean energy and support electrification for all customers, electric
Operating utilities are uniquely positioned to facilitate the transformation to a clean
With Excellence energy economy. respectively — and finds the most cost-effective and feasible path to 2030
is the electricity-based path, which includes:
Mapping a path forward
Appendix In late 2017, SCE published the “Clean Power and Electrification Pathway: • Decarbonizing the electric sector through an electric grid supplied by
Realizing California’s Environmental Goals” white paper. Aligned with our 80% carbon-free energy;
vision and strategy, it outlines a path for California to meet its climate
• Electrifying the transportation sector, including having approximately 7
change goals and to significantly reduce today’s health-harming air pollution
million light-duty and 200,000 medium- and heavy-duty electric vehicles
in local communities — and especially in disadvantaged communities.2
(EVs) on California roads; and
The Pathway analysis compares three different scenarios — led primarily
• Electrifying buildings, using electricity to power nearly one-third of space
by expanded use of renewable natural gas, hydrogen, and electricity,
and water heaters in increasingly energy-efficient buildings.
1
Approximately 82% of emissions from the residential and commercial sectors are due to space and
water heating. This integrated multi-sector approach builds upon existing California
2
“Disadvantaged communities” is a definition that the state of California uses to indicate those policy and has the support of many parties, including the International
communities that are most heavily impacted by pollution from multiple sources and most vulnerable
15 to its effects. Brotherhood of Electrical Workers (IBEW) Local 47.Edison International Efforts to reduce GHG emissions are
2017 Sustainability Report embraced by a majority of Californians,
including many of our customers.
Findings from the Public Policy Institute of
Introduction California’s “Statewide Survey: Californians
& the Environment,” released in July 2017,
show that “[s]trong majorities of California
Leading the adults (72%) and likely voters (66%) favor
transformation the state law … that requires the state to
reduce [GHG] emissions …. ”3
of the Electric
Power Industry Public policy engagement
Leading the
Broad decarbonization and electrification
Transformation of the economy require comprehensive
Clean Energy
legislation and regulation. We partner with
local, state, and national organizations
Efficient Electrification
and leaders to develop policies that are
Edison International President & CEO Pedro Pizarro attending the signing ceremony for the bill that extends California’s cap-and-trade program (AB 398).
Grid of the Future feasible and have the best interests of our
Customer Choice customers in mind.
and the other programs and investments that are part of our commitment
In mid-2017, California Governor Jerry Brown signed a bill into law extending
to a building a clean energy future are discussed throughout this section
California’s cap-and-trade program (AB 398), as well as a companion bill
Operating to protect communities from air pollution (AB 617). We were proud to
of the report.
With Excellence participate actively with California leaders in informing and advocating
for both pieces of legislation. The laws continue one of California’s key Providing thought leadership]
Appendix programs for reducing GHG emissions, while also protecting customers Sound public policy relies on good data and insightful analysis. We have developed
from associated costs, and set into motion a statewide strategy to reduce data-driven strategies to build a clean energy future:
toxic air pollutants in highly impacted communities.
• “The Clean Power and Electrification Pathway: Realizing California’s Environmental
During 2017, we also engaged with stakeholders, including environmental Goals” sets out a multi-sector approach to meet California’s climate change and air
quality goals.
groups, local communities, and labor, to develop and advance our clean
energy and electrification strategy. The stakeholder support for SCE’s plan • “Transportation Electrification: Reducing Emissions, Driving Innovation” outlines steps
to invest in medium- and heavy-duty EV charging infrastructure was so needed to electrify California’s transportation sector.
robust that a California Public Utilities Commission (CPUC) commissioner • “The Emerging Clean Energy Economy: Customer-Driven. Modernized. Reliable.”
recognized the coalition as a model other utilities should follow. This plan makes the case for grid modernization.
16
3
See p. 3.Edison International
2017 Sustainability Report
Clean Energy
Introduction
One of the key focus areas of our strategy is clean energy
Leading the
transformation — and we believe that a clean energy future starts with Average GHG emissions per unit of electricity provided
of the Electric clean electricity. That’s why we’re charting a path toward Metric tons of carbon dioxide equivalent (CO2e) per megawatt-hour (MWh)
Power Industry an 80% carbon-free electricity supply supported by energy
Leading the storage and investing in a modern grid equipped to deliver
Transformation
higher levels of intermittent renewable resources, such Environmental Protection
Clean Energy Agency’s U.S. estimate 0.45
as wind and solar. We’re also helping the largest energy
Efficient Electrification
users nationwide meet their renewable energy goals.
Grid of the Future SCE portfolio estimate
In 2017, 46% of electricity that SCE delivered to customers came from (utility-owned generation and 0.25
Customer Choice purchased power)
carbon-free resources,4 more than halfway to the 80% we estimate is
needed by 2030 to meet California’s climate change goals. This included
Operating 32% from eligible renewable resources, which help to meet California’s
Renewables Portfolio Standard requirements.5 In 2017, SCE power
With Excellence
producers emitted only about half of the GHG per unit of electricity
provided to customers compared to the estimated U.S. average (see SCE plans to submit an integrated resource plan (IRP) to the CPUC in 2018,
Appendix chart). SCE was also a leader in solar, adding 547.1 MW to the grid in 2017.6 reflecting its vision for the best path forward to decarbonize California.
SCE’s IRP will include multiple measures to provide a cleaner energy supply,
4
This does not include rooftop solar, which we estimate provided an additional 4% carbon-free energy including increasing the procurement of eligible renewables and other
reducing SCE’s energy requirement.
carbon-free resources.
5
Eligible renewable resources are defined by statute and the California Energy Commission. Retail
sellers of electricity in California, including investor-owned utilities, electricity service providers, and
community choice aggregators, and publicly owned utilities are required to serve 33% of their load At Edison Energy, we procured more than 400 MW of offsite renewable
with eligible renewables by 2020 and 50% by 2030.
6
In 2017, SCE ranked second in the nation in terms of MW of solar added compared to more than 400
energy for some of the nation’s largest energy users in 2017. In corporate
utilities that participated in the Smart Electric Power Alliance’s 11th Annual Utility Market Survey. SCE renewable energy purchasing alone, Edison Energy has advised customers
has placed among the top 10 utilities for solar every year since the alliance began publishing its solar
rankings in 2007. on more than 2.1 GW of wind and solar transactions in total through 2017.
17Edison International
2017 Sustainability Report SCE’s 2017 Energy Mix to Customers
Introduction
1% 1%
Carbon-Free 2017 TOTAL
9% 7% 8%
(Eligible Renewables)
Leading the 1%
Biomass & Waste
transformation 7% 10% Geothermal
of the Electric 13 %
Eligible Hydroelectric 32%
Power Industry 8% Solar
Leading the
10% Wind
Transformation
2% 10%
6% 6% Other Carbon-Free 2017 TOTAL
Clean Energy
Large Hydro
Efficient Electrification
6% 8%
Nuclear
Grid of the Future
6%
Customer Choice 14%
41%
Operating
Fossil Fuels/Other
With Excellence 41%
2017 TOTAL
34% Unspecified*
Natural Gas
Appendix
54%
*
Unspecified power refers to electricity that is not
traceable to a specific generating facility, such as
electricity traded through open market transactions
26% administered by the California Independent System
19 % 20% Operator (CAISO). The power is typically a mix
of resources, largely dominated by natural gas
and renewables. The generating resources in the
CAISO market are getting cleaner as more and
more renewables are added to the grid in line with
2015 2016 2017 California state law.
18Edison International
2017 Sustainability Report
Energy storage
New energy storage options are part of our plan to operate a flexible grid
that takes advantage of clean, renewable resources. As more renewable
resources come online, batteries can help smooth out the fluctuations
Introduction in these resources by storing the energy that the resources generate and
supplying it to the grid later when the sun isn’t shining or the wind isn’t
blowing. Energy storage enables greater use of clean energy technologies
Leading the and, over time, could offset traditional ways of meeting increased energy
transformation demand, such as building new power generation stations.
of the Electric
Power Industry SCE plans to connect up to 747 MW of energy storage to the grid by
2024. At the end of 2017, SCE had nearly 500 MW of energy storage
Leading the
under contract. These projects have included SCE installations, projects
Transformation
developed in collaboration with other companies, procurements from
Clean Energy
other battery storage developers, and demonstration projects.
Efficient Electrification
To continue this progress and broaden the use of energy storage, SCE filed
Grid of the Future
its 2018 Energy Storage Procurement and Investment Plan with the CPUC.
Customer Choice The plan requested authorization to build 40 MW of utility-owned storage.
It also proposed a $9.8 million customer incentive program to expand the
benefits of energy storage to low-income customers who are already part
Operating of SCE’s multifamily solar programs. The proposal would incentivize the
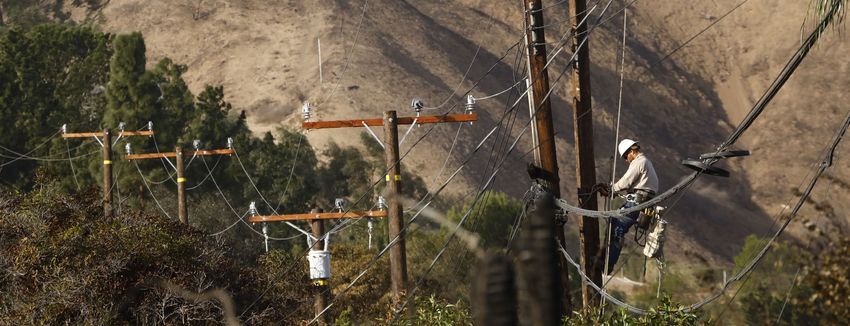
Lithium-ion batteries operating as part of the Hybrid Enhanced Gas Turbine system at the Center Peaker
With Excellence owners of qualified solar-equipped multifamily buildings to install energy Plant in Norwalk, California.
storage systems. This would help reduce peak demand on the grid while
also helping building owners and their tenants save money by using on-
Appendix site stored energy during peak rate periods. Helping customers meet their renewable energy goals
Edison Energy works with large customers across the nation to help them reduce
their carbon footprints, better manage their energy costs and risks, improve
SCE is a national leader in Energy Storage resiliency, and reach their sustainability goals.
In 2017, the Smart Electric Power Alliance ranked SCE Number 1 in energy storage for
Edison Energy takes a data-driven, analytic approach to energy contracting
adding more MW of energy storage than any other utility nationally based on a survey
and capital decisions with the specific goal of protecting shareholder value and
of more than 400 utilities. SCE’s leadership in energy storage was also noted when SCE
generating competitive advantage. By aligning energy investments with customers’
President Ron Nichols received Energy Storage North America’s Champion Award in
strategic business and sustainability goals, Edison Energy helps them improve
2017. The award recognizes individuals from the utility and policy sectors who have
their competitive position and mitigate energy risk resulting from complex energy
demonstrated significant leadership in advancing the role of energy storage to achieve
policies, technological advancements, and new products.
a cleaner, more reliable, and more resilient energy grid. SCE’s Hybrid Enhanced Gas
Turbine Project was also honored (see next page).
19Edison International
2017 Sustainability Report
Introduction
Leading the
transformation
of the Electric
Power Industry
Leading the
Transformation
Clean Energy
Efficient Electrification
Grid of the Future
Customer Choice
SCE’s Hybrid Enhanced Gas Turbine Project
Operating
With Excellence Hybrid cars have long been a popular choice for drivers The system is called the Hybrid Enhanced Gas Turbine feature improves the ability to integrate renewable
because they combine a gas engine and an electric System, or Hybrid EGT, and results from a partnership power onto the grid because it can instantly step in
motor, saving fuel and reducing GHG emissions. between SCE, General Electric, and Wellhead when the wind or sun no longer meets system needs.
Power Solutions. The hybrid system reduces by half the number of times
Appendix Now, a similar hybrid technology is being used for the peaker plant needs to be restarted, thus reducing
the first time at two existing SCE peaker7 plants in the The hybrid system, which went online March 30, 2017, GHG emissions by as much as 60% and helping to
Southern California communities of Norwalk and Rancho combines three major enhancements to SCE’s existing improve air quality. Reducing the number of restarts
Cucamonga. Like a hybrid vehicle, an advanced lithium- peaker plants: a battery energy storage system, an helps reduce operating costs and extends the life of the
ion battery provides energy to the grid immediately, upgraded emissions control system, and a groundbreaking equipment, saving money for SCE customers.
allowing time for the gas turbine to ramp up and take operating system.
over, if needed. The battery is later recharged. The two peaker plants also meet California’s strict
The 10-MW battery storage system, combined with the environmental requirements by reducing overall
gas turbine, allows the peaker plant to more quickly water consumption. The Hybrid EGT has an optimized
respond to changing energy needs, thus increasing the emissions control system that reduces the peaker’s
7
Peaker plants are smaller power plants — typically 100 MW or
less — that are often used to serve the periods of high demand reliability of the electrical grid. The system is available water by approximately 45%. Each plant will save about
on the grid due to their quick start, fast ramping characteristics. 24 hours a day, seven days a week, providing spinning
These peakers are being called on more often to balance out the 2 million gallons of water.
variability caused by the increased use of clean energy resources. reserves even while the gas turbine is offline. This
20Edison International
2017 Sustainability Report
Efficient Electrification
Introduction
Efficient electrification is another strategic focus area for us,
Leading the
transformation because we know that clean electricity powering efficient National Efforts to Further Electrification
Edison International President and CEO Pedro Pizarro is the chair of the EPRI Board of
of the Electric electric end uses in mobility, heating and cooling, and new
Directors Efficient Electrification Working Group and the co-chair of Edison Electric
Power Industry applications like indoor agriculture is one of the keys to Institute’s CEO EV Task Force. Both efforts have brought together stakeholders
from across the country to further electrification. The EPRI working group is
Leading the a clean energy future. That’s why we’re taking a leading developing an analytical framework that identifies technologies and develops
Transformation
role to advance efficient electrification in California and strategies to provide customers with cleaner, more efficient energy options. The
Clean Energy EEI task force is developing an approach that all investor-owned utilities can use
nationally, through cross-sector partnerships, advocacy, to develop programs and investments in transportation electrification, specifically.
Efficient Electrification By working with our peers, we hope to lay the foundation for the nationwide effort
analytical work, customer incentives, and investments.
Grid of the Future required to achieve significant electrification and all the benefits it entails.
The Electric Power Research Institute (EPRI) released its U.S. National
Customer Choice
Electrification Assessment in April 2018 highlighting the potential for
efficient electrification to create value for customers and society. Across resources to its power supply, electric fuel will become cleaner and more
Operating a range of assumptions, efficiency gains from the application of electric effective at reducing GHG emissions and smog-forming air pollution.
technologies led to reductions in emissions, and also had the potential to
With Excellence While ownership and use of passenger EVs is increasing in California,10
reduce water use, increase grid flexibility, and increase productivity and
the transition to passenger EVs is not happening fast enough to achieve
product quality.8
the substantial increase necessary to meet climate change goals.
Appendix Electrification of mass transit, and delivery and freight transportation is
The Electric Vehicle (EV) Future even further behind.
The transportation sector, which represents over 40% of our nation’s
We are working on many fronts to accelerate the ownership and use of
energy consumption (predominantly through combustion of liquid fuels),
EVs in California and nationally. Not only are we are involved with our
is the sector of the economy that represents the largest opportunity
cross-sector partners in shaping policies to further electrification, we
for efficient electrification.9 Switching to electric fueling reduces GHG
are also investing in charging infrastructure and incentives to help SCE
emissions by more than 80% when compared to fueling a gasoline or
customers make the switch and to serve as a model for our peers.
diesel-powered vehicle in SCE’s service area. As SCE adds more carbon-free
10
In 2017, roughly 5% of new car sales were EVs or plug-in hybrid electric vehicles (PHEVs) in California.
8
EPRI, U.S. National Electrification Assessment, April 3, 2018, p. 5.
Findings from AAA: 1-in-5 U.S. Drivers Want an Electric Vehicle, released in early May 2018, found that
21
9
EPRI, U.S. National Electrification Assessment, April 3, 2018, p. 27. 20% of Americans are considering an EV for their next vehicle purchase.Edison International Expanding light-duty EV charging infrastructure
2017 Sustainability Report SCE’s $22 million Charge Ready Pilot launched in 2016 to accelerate the
Charge ready Pilot
installation of EV charging stations for light-duty vehicles. With a goal of
installing 1,250 EV charge ports across our service area, we collaborated Multi-unit dwelling
Introduction with cities, employers, apartment and condo complex owners, business
Fleet
(such as apartment buildings)
site owners, campuses, and other locations where people park their cars
for four hours or more. The pilot is particularly focused on disadvantaged
Leading the communities disproportionately affected by pollution from gasoline- and
6%
4%
transformation diesel-powered vehicles and with low EV adoption rates.
of the Electric SCE installs and pays all costs associated with the infrastructure to serve EV
Destination
Power Industry charging stations and will continue to own and maintain that infrastructure. fleet centers
Charge Ready customers procure, install, and maintain the EV charging (such as Market segments of
Leading the 26 %
Transformation
Clean Energy
stations and are responsible for electrical energy and networking costs,
but also receive rebates to reduce the equipment and installation costs.
sports arenas
and malls) installed
Efficient Electrification In April 2018, SCE filed a report with the CPUC on the results and findings
Stations
in 2017 64 %
Grid of the Future
of the Charge Ready Pilot.
Workplace
Customer Choice Based on what we have learned, in 2018, SCE plans to apply for CPUC
approval of an expanded program with additional investment in light-duty
EV charging infrastructure.
Operating
With Excellence
Clean fuel rewards Program 2017 highlights
Through California’s Low Carbon Fuel Standards Program, which the California
Appendix
52 50% 803
Air Resources Board (CARB) adopted in 2009 to reduce the carbon intensity of
transportation fuel, SCE is offering a $450 reward to customers who drive EVs or PHEVs.
This includes new, used, and leased vehicles. We believe that making the second and
third owners of a vehicle eligible for a rebate will help stimulate the market for used
vehicles and encourage even more customers to drive EVs. sites completed of ports completed or in charge ports
progress were located within installed
disadvantaged communities
22Edison International Investing in medium- and heavy-duty EV charging infrastructure commercial and industrial vehicles. Accelerating EV ownership and use in
2017 Sustainability Report In 2018, SCE received approval of a plan to accelerate the expansion of this important industry will not only reduce GHG emissions but will also
electric transportation ownership and use, particularly for customers clean the air in local transit corridors, improving the lives of the many SCE
with medium- and heavy-duty vehicles. The approved plan includes $242 customers who live and work in these areas.
Introduction million in capital investments over five years to install infrastructure to
We believe that this investment will also get California closer to the
support more than 8,000 medium- and heavy-duty EVs. SCE has additional
approximately 7 million light-duty and 200,000 medium- and heavy-duty
funding for four infrastructure pilot projects (described on the next page).
EVs we project it needs to meet its 2030 climate change goals.
Leading the To help commercial customers make the switch to EVs, SCE also received
transformation approval for a new rate design.
of the Electric The plan, which is laid out in the “Transportation Electrification: Reducing Electric Buses
Power Industry Emissions, Driving Innovation” white paper, is tailored to Southern Edison International believes in the future of electrification for all types of vehicles, which
California, where 40% of the goods entering the nation are moved is why we invested in Proterra, a leader in the design and manufacture of zero-emission
Leading the
electric buses. In 2017, Proterra opened a manufacturing facility in Southern California,
Transformation through the region’s ports and over its highways and railways. While
supporting the local economy. In parallel, SCE has been working with transportation
Clean Energy
important to the state and local economy, the goods movement industry agencies throughout its service area to support their electrification goals, including
is a major source of GHG emissions and air pollution from heavy-duty developing the charging infrastructure needed to connect electric buses to the grid.
Efficient Electrification
Grid of the Future
Customer Choice
Electric Transportation Plays a Key Role in Reaching California’s Climate Change & Air Quality Goals*
Operating
With Excellence Electrifying Removal of
Appendix
24%
cars & light trucks
+ 15%
medium-duty trucks & vans
+ 6%
heavy-duty trucks & buses
= 17k
tons of NOX
& 58m
metric tons of GHG emissions
(7 million total) (180,000 total) (22,000 total)
*
Source: Clean Power
and Electrification
Pathway: Realizing
California’s
Environmental Goals
23Edison International
2017 Sustainability Report 2018 electric transportation pilot projects
Introduction
Leading the
transformation
of the Electric
Power Industry
Leading the
Transformation
Clean Energy
Efficient Electrification
Transit Bus Electrification Port Electrification
Grid of the Future
Fossil-fuel powered buses are a significant Pilots at the Port of Long Beach
Customer Choice source of urban air pollution. This pilot, designed will provide infrastructure to
for government transit agencies, will fund the electrify cranes and tractors
infrastructure cost of installing up to 20 electric used to move containers from
Operating charge ports at bus yards. The pilot will focus
on cleaning the air in underserved communities
ships to trucks and railcars.
Learn more on next page.
With Excellence that are disproportionately impacted by pollution
from buses.
Appendix Residential Urban Fast Chargers
Charging Rebate Although fast chargers can reduce charging times
One barrier to greater to as little as 30 minutes, few of these chargers
ownership and use of are commercially available. SCE will work with
personal EVs is the cost and program participants to install up to 50
inconvenience of installing fast-charge ports at sites accessible
home chargers. This pilot to all drivers to promote fast
will offer rebates to qualified charging and expand adoption
residential customers to of personal EVs.
install the wiring for home EV
chargers.
24Edison International
2017 Sustainability Report
Introduction
Leading the
transformation
of the Electric
Power Industry
Leading the
Transformation
Clean Energy
Efficient Electrification
Grid of the Future
Customer Choice
Operating
With Excellence
Port of Long Beach
Appendix The Port of Long Beach is partnering with SCE on a $3.5 convert the cranes to all-electric, purchase 12 battery-
million electrification pilot project. SCE’s role is to install electric yard tractors for two terminals, and convert four Expected project outcomes
electrical infrastructure supporting the conversion of underpowered Class 8, liquefied natural gas trucks into
diesel-powered gantry cranes to all-electric. The giant,
rubber-tired cranes are used to load and unload cargo.
In addition, at a separate terminal, SCE will install the
plug-in hybrid-electric trucks.
Overall, the project is expected to reduce GHG emissions
1,323 tons of GHG reduced yearly
by more than 1,323 tons and smog-causing nitrogen
27
infrastructure to power charging stations for new
oxides (NOX) by 27 tons each year. The switch to zero-
battery-electric yard tractors. tons of NOX reduced yearly
emissions equipment is expected to save more than
To support the Port of Long Beach’s financial 270,000 gallons of diesel fuel. Officials hope it will
25
commitment to the project, the California Energy
Commission awarded the Port a $9.7 million grant to
become a model for ports around the world.
270,000 gallons of diesel fuel savedEdison International
2017 Sustainability Report
Building electrification
Residential and commercial buildings
account for 30% of energy consumption
nationally. Building space heating is
Introduction second only to passenger vehicles in
terms of end-use energy consumption
and the opportunity for efficient
Leading the electrification.11 Building water heating
transformation is also an opportunity. At SCE, we are
of the Electric helping our customers reduce the energy/
Power Industry GHG footprints of their facilities through
Leading the partnerships and education. We are
Transformation particularly focused on helping customers
Clean Energy pursue zero net energy (ZNE) homes, or
homes which generate at least as much
Efficient Electrification
energy as they consume on an annual
Grid of the Future basis. Efficiencies achieved through
Customer Choice electrification can play a major role in a
ZNE home. Starting in 2020, most new
A new interactive display at SCE’s Energy Education Center teaches customers about high performance building envelopes, a major part of a ZNE home.
homes built in California will need to
Operating include solar, which will be a significant
With Excellence stride towards California’s goal to make all new homes ZNE.
In 2017, SCE partnered with Green Home Builder magazine and Habitat for SCE’s Energy Education Center in Irwindale also offers customers a
Appendix Humanity of Orange County to construct and donate an all-electric, ZNE “hands-on” learning experience around high-performance building
home to a veteran and his family in Orange County, California. The home, envelopes,12 which are a major part of ZNE homes and often one of the
which features the latest in all-electric, energy-efficient technology from hardest concepts to teach. The new interactive display, which opened
a solar roof to special foam insulation, provides a preview of homes to in April 2018, teaches customers how to comply with the existing and
come under the new rules and gives SCE the ability to monitor the home’s future building codes by allowing them to view and touch each individual
electricity usage over the next two years using remote energy-monitoring construction layer of high-performance walls and attics, learning what it
technology. The lessons learned will be shared with builders and takes to achieve ZNE.
developers making their transition to ZNE and all-electric construction.
12
High-performance building envelopes, which physically separate interior and exterior spaces, are
11
EPRI, U.S. National Electrification Assessment, April 3, 2018, p. 31. designed and constructed to significantly reduce heat and air transfer into and out of buildings.
26You can also read