2017 Wind Technologies Market Report - Department of Energy
←
→
Page content transcription
If your browser does not render page correctly, please read the page content below
2017 Wind Technologies Market Report

This report is being disseminated by the U.S. Department of Energy (DOE). As such, this document was prepared
in compliance with Section 515 of the Treasury and General Government Appropriations Act for fiscal year
2001 (public law 106-554) and information quality guidelines issued by DOE. Though this report does not
constitute “influential” information, as that term is defined in DOE’s information quality guidelines or the Office
of Management and Budget’s Information Quality Bulletin for Peer Review, the study was reviewed both
internally and externally prior to publication. For purposes of external review, the study benefited from the
advice and comments of 12 industry stakeholders, U.S. Government employees, and national laboratory staff.

NOTICE
This report was prepared as an account of work sponsored by an agency of the United States government. Neither
the United States government nor any agency thereof, nor any of their employees, makes any warranty, express
or implied, or assumes any legal liability or responsibility for the accuracy, completeness, or usefulness of any
information, apparatus, product, or process disclosed, or represents that its use would not infringe privately
owned rights. Reference herein to any specific commercial product, process, or service by trade name, trademark,
manufacturer, or otherwise does not necessarily constitute or imply its endorsement, recommendation, or
favoring by the United States government or any agency thereof. The views and opinions of authors expressed
herein do not necessarily state or reflect those of the United States government or any agency thereof.

      Available electronically at SciTech Connect: http://www.osti.gov/scitech

      Available for a processing fee to U.S. Department of Energy
      and its contractors, in paper, from:
      U.S. Department of Energy
      Office of Scientific and Technical Information
      P.O. Box 62
      Oak Ridge, TN 37831-0062
      OSTI: http://www.osti.gov
      Phone: 865.576.8401
      Fax: 865.576.5728
      Email: reports@osti.gov

      Available for sale to the public, in paper, from:
      U.S. Department of Commerce
      National Technical Information Service
      5301 Shawnee Road
      Alexandria, VA 22312
      NTIS: http://www.ntis.gov
      Phone: 800.553.6847 or 703.605.6000
      Fax: 703.605.6900
      Email: orders@ntis.gov

                                                          ii
2017 Wind Technologies Market Report

Preparation and Authorship
This report was prepared for the Wind Energy Technologies Office within the U.S. Department of Energy’s
Office of Energy Efficiency and Renewable Energy.

Primary authors of the report are: Ryan Wiser and Mark Bolinger, Lawrence Berkeley National Laboratory

Contributing authors include: Galen Barbose, Naïm Darghouth, Ben Hoen, Andrew Mills, Joe Rand, and
Dev Millstein (Lawrence Berkeley National Laboratory); Kevin Porter, Katherine Fisher, and Nicholas Disanti
(Exeter Associates); and Frank Oteri (National Renewable Energy Laboratory)

                                                     iii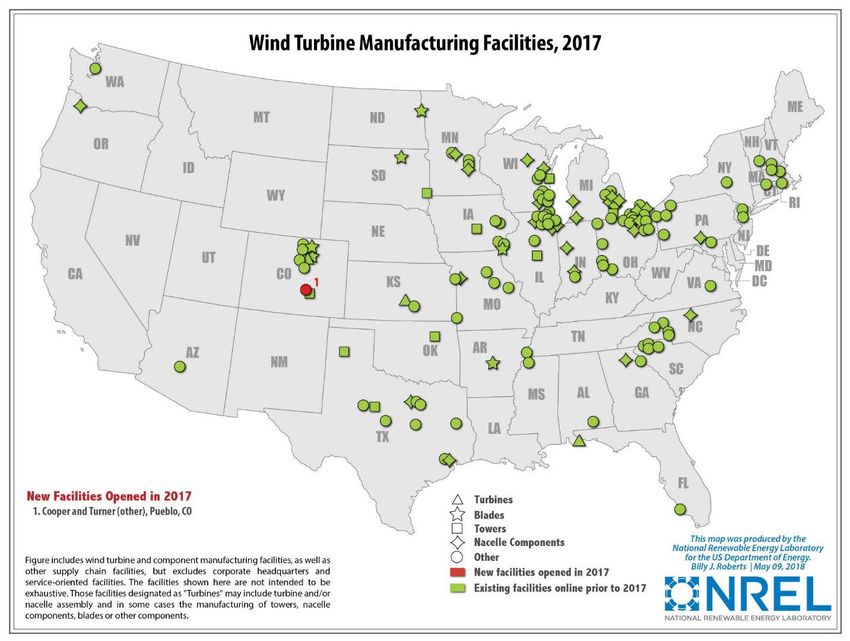
2017 Wind Technologies Market Report

Acknowledgments
For their support of this ongoing report series, the authors thank the entire U.S. Department of Energy (DOE)
Wind Energy Technologies Office team. In particular, we wish to acknowledge Patrick Gilman, Rich Tusing,
and Valerie Reed. For reviewing elements of this report or providing key input, we also acknowledge: Patrick
Gilman, Liz Hartman, Mikayla Rumph (DOE); Christopher Namovicz, Cara Marcy, Manussawee Sukunta
(U.S. Energy Information Administration, EIA); Andrew David (U.S. International Trade Commission,
USITC); John Hensley and Celeste Wanner (American Wind Energy Association, AWEA); Charlie Smith
(Energy Systems Integration Group); Matt McCabe (Clear Wind); Ed DeMeo (Renewable Energy Consulting
Services, Inc.); Danielle Preziuso (Pacific Northwest National Laboratory); Tyler Stehly (National Renewable
Energy Laboratory, NREL); and Lawrence Willey (University of Wyoming). For providing data that underlie
aspects of this report, we thank the EIA, Bloomberg New Energy Finance (BNEF), MAKE Consulting, and
AWEA. Thanks also to Donna Heimiller and Billy Roberts (NREL) for assistance with the wind project and
wind manufacturing maps as well as for assistance in mapping wind resource quality; and Carol Laurie
(NREL) and Liz Hartman (DOE) for assistance with layout, formatting, production, and/or communications.
Lawrence Berkeley National Laboratory’s contributions to this report were funded by the Wind Energy
Technologies Office, Office of Energy Efficiency and Renewable Energy of the DOE under Contract No. DE-
AC02-05CH11231. The authors are solely responsible for any omissions or errors contained herein.

                                                      iv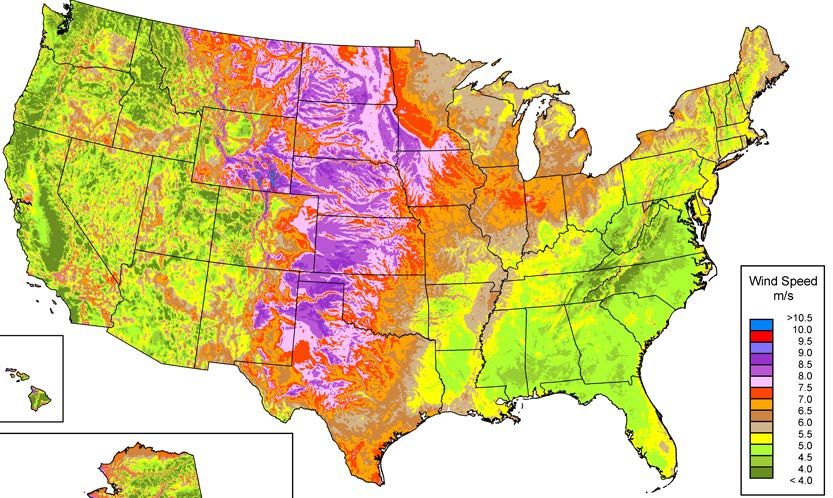
2017 Wind Technologies Market Report

List of Acronyms
 AWEA       American Wind Energy Association
 BNEF       Bloomberg New Energy Finance
 BPA        Bonneville Power Administration
 CAISO      California Independent System Operator
 COD        commercial operation date
 DOE        U.S. Department of Energy
 EDPR       EDP Renováveis
 EIA        U.S. Energy Information Administration
 ERCOT      Electric Reliability Council of Texas
 FAA        Federal Aviation Administration
 FERC       Federal Energy Regulatory Commission
 GE         General Electric Corporation
 GW         gigawatt
 HTS        Harmonized Tariff Schedule
 IEC        International Electrotechnical Commission
 IOU        investor-owned utility
 IPP        independent power producer
 ISO        independent system operator
 ISO-NE     New England Independent System Operator
 ITC        investment tax credit
 kV         kilovolt
 kW         kilowatt
 kWh        kilowatt-hour
 LCOE       levelized cost of energy
 m2         square meter
 MISO       Midcontinent Independent System Operator
 MW         megawatt
 MWh        megawatt-hour
 NREL       National Renewable Energy Laboratory
 NYISO      New York Independent System Operator
 O&M        operations and maintenance
 OEM        original equipment manufacturer
 PJM        PJM Interconnection
 POU        publicly owned utility
 PPA        power purchase agreement

                                                     v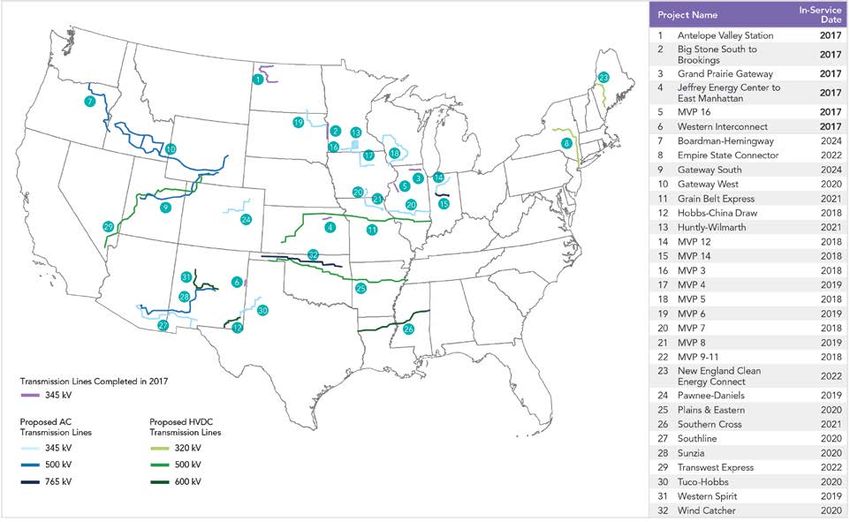
2017 Wind Technologies Market Report

 PTC        production tax credit
 REC        renewable energy certificate
 RGGI       Regional Greenhouse Gas Initiative
 RPS        renewables portfolio standard
 RTO        regional transmission organization
 SGRE       Siemens Gamesa Renewable Energy
 SPP        Southwest Power Pool
 USITC      U.S. International Trade Commission
 W          watt
 WAPA       Western Area Power Administration
 WECC       Western Electricity Coordinating Council

                                                   vi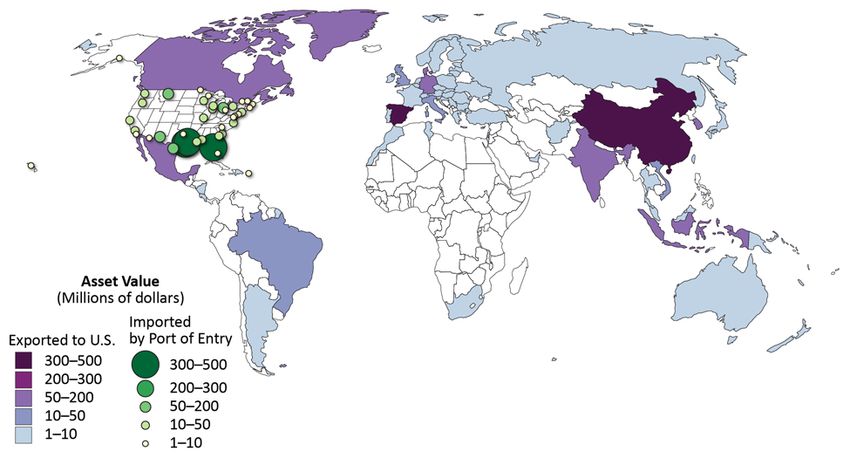
2017 Wind Technologies Market Report

Executive Summary
Wind power capacity in the United States continued to experience strong growth in 2017. Recent and near-
term additions are supported by the industry’s primary federal incentive—the production tax credit (PTC)—as
well as a myriad of state-level policies. Wind capacity additions have also been driven by improvements in the
cost and performance of wind power technologies, yielding low-priced wind energy for utility, corporate, and
other power purchasers. The prospects for growth beyond the current PTC cycle remain uncertain, however,
given declining tax support, expectations for low natural gas prices, and modest electricity demand growth.

Key findings from this year’s Wind Technologies Market Report include:

Installation Trends
  • Wind power additions continued at a rapid pace in 2017, with 7,017 MW of new capacity added in
    the United States and $11 billion invested. Supported by favorable tax policy and other factors,
    cumulative wind power capacity grew to 88,973 MW. In addition to this newly installed wind capacity,
    2,131 MW of partial wind plant repowering was completed in 2017, mostly involving upgrades to the
    rotor diameters and major nacelle components of existing turbines in order to increase energy production
    with more-advanced turbine technology, extend project life, and access favorable tax incentives.

  • Wind power represented the third-largest source of U.S. electric-generating capacity additions in
    2017, behind solar and natural gas. Wind power constituted 25% of all capacity additions in 2017.
    Over the last decade, wind represented 30% of all U.S. capacity additions, and an even larger fraction of
    new capacity in the Interior (55%) and Great Lakes (44%) regions. Its contribution to generation capacity
    growth over the last decade is somewhat smaller in the Northeast (19%) and West (18%), and
    considerably less in the Southeast (2%). [See Figure 1 for regional definitions].

  • Globally, the United States ranked second in annual wind capacity additions in 2017, but was well
    behind the market leaders in wind energy penetration. Global wind additions equaled 52,500 MW in
    2017, well below the record 63,600 MW added in 2015, yielding a cumulative total of 539,000 MW. The
    United States remained the second-leading market in terms of annual and cumulative capacity as well as
    annual wind generation, behind China. A number of countries have achieved high levels of wind
    penetration; end-of-2017 wind power capacity is estimated to supply the equivalent of 48% of Denmark’s
    electricity demand, and roughly 30% of demand in Ireland and in Portugal. In the United States, the total
    wind capacity installed by the end of 2017 is estimated, in an average year, to equate to 7% of electricity
    demand.

  • Texas installed the most capacity in 2017 with 2,305 MW, while fourteen states exceeded 10% wind
    energy penetration as a fraction of total in-state generation. New utility-scale wind turbines were
    installed in 24 states in 2017. On a cumulative basis, Texas remained the clear leader, with 22,599 MW
    of capacity. Notably, the wind capacity installed in Iowa, Kansas, Oklahoma, and South Dakota supplied
    30%–37% of all in-state electricity generation in 2017.

  • A record level of wind power capacity entered transmission interconnection queues in 2017; solar
    and storage also reached new highs in 2017. At the end of 2017, there was 180 GW of wind power
    capacity seeking transmission interconnection, representing 36% of all generating capacity in the
    reviewed queues. In 2017, 81 GW of wind power capacity entered interconnection queues, second only
    to solar capacity additions. Energy storage interconnection requests have also increased in recent years.
    The Southwest Power Pool, Texas, and Mountain regions experienced especially sizable wind additions
    to their queues in 2017.

                                                      vii
2017 Wind Technologies Market Report
Industry Trends
• Vestas, GE, and Siemens Gamesa captured 88% of the U.S. wind power market in 2017. In 2017,
Vestas captured 35% of the U.S. market for turbine installations, edging out GE at 29% and followed by
Siemens-Gamesa Renewable Energy (SGRE) at 23%. Vestas was also the leading turbine supplier for
land-based wind installations worldwide in 2017, followed by SGRE, Goldwind, and GE.
• Some manufacturers increased the size of their U.S. workforce in 2017 or otherwise expanded their
existing facilities, but expectations for significant long-term supply-chain expansion have become
less optimistic. Domestic wind sector employment reached a new high of 105,500 full-time workers in
2017. Moreover, the profitability of turbine suppliers has generally been strong over the last four years.
Although there have been a number of plant closures over the last 5+ years, the three major turbine
manufacturers serving the U.S. market have domestic manufacturing facilities. Domestic nacelle
assembly capability stood at roughly 11.7 GW in 2017, and the United States had the capability to
produce blades and towers sufficient for approximately 8.9 GW and 7.4 GW, respectively, of wind
capacity annually. The domestic supply chain faces conflicting pressures, including significant near-term
growth, but also strong competitive pressures and an anticipation of reduced demand as the PTC is
phased out.
• Domestic manufacturing content is strong for some wind turbine components, but the U.S. wind
industry remains reliant on imports. The United States is reliant on imports of wind equipment from a
wide array of countries, with the level of dependence varying by component. Domestic manufacturing
content is highest for nacelle assembly (>85%), towers (70–90%), and blades and hubs (50–70%).
• The project finance environment remained strong in 2017. The U.S. wind market raised $6 billion of
new tax equity in 2017, on par with the three prior years. Project-level debt finance decreased to $2.5
billion. Tax equity yields held at just below 8% (in unlevered, after-tax terms), while the cost of term
debt hovered around 4% for much of the year, before pushing higher during the first half of 2018.
Looking ahead, 2018 should be another busy year, given the abundant backlog of turbines that met safe-
harbor requirements to qualify for 100% PTC, along with another reported 10 GW of safe-harbored
turbines at 80% PTC, still to be deployed.
• Independent power producers own the vast majority of wind assets built in 2017. IPPs own 91% of
the new wind capacity installed in the United States in 2017, with the remaining assets owned by
investor-owned utilities (9%) and other entities (2017 Wind Technologies Market Report
years. In 2008, no turbines employed rotors that were 100 meters in diameter or larger; in contrast, by
2017, 99% of newly installed turbines featured rotors of at least that diameter, with 80% of newly
installed turbines featuring rotor diameters of greater than 110 meters, and 14% greater than or equal to
120 meters.
• Turbines originally designed for lower wind speed sites have rapidly gained market share, and are
being deployed in a range of wind resource conditions. With growth in swept rotor area outpacing
growth in nameplate capacity, there has been a decline in the average “specific power” 1 (in W/m2), from
394 W/m2 among projects installed in 1998–1999 to 231 W/m2 among projects installed in 2017. In
general, turbines with low specific power were originally designed for lower wind speed sites. Another
indication of the increasing prevalence of lower wind speed turbines is that, in 2017, the overwhelming
majority of new installations used IEC Class 3 and Class 2/3 turbines—turbines specifically certified for
lower wind speed sites.
• Wind turbines were deployed in somewhat lower wind-speed sites in 2017 in comparison to the
previous three years. With an estimated long-term average wind speed of 7.7 meters per second at a
height of 80 meters above the ground, wind turbines installed in 2017 were located in lower wind-speed
sites than in the previous three years; however, the 2017 average exceeds that for turbines installed from
2009 to 2013. Federal Aviation Administration data suggest that near-future wind projects will be located
in similar or slightly better wind resource areas than those installed in 2017.
• Low specific power turbines continue to be deployed in both lower and higher wind speed sites;
taller towers predominate in the Great Lakes and Northeast. Low specific power and IEC Class 3
and 2/3 turbines continue to be employed in all regions of the United States, and at both lower and higher
wind speed sites. In parts of the Interior region, in particular, turbines designed for lower wind speeds
continue to be deployed across a wide range of resource conditions. Meanwhile, the tallest towers
continue to be deployed in the Great Lakes and Northeastern regions, in lower wind speed sites, with
specific location decisions likely driven by the wind profile at the site.
• Wind power projects planned for the near future continue the trend of ever-taller turbines. Federal
Aviation Administration permit data suggest that near-future wind projects will deploy progressively
taller turbines, with a significant portion (>35%) of permit applications in early 2018 over 500 feet.
• A large number of wind power projects continued to employ multiple turbine configurations from
a single turbine supplier. Nearly a quarter of the larger wind power projects built in 2016 and 2017
utilized turbines with multiple hub heights, rotor diameters and/or capacities—all supplied by the same
original equipment manufacturer (OEM). This development may reflect increasing sophistication with
respect to turbine siting and wake effects, coupled with an increasing willingness among turbine
suppliers to provide multiple turbine configurations, leading to increased site optimization.
• Turbines that were partially repowered in 2017 now have significantly larger rotors and
correspondingly lower specific power ratings. In 2017, 1,317 turbines totaling 2,131 MW of capacity
were partially repowered. Larger rotors were installed on all of these repowered turbines, with an average
increase of 12 meters, while only 10% saw increases in rated capacity. On average, these changes
resulted in a 25% decrease in specific power, from 335 W/m2 to 252 W/m2. All of these turbines had
been in service for just 9–14 years prior to being repowered, with the primary motivation for partial
repowering being to increase operational efficiencies while also re-qualifying for the PTC.
1A wind turbine’s specific power is the ratio of its nameplate capacity rating to its rotor-swept area. All else equal, a decline in
specific power should lead to an increase in capacity factor.
ix2017 Wind Technologies Market Report
Performance Trends
• Sample-wide capacity factors have gradually increased, but have been impacted by curtailment
and inter-year wind resource variability. Wind project performance, as illustrated by data on capacity
factors, has generally increased over time, driven largely by turbine scaling. However, inter-year
variations in the strength of the wind resource and changes in the amount of wind energy curtailment
have partially masked the influence of turbine scaling on wind project performance. On average, across
the United States and for 2017 as a whole, wind speeds were near-normal as compared to earlier years,
while wind energy curtailment remained modest at around 2.5%.
• Turbine design changes are driving capacity factors significantly higher over time among projects
located in given wind resource regimes. Focusing on performance solely in 2017 helps identify
underlying trends. The average 2017 capacity factor among projects built from 2014 to 2016 was 42.0%,
compared to an average of 31.5% among projects built from 2004 to 2011 and just 23.5% among projects
built from 1998 to 2001. The decline in specific power is a major contributor to these trends, but has been
offset to a degree by a tendency—especially from 2009 to 2012—towards building projects at lower-
quality wind sites. Controlling for these two influences shows that turbine design changes are driving
capacity factors significantly higher over time among projects located in given wind resource regimes.
Older projects, meanwhile, appear to suffer from performance degradation, particularly in their second
decade of operations.
• Regional variations in capacity factors reflect the strength of the wind resource and adoption of
new turbine technology. Based on a sub-sample of wind projects built in 2015–2016, average capacity
factors in 2017 were highest in the Interior region (43.2%). Not surprisingly, the regional rankings are
roughly consistent with the relative quality of the wind resource in each region, and they reflect the
degree to which each region has adopted turbines with lower specific power and/or taller towers. For
example, the Great Lakes region has thus far adopted these new designs (particularly taller towers) to a
larger extent than some other regions, leading to an increase in average regional capacity factors.
Cost Trends
• Wind turbine prices remained well below levels seen a decade ago. After hitting a low of roughly
$800/kW 2 from 2000 to 2002, average turbine prices increased to more than $1,600/kW by 2008. Since
then, wind turbine prices have steeply declined, despite increases in size. Recent data suggest pricing
most-typically in the $750–$950/kW range. These price reductions, coupled with improved turbine
technology, have exerted downward pressure on project costs and wind power prices.
• Lower turbine prices have driven reductions in reported installed project costs. The capacity-
weighted average installed project cost within our 2017 sample stood at $1,610/kW. This is a decrease of
$795/kW from the apparent peak in average reported costs in 2009 and 2010, but is roughly on par
with—or even somewhat higher than—the installed costs experienced in the early 2000s. Early
indications from a sample of projects currently under construction suggest that somewhat lower costs are
on the horizon.
• Installed costs differed by project size, turbine size, and region. Installed project costs exhibit some
economies of scale, at least at the lower end of the project size range. Additionally, among projects built
in 2017, the Interior of the country was the lowest-cost region, with a capacity-weighted average cost of
$1,550/kW.
• Operations and maintenance costs varied by project age and commercial operations date. Despite
limited data availability, projects installed over the past decade have, on average, incurred lower
2 All cost figures presented in the report are denominated in real 2017$,
x2017 Wind Technologies Market Report
operations and maintenance (O&M) costs than older projects in their first several years of operation. The
data suggest that O&M costs have increased as projects age for the older projects in the sample, but hold
steady with age among those projects installed over the last decade.
Wind Power Price Trends
• Wind power purchase agreement prices remain very low. After topping out at $70/MWh for power
purchase agreements (PPAs) executed in 2009, the national average levelized price of wind PPAs within
the Berkeley Lab sample has dropped to around or even below $20/MWh—though this nationwide
average is admittedly focused on a sample of projects that largely hail from the lowest-priced Interior
region of the country, where most of the new capacity built in recent years is located. Focusing only on
the Interior region, the PPA price decline has been more modest, from around $55/MWh among contracts
executed in 2009 to below $20/MWh in 2017. Today’s low PPA prices have been enabled by the
combination of higher capacity factors, declining installed costs, and record-low interest rates
documented elsewhere in this report; the PTC has also been a key enabler over time. Regional and
nationwide trends in the levelized cost of wind energy (LCOE) closely follow the PPA price trends—i.e.,
generally decreasing from 1998 to 2005, rising through 2009, and then declining through 2017. The
lowest LCOEs are found in the Interior region, with a 2017 average of $42/MWh and with some projects
as low as $38/MWh.
• The economic competitiveness of wind power has been affected by low natural gas prices and by
declines in the wholesale market value of wind energy. Given the location of wind projects and the
hourly profile of wind generation, the average wholesale energy market value of wind has generally
declined since 2008. Following the sharp drop in wholesale electricity prices (and, hence, wind energy
market value) in 2009, average wind PPA prices tended to exceed the wholesale energy value of wind
through 2012. Continued declines in wind PPA prices, however, brought those prices back in line with
the energy market value of wind in 2013, and wind has generally remained competitive in subsequent
years. The energy market value of wind in 2017 was the lowest in the Southwest Power Pool, at
$14/MWh, whereas the highest-value market was California at $28/MWh. Meanwhile, the average future
stream of wind PPA prices from contracts executed in 2015–2017 is lower than the Energy Information
Administration’s latest projection of the fuel costs of gas-fired generation extending out through 2050.
Policy and Market Drivers
• The federal production tax credit remains one of the core motivators for wind power deployment.
In December 2015, via the Consolidated Appropriations Act of 2016, Congress passed a five-year
extension of the PTC that provides the full PTC to projects that started construction prior to the end of
2016, but that phases out the PTC for projects starting construction in subsequent years (e.g., projects that
started construction in 2017 get 80% of the PTC, which drops to 60% and 40% for projects starting
construction in 2018 and 2019, respectively). In 2016, the IRS issued Notice 2016-31, allowing four
years for project completion after the start of construction, without the burden of having to prove
continuous construction. According to various sources, 30–70 GW of wind turbine capacity had been
qualified for the full PTC by the end of 2016, with another 10 GW qualifying for the 80% PTC.
• State policies help direct the location and amount of wind power development, but wind power
growth is outpacing state targets. As of June 2018, renewables portfolio standards (RPS) existed in 29
states and Washington D.C. Of all wind capacity built in the United States from 2000 through 2017,
roughly 49% is delivered to load-serving entities with RPS obligations. Among wind projects built in
2017, this proportion fell to 23%. Existing RPS programs are projected to require average annual
renewable energy additions of roughly 4.5 GW/year through 2030.
• System operators are implementing methods to accommodate increased penetrations of wind
energy, but transmission and other barriers remain. Studies show that the cost of integrating wind
energy into the grid varies widely, from often below $5/MWh to close to $20/MWh for wind power
xi2017 Wind Technologies Market Report
capacity penetrations of up to or exceeding 40% of the peak load of the system in which the wind power
is delivered. Grid system operators and others continue to implement a range of methods to accommodate
increased wind energy penetrations. Just over 500 miles of transmission lines came online in 2017—less
than in previous years. The wind industry has identified 26 near-term transmission projects that, if
completed, could support considerable amounts of wind capacity.
Future Outlook
Energy analysts project that annual wind power capacity additions will continue at a rapid clip for the next
several years, before declining, driven by the five-year extension of the PTC and the progressive reduction in
the value of the credit over time. Additionally, near-term additions are impacted by improvements in the cost
and performance of wind power technologies, which contribute to low power sales prices. Other factors
influencing demand include corporate wind energy purchases and state-level renewable energy policies. As a
result, various forecasts show additions increasing in the near term, from more than 8 GW in 2018 to roughly
10–13 GW in 2020. Forecasts for 2021 to 2025, on the other hand, show a downturn in wind capacity additions
in part due to the PTC phase-out. Expectations for continued low natural gas prices, modest electricity demand
growth, and lower demand from state policies also put a damper on growth expectations, as do limited
transmission infrastructure and competition from natural gas and solar energy. At the same time, the potential
for continued technological advancements and cost reductions enhance the prospects for longer-term growth,
as does burgeoning corporate demand for wind energy and continued state RPS requirements. Moreover, new
transmission in some regions is expected to open up high-quality wind resources for development. Given these
diverse and contrasting underlying potential trends, wind additions—especially after 2020—remain uncertain.
xii2017 Wind Technologies Market Report
Table of Contents
Executive Summary ......................................................................................................................................... vii
1 Introduction ..............................................................................................................................................1
2 Installation Trends ..................................................................................................................................3
3 Industry Trends ..................................................................................................................................... 11
4 Technology Trends ............................................................................................................................... 25
5 Performance Trends ............................................................................................................................ 38
6 Cost Trends ........................................................................................................................................... 48
7 Wind Power Price Trends .................................................................................................................... 57
8 Policy and Market Drivers ................................................................................................................... 66
9 Future Outlook ...................................................................................................................................... 73
References ....................................................................................................................................................... 75
Appendix: Sources of Data Presented in this Report ................................................................................ 78
xiii2017 Wind Technologies Market Report
List of Figures
Figure 1. Regional boundaries overlaid on a map of average annual wind speed at 80 meters .........2
Figure 2. Annual and cumulative growth in U.S. wind power capacity ......................................................3
Figure 3. Relative contribution of generation types in annual capacity additions ..................................4
Figure 4. Generation capacity additions by region (2008–2017)..............................................................5
Figure 5. Approximate wind energy penetration in the 23 countries with the greatest installed wind
power capacity.........................................................................................................................................6
Figure 6. Location of wind power development in the United States ........................................................7
Figure 7. Generation capacity in 35 selected interconnection queues from 2013 to 2017, by
resource type ...........................................................................................................................................9
Figure 8. Wind power capacity in 35 selected interconnection queues, by region .............................. 10
Figure 9. Annual U.S. market share of wind turbine manufacturers by MW, 2005–2017 ................. 11
Figure 10. Location of existing and new turbine and component manufacturing facilities ............... 12
Figure 11. Number of wind turbine and component manufacturing facilities in the United States . 13
Figure 12. Domestic wind manufacturing capability vs. U.S. wind power capacity installations ...... 15
Figure 13. Turbine OEM global profitability over time .............................................................................. 16
Figure 14. Estimated imports of wind-powered generating sets, nacelles, towers, generators, and
blades and hubs, as well as exports of wind-powered generating sets ...................................... 17
Figure 15. Summary map of tracked wind-specific imports in 2017: countries of origin and U.S.
districts of entry .................................................................................................................................... 18
Figure 16. Origins of U.S. imports of selected wind turbine equipment ................................................ 19
Figure 17. Cost of 15-year debt and tax equity for utility-scale wind projects over time .................... 21
Figure 18. Cumulative and 2017 wind power capacity categorized by owner type............................. 22
Figure 19. Cumulative and 2017 wind power capacity categorized by power off-take arrangement
................................................................................................................................................................ 23
Figure 20. Average turbine nameplate capacity, rotor diameter, and hub height for land-based wind
projects .................................................................................................................................................. 25
Figure 21. Trends in turbine nameplate capacity ...................................................................................... 26
Figure 22. Trends in turbine hub height ...................................................................................................... 27
Figure 23. Trends in turbine rotor diameter ............................................................................................... 28
Figure 24. Trends in turbine specific power................................................................................................ 29
Figure 25. Trends in turbine IEC class ......................................................................................................... 30
Figure 26. Trends in specific power for IEC class 2, 2/3, and 3 turbines .............................................. 31
xiv2017 Wind Technologies Market Report
Figure 27. Wind Resource Quality by Year of Installation at 80 meters ................................................ 32
Figure 28. Deployment of turbines originally designed for lower wind speed sites, by region .......... 33
Figure 29. Deployment of turbines originally designed for lower wind speed sites, by estimated
wind resource quality .......................................................................................................................... 34
Figure 30. Total turbine heights proposed in FAA applications, over time ............................................ 35
Figure 31. Percent of larger projects employing multiple turbine configurations from a single OEM
................................................................................................................................................................ 36
Figure 32. Change in average physical specifications of turbines that were partially repowered in
2017....................................................................................................................................................... 37
Figure 33. Average sample-wide capacity factors by calendar year ...................................................... 38
Figure 34. Wind curtailment and penetration rates by ISO ..................................................................... 40
Figure 35. Calendar year 2017 capacity factors by commercial operation date ................................. 41
Figure 36. 2017 capacity factors and various drivers by commercial operation date ........................ 42
Figure 37. Calendar year 2017 capacity factors by wind resource quality and specific power: 1998-
2016 projects ....................................................................................................................................... 43
Figure 38. Calendar year 2017 capacity factors by commercial operation date and wind resource
quality .................................................................................................................................................... 44
Figure 39. Post-COD changes in capacity factors over time suggest performance degradation ...... 45
Figure 40. Calendar year 2017 capacity factors by region: 2015–2016 projects only ...................... 46
Figure 41. Calendar year 2017 capacity factors by region and specific power: 1998–2016 projects
................................................................................................................................................................ 47
Figure 42. Reported wind turbine transaction prices over time .............................................................. 48
Figure 43. Installed wind power project costs over time .......................................................................... 50
Figure 44. Installed wind power project costs by project size: 2016–2017 projects .......................... 51
Figure 45. Installed wind power project costs by turbine size: 2016–2017 projects .......................... 51
Figure 46. Installed wind power project costs by region: 2016–2017 projects ................................... 52
Figure 47. Histogram of installed costs by MW and projects: 2016–2017 projects ........................... 53
Figure 48. Average O&M costs for available data years from 2000 to 2017, by COD ........................ 54
Figure 49. Median annual O&M costs by project age and commercial operation date ...................... 55
Figure 50. Levelized wind PPA prices by PPA execution date and region ............................................. 58
Figure 51. Generation-weighted average levelized wind PPA prices by PPA execution date and
region ..................................................................................................................................................... 59
Figure 52. Regional wholesale energy market value of wind and average levelized long-term wind
PPA prices over time ........................................................................................................................... 61
xv2017 Wind Technologies Market Report
Figure 53. Regional wholesale energy market value of wind in 2017, by region ................................ 62
Figure 54. Wind PPA prices and natural gas fuel cost projections by calendar year over time......... 63
Figure 55. State RPS policies as of June 2018 .......................................................................................... 68
Figure 56. Integration costs at various levels of wind power capacity penetration ............................. 70
Figure 57. Miles of transmission projects completed, by year and voltage .......................................... 71
Figure 58. Transmission Line Activity: Completed in 2017, and Planned for Near Future ................. 72
Figure 59. Wind power capacity additions: historical installations and projected growth.................. 73
List of Tables
Table 1. International Rankings of Wind Power Capacity ...........................................................................6
Table 2. U.S. Wind Power Rankings: The Top 20 States..............................................................................8
Table 3. Approximate Domestic Content of Major Components in 2017.............................................. 20
Table 4. History of Production Tax Credit Extensions ................................................................................ 67
Table A1. Harmonized Tariff Schedule (HTS) Codes and Categories Used in Wind Import Analysis . 79
xvi1 Introduction
Wind power capacity additions in the United States continued at a rapid pace in 2017. Recent and projected
near-term growth is supported by the industry’s primary federal incentive—the production tax credit (PTC)—
having been extended (with a phase-out schedule) through 2019 as well as a myriad of state-level policies.
Wind capacity additions have also been driven by continued improvements in the cost and performance of
wind power technologies, yielding low-priced wind energy for utility, corporate, and other power purchasers.
At the same time, the prospects for growth beyond the current PTC cycle remain uncertain, given declining
federal tax support, expectations for continued low natural gas prices, and modest electricity demand growth.
This annual report—now in its twelfth consecutive year—provides an overview of developments and trends in
the U.S. wind power market, with a particular focus on the year 2017. The report begins with an overview of
installation-related trends: U.S. wind power capacity growth; how that growth compares to other countries and
generation sources; the amount and percentage of wind energy in individual U.S. states; and the quantity of
proposed wind power capacity in various interconnection queues in the United States. Next, the report covers
an array of wind industry trends: developments in turbine manufacturer market share; manufacturing and
supply-chain developments; wind turbine and component imports into and exports from the United States;
project financing developments; and trends among wind power project owners and power purchasers. The
report then turns to a summary of wind turbine technology trends: turbine size, hub height, rotor diameter,
specific power, and International Electrotechnical Commission (IEC) Class. After that, the report discusses
wind power performance, cost, and pricing. In doing so, it describes trends in project-level capacity factors,
wind turbine transaction prices, installed project costs, and operations and maintenance (O&M) expenses. It
also reviews the prices paid for wind power through power purchase agreements (PPAs) and how those prices
compare to the value of wind generation in wholesale energy markets as well as forecasts of future natural gas
prices. Next, the report examines market and policy factors impacting the domestic wind industry, including
federal and state policy as well as transmission and grid integration issues. The report concludes with a
preview of possible near-term market developments based on the findings of other energy analysts.
Many of these trends vary by state or region, depending in part on the strength of the local wind resource. To
that end, Figure 1 superimposes the boundaries of five broad regions on a map of average annual U.S. wind
speed at 80 meters above the ground. 3 These five regions will be referenced on many occasions throughout this
report, whenever regional breakdowns or analysis is warranted, so they are defined here. Note that any such
breakdowns, regional or otherwise, may not always add up to 100% due to rounding.
This edition of the annual report updates data presented in previous editions while highlighting trends and new
developments that were observed in 2017. The report concentrates on larger, utility-scale wind turbines,
defined here as individual turbines that exceed 100 kW in size. 4 The U.S. wind power sector is multifaceted,
and also includes smaller, customer-sited wind turbines used to power residences, farms, and businesses.
Further information on distributed wind power, which includes smaller wind turbines as well as the use of
larger turbines in distributed applications, is available through a separate annual report funded by the U.S.
Department of Energy (DOE)—the 2017 Distributed Wind Market Report. 5 Additionally, because this report
3 The regional boundaries shown in Figure 1 have been delineated in an attempt to simultaneously satisfy three goals: have a
relative uniformity in average annual wind speed within each individual region, include enough states in each region to enable
sufficient wind project sample size for regional breakdowns and analysis, and adhere as closely as possible to traditional regional
boundaries.
4 This 100-kW threshold between “smaller” and “larger” wind turbines is applied starting with 2011 projects to better match the
American Wind Energy Association’s historical methodology, and is also justified by the fact that the U.S. tax code makes a similar
distinction. In years prior to 2011, different cut-offs are used to better match AWEA’s reported capacity numbers and to ensure
that older utility-scale wind power projects in California are not excluded from the sample.
5 See: https://energy.gov/eere/wind/downloads/2017-distributed-wind-market-report
12017 Wind Technologies Market Report
has a historical focus—and because only one offshore wind project is operational in the United States—this
report does not address trends in offshore wind power. A companion study funded by DOE that focuses
exclusively on offshore wind power is also available as a PowerPoints slide deck—the 2017 Offshore Wind
Market Update. 6
Northeast
Great
Interior Lakes
West
Southeast
Sources: AWS Truepower, National Renewable Energy Laboratory (NREL)
Figure 1. Regional boundaries overlaid on a map of average annual wind speed at 80 meters
Much of the data included in this report were compiled by DOE’s Lawrence Berkeley National Laboratory
(Berkeley Lab) from a variety of sources, including the U.S. Energy Information Administration (EIA), the
Federal Energy Regulatory Commission (FERC), and the American Wind Energy Association (AWEA). The
Appendix provides a summary of the many data sources. In some cases, the data shown in the report represent
only a sample of actual wind power projects installed in the United States; furthermore, the data vary in
quality. Emphasis should therefore be placed on overall trends, rather than on individual data points. Finally,
each section of this document primarily focuses on historical data, with an emphasis on the year 2017. With
some limited exceptions—including the final section of the report—the report does not seek to forecast wind
energy trends.
6 See: https://energy.gov/eere/wind/downloads/2017-offshore-wind-market-report
22017 Wind Technologies Market Report
2 Installation Trends
Wind power additions continued at a rapid pace in 2017, with 7,017 MW of new capacity
added in the United States and $11 billion invested
U.S. wind power capacity additions equaled 7,017 MW in 2017, bringing the cumulative total to 88,973 MW
(Figure 2). 7 This growth represented $11 billion of investment in new wind power project installations in 2017,
for a cumulative investment total of roughly $180 billion since the beginning of the 1980s. 8,9 Over 80% of the
new wind power capacity installed in 2017 is located within the Interior region (as defined in Figure 1).
A new trend is that of partial wind project repowering, in which major components of turbines are replaced in
order to increase energy production with more-advanced turbine technology, extend project life, and access
favorable tax incentives. In addition to the newly installed wind capacity reported above, 2,131 MW of partial
repowerings were completed in 2017: 1,723 MW in Texas and 408 MW in Iowa. Upgrades and refurbishments
resulted primarily in increased rotor diameters and the replacement of major nacelle components; turbine
nameplate capacity increased by only 12.5 MW in aggregate, 10 and there were no changes to tower height.
14 98
13 Southeast (annual, left scale) 91
12 Northeast (annual, left scale) 84
11 Great Lakes (annual, left scale) 77
Cumulative Capacity (GW)
10 70
Annual Capacity (GW)
West (annual, left scale)
9 63
8 Interior (annual, left scale) 56
7 Total US (cumulative, right scale) 49
6 42
5 35
4 28
3 21
2 14
1 7
0 0
1998
1999
2000
2001
2002
2003
2004
2005
2006
2007
2008
2009
2010
2011
2012
2013
2014
2015
2016
2017
Source: AWEA WindIQ
Figure 2. Annual and cumulative growth in U.S. wind power capacity
As in previous years, growth was in part driven by continued improvements in the cost and performance of
wind power technologies. State renewables portfolio standards (RPS) and corporate demand also played a role.
7 When reporting annual wind power capacity additions, this report focuses on gross capacity additions, and does not consider
partial repowering. The net increase in capacity each year can be somewhat lower, reflecting turbine decommissioning, or higher,
reflecting partial repowering that increases nameplate capacities.
8 All cost and price data are reported in real 2017 dollars.
9 These investment figures are based on an extrapolation of the average project-level capital costs reported later in this report and
do not include investments in manufacturing facilities, research and development expenditures, or O&M costs; nor do they include
investments to partially repowered plants.
10 This 12.5 MW increase in capacity from partial repowering activity is included in the cumulative data but not the annual data
reported in Figure 2.
32017 Wind Technologies Market Report
A crucial factor was the PTC, which, in December 2015, was extended for an additional five years—applying
to projects that begin construction before January 1, 2020, but with a progressive reduction in the value of the
credit for projects starting construction after 2016. Meanwhile, the ability of partially repowered wind projects
to access the PTC was the primary motivator for the growth in partial repowering in 2017.
Wind power represented the third-largest source of U.S. electric-generating capacity
additions in 2017, behind solar and natural gas
Wind power has comprised a sizable share of generation capacity additions in recent years. In 2017, it
constituted 25% of all U.S. capacity additions and was the third-largest source of new capacity, behind solar
and natural gas (Figure 3). 11 Wind power’s share of overall annual capacity additions declined slightly in 2017
relative to 2016.
50 50%
(% of Total Annual Capacity Additions)
Total Annual Capacity Additions (GW)
40 40%
Wind Capacity Additions
30 30%
20 20%
10 10%
0 0%
2008
2009
2010
2011
2012
2013
2014
2015
2016
2017
Wind Solar Other Renewable
Gas Coal Other Non-Renewable
Wind (% of Total, right axis)
Sources: ABB, AWEA WindIQ, GTM Research, Berkeley Lab
Figure 3. Relative contribution of generation types in annual capacity additions
Over the last decade, wind power represented 30% of total U.S. capacity additions, and an even larger fraction
of new generation capacity in the Interior (55%) and Great Lakes (44%) regions (Figure 4; see Figure 1 for
regional definitions). Wind power’s contribution to generation capacity growth over the last decade is
somewhat smaller—but still significant—in the Northeast (19%) and West (18%), and considerably less in the
Southeast (2%).
11 Data presented here are based on gross capacity additions, not considering retirements or partial repowering. Furthermore, they
include only the 50 U.S. states, not U.S. territories.
42017 Wind Technologies Market Report
2%
100%
Percentage of Generation Capacity
19% 18%
30%
80% 44%
Additions (2008-2017)
55%
60%
40%
20%
0%
Interior Great Lakes Northeast West Southeast U.S. Total
Wind Solar Other Renewable Gas Coal Other Non-Renewable
Sources: ABB, AWEA WindIQ, GTM Research, Berkeley Lab
Figure 4. Generation capacity additions by region (2008–2017)
Globally, the United States ranked second in annual wind capacity additions in 2017, but
was well behind the market leaders in wind energy penetration
Global wind additions equaled roughly 52,500 MW in 2017, below the 54,600 MW added in 2016 and below
the record of 63,000 MW added in 2015. With its 7,017 MW representing 13% of new global installed
capacity in 2017, the United States maintained its second-place position behind China (Table 1). Cumulative
global capacity grew by 11% and totaled 539,000 MW at the end of the year (GWEC 2018), 12 with the United
States accounting for 17% of global capacity—a distant second to China by this metric (Table 1). 13 The United
States also remains in second place, behind China, in annual wind electricity generation.
12 Yearly and cumulative installed wind power capacity in the United States are from the present report, while global wind power
capacity comes from GWEC (2018) but are updated, where necessary, with the U.S. data presented here. Some disagreement
exists among these data sources and others.
13 Wind power additions and cumulative capacity in China include capacity that was installed but that had not yet begun to deliver
electricity by the end of 2017, due to a lack of coordination between wind developers and transmission providers and the lengthier
time that it takes to build transmission and interconnection facilities. All of the U.S. capacity reported here, on the other hand, was
capable of electricity delivery.
52017 Wind Technologies Market Report
Table 1. International Rankings of Wind Power Capacity
Annual Capacity Cumulative Capacity
(2017, MW) (end of 2017, MW)
China 19,660 China 188,392
United States 7,017 United States 88,973
Germany 6,581 Germany 56,132
United Kingdom 4,270 India 32,848
India 4,148 Spain 23,170
Brazil 2,022 United Kingdom 18,872
France 1,694 France 13,759
Turkey 766 Brazil 12,763
South Africa 618 Canada 12,239
Finland 535 Italy 9,479
Rest of World 5,182 Rest of World 82,391
TOTAL 52,492 TOTAL 539,019
Sources: GWEC (2018); AWEA WindIQ for U.S. capacity
A number of countries have achieved relatively high levels of wind energy penetration in their electricity grids.
Figure 5 presents data on end-of-2017 (and end-of-2016) installed wind power capacity, translated into
projected annual electricity supply based on assumed country-specific capacity factors and then divided by
projected 2018 (and 2017) electricity consumption. The figure covers the 23 countries that have the greatest
cumulative installed wind power capacity. A number of other countries, such as Uruguay, also have high wind
energy penetrations, but are not among the leaders in installed capacity and therefore are not included in the
figure.
55%
Approximate Cumulative Wind Penetration, end of 2017
50%
Proportion of Electricity Consumption
Approximate Cumulative Wind Penetration, end of 2016
Estimated Wind Generation as a
45%
40%
35%
30%
25%
20%
15%
10%
5%
0%
Netherlands
Brazil
Canada
Portugal
Italy
Mexico
Ireland
Poland
Denmark
U.K.
Romania
Belgium
France
GLOBAL
Spain
Japan
India
Germany
Austria
Australia
United States
China
Turkey
Sweden
Sources: Berkeley Lab estimates based on data from GWEC, EIA, and elsewhere
Figure 5. Approximate wind energy penetration in the 23 countries with the greatest installed wind power capacity
Using these approximations for the contribution of wind power to electricity consumption, end-of-2017
installed wind power is estimated to be able to supply the equivalent of 48% of Denmark’s electricity demand,
and roughly 30% of electricity demand both in Ireland and Portugal. In the United States, cumulative wind
62017 Wind Technologies Market Report
power capacity installed at the end of 2017 is estimated, in an average year, to equate to 7% of the nation’s
total electricity demand. On a global basis, wind energy’s contribution is estimated at approximately 5%.
Texas installed the most capacity in 2017 with 2,305 MW, while fourteen states exceeded
10% wind energy penetration as a fraction of total in-state generation
New utility-scale wind turbines were installed in 24 states in 2017. Texas once again installed the most new
wind capacity of any state, adding 2,305 MW. As shown in Figure 6 and in Table 2, other leading states—in
terms of new capacity—included Oklahoma, Kansas, New Mexico, and Iowa.
On a cumulative basis, Texas remained the clear leader, with 22,599 MW installed at the end of 2017—three
times as much as the next-highest state (Oklahoma, with 7,495 MW). In fact, Texas has more wind capacity
than all but five countries. States distantly following Texas in cumulative installed capacity include Oklahoma,
Iowa, California, and Kansas—all with more than 5,000 MW. Thirty-five states, plus Puerto Rico, had more
than 100 MW of wind capacity as of the end of 2017, with 26 of these above 500 MW, 18 above 1,000 MW,
12 above 2,000 MW, and 10 above 3,000 MW.
Note: Numbers within states represent cumulative installed wind capacity and, in brackets, annual additions in 2017.
Figure 6. Location of wind power development in the United States
Some states have reached high levels of wind energy penetration. The right half of Table 2 lists the top 20
states based on actual wind electricity generation in 2017 divided by total in-state electricity generation and by
in-state electricity sales in 2017. Electric transmission networks enable most states to both import and export
power in real time, and states do so in varying amounts. Denominating in-state wind generation as both a
proportion of in-state generation and as a proportion of in-state sales is relevant, but both should be viewed
with some caution given varying amounts of imports and exports. As a fraction of in-state generation, Iowa
7You can also read