INTRODUCING GREEN HORTICULTURE AT LAKE NAIVASHA IN KENYA - Local And International Market Analysis Reports
←
→
Page content transcription
If your browser does not render page correctly, please read the page content below

INTRODUCING GREEN
HORTICULTURE
AT LAKE NAIVASHA
IN KENYA
Local And International Market
Analysis Reports

                             Funded by the
                            European Union
Project Partners: Collaborating Centre on Sustainable Consumption
and Production (CSCP) gGmbH and WWF Kenya

Authors: Joshua Aseto (CSCP), Kartika Anggraeni (CSCP), John Mburu (for WWF-K)
Editors: Kat Penker, Kartika Anggraeni (CSCP)
Layout: Eva Rudolf (CSCP)
Illustrations: Kirsten Piepenbring (www.der-lichtspieler.de)
This report is published using sustainable materials and processes.

Disclaimer
This report does not reflect the views of the European Union.

@GOALAN Project, 2020

                                              2
TABLE OF CONTENTS
     Executive Summary. . . . . . . . . . . . . . . . . . . . . . . . . . . . . . . . . . . . . . . . . . . . . . . . . . . . . . . . . . . . . . . . . . . . . 5
     Background & objectives of the report. . . . . . . . . . . . . . . . . . . . . . . . . . . . . . . . . . . . . . . . . . . . . . . . . . . 6
     Kenyan FFV and the European market: key findings. . . . . . . . . . . . . . . . . . . . . . . . . . . . . . . . . . . . . . . 7

     MARKET SURVEY REPORT OF THE FRESH FRUIT AND VEGETABLE SECTOR
     IN THE LAKE NAIVASHA BASIN, KENYA  .  .  .  .  .  .  .  .  .  .  .  .  .  .  .  .  .  .  .  .  .  .  .  .  .  .  .  .  .  .  .  .  .  .  .  .  .  .  .  .  .  .  . 9

     1 INTRODUCTION .  .  .  .  .  .  .  .  .  .  .  .  .  .  .  .  .  .  .  .  .  .  .  .  .  .  .  .  .  .  .  .  .  .  .  .  .  .  .  .  .  .  .  .  .  .  .  .  .  .  .  .  .  .  .  .  .  .  .  .  .  . 10
       1.1 Economic importance of the horticultural sub-sector in Kenya  . . . . . . . . . . . . . . . . . . 10
       1.2 Rationale for a fruit and vegetables market survey . . . . . . . . . . . . . . . . . . . . . . . . . . . . . 11
       1.3 Objectives of the market survey . . . . . . . . . . . . . . . . . . . . . . . . . . . . . . . . . . . . . . . . . . . . . . . 13

     2 METHODOLOGICAL APPROACH .  .  .  .  .  .  .  .  .  .  .  .  .  .  .  .  .  .  .  .  .  .  .  .  .  .  .  .  .  .  .  .  .  .  .  .  .  .  .  .  .  .  .  .  .  .  . 14
       2.1 Study areas and general approach . . . . . . . . . . . . . . . . . . . . . . . . . . . . . . . . . . . . . . . . . . . . . 14
       2.2 Conceptual Framework . . . . . . . . . . . . . . . . . . . . . . . . . . . . . . . . . . . . . . . . . . . . . . . . . . . . . . . 15
       2.3 Data Collection  . . . . . . . . . . . . . . . . . . . . . . . . . . . . . . . . . . . . . . . . . . . . . . . . . . . . . . . . . . . . . . 18
     		    2.3.1 Collection of secondary data . . . . . . . . . . . . . . . . . . . . . . . . . . . . . . . . . . . . . . . . . . . . . 18
     		    2.3.2 Collection of primary data . . . . . . . . . . . . . . . . . . . . . . . . . . . . . . . . . . . . . . . . . . . . . . . 18

     3 FINDINGS .  .  .  .  .  .  .  .  .  .  .  .  .  .  .  .  .  .  .  .  .  .  .  .  .  .  .  .  .  .  .  .  .  .  .  .  .  .  .  .  .  .  .  .  .  .  .  .  .  .  .  .  .  .  .  .  .  .  .  .  .  .  .  .  .  .  .  .   20
       3.1 Descriptions of key production areas .  .  .  .  .  .  .  .  .  .  .  .  .  .  .  .  .  .  .  .  .  .  .  .  .  .  .  .  .  .  .  .  .  .  .  .  .  .  .                                                          20
     		           ompliance with standards and sustainable consumption
           3.1.1 C
                 and production (SCP) practices . . . . . . . . . . . . . . . . . . . . . . . . . . . . . . . . . . . . . . . . . . .                                                                                        21
     		    3.1.2 Profitability of vegetable enterprises . . . . . . . . . . . . . . . . . . . . . . . . . . . . . . . . . . . .                                                                                              22
       3.2 Mapping of the existing markets .  .  .  .  .  .  .  .  .  .  .  .  .  .  .  .  .  .  .  .  .  .  .  .  .  .  .  .  .  .  .  .  .  .  .  .  .  .  .  .  .  .  .                                                   23
     		    3.2.1 General description of existing markets  . . . . . . . . . . . . . . . . . . . . . . . . . . . . . . . . . .                                                                                                23
     		    3.2.2 Value chain mapping of the existing markets  . . . . . . . . . . . . . . . . . . . . . . . . . . . . .                                                                                                      24
     		    3.2.3 MSMEs’ constraints in the existing informal and
                  formal markets . . . . . . . . . . . . . . . . . . . . . . . . . . . . . . . . . . . . . . . . . . . . . . . . . . . . . . . . .                                                                           26
     		    3.2.4 Buyers’ constraints within the existing markets . . . . . . . . . . . . . . . . . . . . . . . . . . .                                                                                                       26
       3.3 Potential solutions to the market constraints  .  .  .  .  .  .  .  .  .  .  .  .  .  .  .  .  .  .  .  .  .  .  .  .  .  .  .  .  .  .                                                                           27
     		    3.3.1 Fruit and vegetable aggregation hubs . . . . . . . . . . . . . . . . . . . . . . . . . . . . . . . . . . . .                                                                                                27
     		    3.3.2 Product labelling and promotion . . . . . . . . . . . . . . . . . . . . . . . . . . . . . . . . . . . . . . . . .                                                                                           28
     		    3.3.3 Product diversification and differentiation  . . . . . . . . . . . . . . . . . . . . . . . . . . . . . . .                                                                                                  28
     		    3.3.4 Further support of the value chain activities . . . . . . . . . . . . . . . . . . . . . . . . . . . . . .                                                                                                   29
       3.4 Potential Market Opportunities and Constraints  .  .  .  .  .  .  .  .  .  .  .  .  .  .  .  .  .  .  .  .  .  .  .  .  .  .  .                                                                                   29
     		    3.4.1 Organised markets with contracts . . . . . . . . . . . . . . . . . . . . . . . . . . . . . . . . . . . . . . . .                                                                                            29
     		    3.4.2 Organised market without contracts . . . . . . . . . . . . . . . . . . . . . . . . . . . . . . . . . . . . .                                                                                                32
     		    3.4.3 Markets where trade is blended with financial support . . . . . . . . . . . . . . . . . . . .                                                                                                               33
       3.5 Value Adding Methods along the Value Chain .  .  .  .  .  .  .  .  .  .  .  .  .  .  .  .  .  .  .  .  .  .  .  .  .  .  .  .  .  .  .                                                                            33
       3.6 Role Of Value Chain Supporters And Enablers .  .  .  .  .  .  .  .  .  .  .  .  .  .  .  .  .  .  .  .  .  .  .  .  .  .  .  .  .  .                                                                              35
     		    3.6.1 Market linkage . . . . . . . . . . . . . . . . . . . . . . . . . . . . . . . . . . . . . . . . . . . . . . . . . . . . . . . . . .                                                                          35
     		    3.6.2 Extension services . . . . . . . . . . . . . . . . . . . . . . . . . . . . . . . . . . . . . . . . . . . . . . . . . . . . . .                                                                              35
     		    3.6.3 Capacity building on SCP practices, GAP and certification  . . . . . . . . . . . . . . . . .                                                                                                                36
     		    3.6.4 Contract enforcement . . . . . . . . . . . . . . . . . . . . . . . . . . . . . . . . . . . . . . . . . . . . . . . . . . .                                                                                  36
     		    3.6.5 Infrastructural support . . . . . . . . . . . . . . . . . . . . . . . . . . . . . . . . . . . . . . . . . . . . . . . . . .                                                                                 37
     		    3.6.6 Financing . . . . . . . . . . . . . . . . . . . . . . . . . . . . . . . . . . . . . . . . . . . . . . . . . . . . . . . . . . . . . . .                                                                     38

     4 CONCLUSIONS AND RECOMMENDATIONS .  .  .  .  .  .  .  .  .  .  .  .  .  .  .  .  .  .  .  .  .  .  .  .  .  .  .  .  .  .  .  .  .  .  .  .  . 40

                                                                                         3
INTERNATIONAL MARKET ANALYSIS REPORT
FOR FRESH FRUIT AND VEGETABLES����������������������������������������������������������������������������������������� 43

1 INTRODUCTION��������������������������������������������������������������������������������������������������������������������������� 44

2 THE EUROPEAN MARKET ANALYSIS������������������������������������������������������������������������������������� 45
  2.1	European market for fresh fruit and vegetables:
       local production & import trends������������������������������������������������������������������������������������������� 45
  2.2 Key FFV imports from Kenya to the European market������������������������������������������������������51

3 EU MARKET REGULATIONS AND ENTRY REQUIREMENTS��������������������������������������������� 55
  3.1 EU legal and non-legal requirements����������������������������������������������������������������������������������� 58
  3.2 Non-legal and common requirements ��������������������������������������������������������������������������������� 60
  3.3	Influence of consumer preferences and key trends on the trade
       of FFV in the EU����������������������������������������������������������������������������������������������������������������������������61

4 OTHERS REGIONAL & NICHE MARKETS FOR KENYAN FFV������������������������������������������� 64

5 OPPORTUNITIES AND RECOMMENDATIONS FOR HORTICULTURAL MSMES��������� 66
  5.1 Standards and certifications��������������������������������������������������������������������������������������������������� 66
  5.2 Stable supply and organic product and niche markets ��������������������������������������������������� 67
  5.3 Market for processed products with added value������������������������������������������������������������� 67
  5.4 Access to finance������������������������������������������������������������������������������������������������������������������������� 67

6 RECOMMENDATIONS FOR POLICYMAKERS����������������������������������������������������������������������� 68

7 REFERENCES��������������������������������������������������������������������������������������������������������������������������������� 70

8 ANNEXES��������������������������������������������������������������������������������������������������������������������������������������� 72
  8.1 Potential horticultural produce buyers ������������������������������������������������������������������������������� 72
  8.2 List of key informants interviewed��������������������������������������������������������������������������������������� 82
  8.3 Documents required by potential markets������������������������������������������������������������������������� 83
  8.4 MSME (farmer) focus group discussion tool����������������������������������������������������������������������� 85
  8.5 Key informant interview tool for potential buyers����������������������������������������������������������� 91
  8.6	Summarised market requirement information
       from potential buyers��������������������������������������������������������������������������������������������������������������� 96
  8.7 Key informant interview tool for value chain supporters and enablers��������������������� 97

                                                         4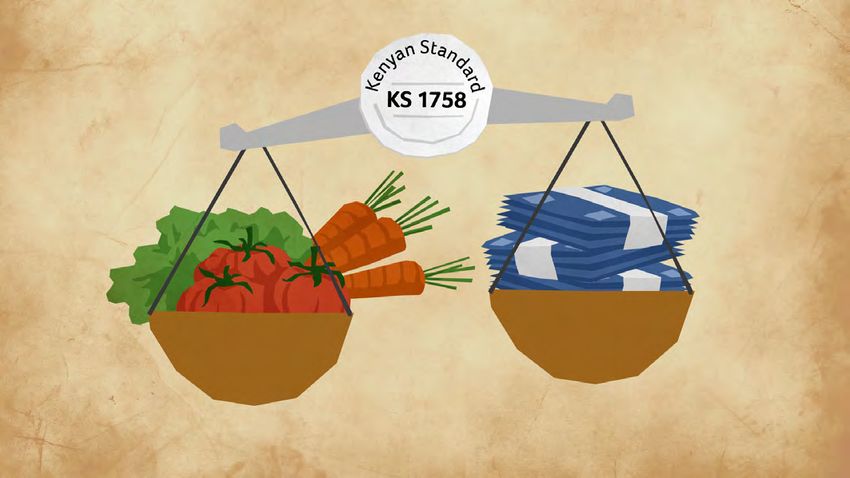
EXECUTIVE
SUMMARY

  5

BACKGROUND & OBJECTIVES OF THE REPORT

     The Lake Naivasha Basin, in Kenya, makes a significant contribution to fresh
     fruit and vegetables (FFV) supply in the country. Agriculture around the
     Lake Naivasha Basin, especially in the upper catchment, has been on a rising
     trend for rural smallholder farmers. Most of the farmers in the basin are
     micro, small and medium enterprises (MSMEs) and are spread across both the
     upper and lower zones of the basin (91 % of these farmers are in the upper
     zone). Tomatoes are grown in the lower zone, while Irish potatoes, cabbage,
     carrots, spinach and kale (sukuma wiki) are grown in the upper zone. Other
     vegetables grown include cabbage, spring onions, capsicum, Saget (Spider
     plant), snow peas and garden peas. The types of fruit grown are mainly tree
     tomato, peppino, plums and watermelon. Existing local fresh produce markets
     for fruit and vegetables within Naivasha and its surroundings include hotels,
     restaurants and educational institutions, the Naivasha farmers’ market,
     supermarkets like Naivas and Tuskys, and export companies. Rural domestic
     consumers also share in the market base for fruit and vegetables from the
     basin. The basin area also plays a key role for a wide array of additional
     stakeholders including horticultural companies, out growers and smallholders
     (producer traders), local and international traders, county governments,
     local NGOs, inhabitants and in general all actors relying on the basin and its
     products in the wider national economy.

     To support the existing horticultural practices, farmers and markets in the Lake
     Naivasha Basin and further contribute to the achievement of a green economy
     in the country, the European Union recently funded WWF-Kenya a four year
     (2018-2021) project (Green hOrticulture At LAke Naivasha (GOALAN)) (WWF-
     Kenya, 2019). The project supports micro, small and medium enterprises
     (MSMEs) to access ready markets and reduce post-harvest losses as well as
     to adopt resource-efficient and sustainable consumption and production
     (SCP) practices to minimise negative impacts on climate, water and land, while
     ensuring social inclusion (by targeting youth and women) thus contributing
     to poverty reduction through the creation of green jobs. To reach these
     objectives, the GOALAN project thus engages and works directly with Kenyan
     MSMEs by providing capacity-building, especially on issues surrounding
     SCP practices, and linking the producers with local governments, financial
     institutions and suppliers (exporters). Furthermore, to enhance the demand
     for sustainable products, the GOALAN project also analyse markets to identify
     opportunities and possible challenges for Kenyan producers (MSMEs).

     Since the project’s kick-off in 2018, the target MSMEs have adopted various
     SCP practices, including the use of certified seeds to enhance product quality,
     mulching to reduce water consumption, intercropping as part of integrated
     pest management, the safe use of pesticides, proper harvesting and post
     harvesting practices, as well as value addition and record keeping at farms.

                                   6
This document introduces the key findings from two distinct studies:
     the first – conducted by WWF-K – focuses on Kenya’s local market for FFV in
     the Lake Naivasha Basin; the second – produced by the Collaborating Centre
     on Sustainable Consumption and Production (CSCP) – presents the analysis of
     international markets for FFV, with a particular focus on the European market
     trends, opportunities, its accessibility and related standards to comply with.

KENYANKENYAN  FFV
        FFV AND   AND
                THE   THE EUROPEAN
                    EUROPEAN       MARKET:
                             MARKET:
      KEY FINDINGS
KEY FINDINGS

     Specifically, the first report highlights how the production and marketing of
     fruit and vegetables has become increasingly important to Kenya’s economy.
     There has been a steady rise in the production, local consumption and
     marketed quantities of fruit and vegetables across the country. However, this
     increase in supply has not met the ever-increasing demand. The latter being
     driven firstly by changing food consumption patterns as Kenyans adapt to
     healthy eating habits, attributed to an increased awareness of sustainable
     lifestyles and secondly to greater levels of disposable income.

     In the country, niche markets still offer new possibilities for MSMEs with
     limited capacity to produce fresh fruit and vegetables in large quantities
     to serve export markets as well as informal markets (e.g. include those
     who buy at farm gates or open-air markets, such as traders (brokers) and
     retailers). These buyers also include brokers targeting export markets. The
     challenges represented by these markets include buyers defining the terms
     of engagement (although without using written contracts) and producers
     becoming price takers: buyers do not share any market information with
     producers and usually define prices, quantities and units of measurement for
     all parties involved. This puts small producers at a disadvantage since the prices
     tend to be very low, especially during periods of glut. As fruit and vegetables
     are highly perishable products, producers have no option but to become price
     takers. Even after forcing producers to take any price that is offered, brokers
     often fail to fulfil their obligations. This is evident in the frequent occurrence
     of brokers rejecting produce supplied by producers, claiming that the rejection
     has come from the export companies. Furthermore, producers often face
     challenges due to orders of small quantity, the value of which do not even
     cover the necessary transportation costs, and irregular supply due to FFV
     seasonality, meaning producers cannot ensure a regular supply for their buyers.
     Despite these challenges and the fact that local demand for FFV in Kenya is
     not currently being met, many producers and micro, small and medium-sized
     horticultural enterprises (MSMEs) in the country would like to expand into the
     export market as they believe this market will fetch higher prices.

                                    7
In Europe there is a growing demand for healthy and sustainable food. This has
triggered increased volumes of imported FFV from non-EU countries including
Kenya. In particular, six key fruit and vegetables offer huge potential due to
their high demand in the EU market, namely fresh peas, green/French beans,
cabbage, passion fruit, mangoes and avocados. In 2017, Kenya dominated the
EU market for cabbage with a market share of more than 45 %. Nonetheless,
serving an export market, particularly the European one, requires producers
to meet specific standards of product quality and safety. This is due to
stringent healthy and quality regulations as well as to the increasing attention
given to sustainable consumption and production (SCP) practices, especially
after SCP became a standalone Sustainable Development Goal (SDG 12)
in 2015. Food safety, product quality and traceability are, accordingly, the
key requirements for FFV entering the EU market. The practices of eight
European food retailers from four EU countries (the Netherlands, the UK,
Germany and Belgium) analysed in the second report show how retailers need
to comply with a series of national and EU regulations resulting in a variety
of environmental and social standards required from suppliers. In addition,
other non-legal and common requirements also need to be met alongside
consumers’ expectations. Given these stringent requirements, it has emerged
from the analyses that only few players from the Naivasha Lake Basin and
elsewhere in Kenya are currently able to meet these conditions, indicating a
need for further training and capacity building provided to Kenyan MSMEs.

Both reports highlight the need for strategies that target local, regional as
well as international market regulations and requirements, e.g. ensuring
compliance with standards (such as KS1758 and GLOBALG.A.P.) by supply chain
actors; improving access to finance; establishing the necessary infrastructure
(roads, grading and value adding facilities); and developing policies that
facilitate a sustainable value chain. Enhancing the quality and quantity of
the key products and establishing a lean supply chain will strengthen Kenya’s
export market and, in turn, its local MSME sector that contributes to the
country´s vision of establishing a national inclusive and green economy.

                              8
MARKET SURVEY
REPORT OF THE
FRESH FRUIT AND
VEGETABLE SECTOR
IN THE LAKE
NAIVASHA BASIN,
KENYA

Prepared by John Mburu for WWF Kenya
2019

INTRODUCTION                                                                         1

       1.1 ECONOMIC IMPORTANCE OF THE HORTICULTURAL
       SUB-SECTOR IN KENYA

       The production and marketing of fruit and vegetables has become increasingly
       important to Kenya’s economy. Since 2011, there has been a steady rise in the
       production, local consumption and marketed quantities of fruit and vegetables
       in the country (KNBS, 2019). However, the increase in supply has not met
       the ever-increasing demand. This demand is partly driven by changes in food
       consumption patterns as people adapt to healthy eating habits, which are
       attributed to greater consumer awareness and an increase in the middle-
       income population. Indications of these changing habits include greater
       consumption of fruit and vegetables for a diversified nutritional diet rich in
       fibre, plant proteins and micronutrients (Kadenyi, 2017).

Horticulture contributes              According to data from the KNBS Economic
                                      Survey (KNBS, 2019), about 90 % of the fruit
      more than 30% to                and vegetables produced are used domestically,
 the agricultural sector              with only about 10 % exported and less than 5 %
                                      imported to fill the gap in terms of non-locally
       produced fruit and vegetables. Despite their small proportion of exported
       quantities, horticultural products rank among the top export earners. Fresh
       flowers account for more than 70 % of the value of marketed horticultural
       products, while fruit and vegetables account for about 25 % of the market
       share (KNBS, 2019). Furthermore, horticulture ranks second overall in
       agriculture after tea in terms of foreign exchange earnings (worth Ksh 124,267
       million in 2018) and contributes more than 30 % to the agricultural sector GDP
       (KNBS, 2019). This makes the sub-sector an important contributor to food
       security and a source of livelihood for many households in rural areas.

       Horticultural products are among the most consumed food groups in Kenyan
       households. According to the 2009 – 2019 Economic Survey by KNBS, fruit
       and vegetables account for 14 % and 8 % of the annual per capita food
       consumption respectively. Irish potatoes, tomatoes and cabbage are the most
       popular vegetables produced and consumed in Kenya, while bananas (ripe or
       cooked), pineapple and citrus are the most popular fruit (KNBS, 2019). Fruit
       and vegetables are mainly consumed fresh from the farms or bought at local
       markets. This indicates a high consumer preference for fresh produce and little
       value addition activity, such as drying, processing and canning, taking place in
       the industry. Value-added fruit and vegetables also tend to cost more, further
       reducing their popularity among Kenyan consumers.

                                     10
1
1.2 RATIONALE FOR A FRUIT AND VEGETABLES MARKET SURVEY
Given the importance of fruit and vegetables in the Lake Naivasha Basin and
concerns about the low uptake of certified produce by Kenyan households,
there are opportunities to increase the level of commercialisation and
marketing. In addition, the value addition activities for farm produce
are inadequate and there is a lack of the necessary knowledge and skills
among most smallholder farmers in the basin to trade effectively (WFP,
2015). Therefore, there is a need to promote the adoption of sustainable
consumption and production (SCP) practices to raise the level of local
production and consumption of sustainable produce. AGRA (2017) notes the
need to strengthen farmers’ access to markets as an incentive for the adoption
of new agricultural practices for increased production and income.
Smallholder farmers in the basin are facing a
There is a need to
myriad of challenges that negatively affect
promote the adoption of their production systems and livelihoods.
Key is inadequate market access to sell farm
sustainable consumption produce. The current marketing system is
and production (SCP) poorly organised and is mainly controlled by
exploitative middlemen. Coupled with the
practices to raise the fact that the production and harvesting cycles
level of local production depend on rainfall patterns, this means that
much of the produce goes to waste due to lack
and consumption of of market access. Consequently, addressing the
sustainable produce challenge of market access, based on market
intelligence, is a key outcome of the GOALAN
project. Linking the enterprising farmers to reliable formal markets will propel
the adoption of SCP practices, create jobs for young people in villages and
contribute to Kenya’s green economy goals.
In the high-end as well as international markets, the demand for certified and
traceable fruit and vegetables has been rising. The consumers in advanced
economies prefer high quality and safe products. This can be achieved
through a transparent supply chains where information about product source
and quality can be communicated clearly throughout the supply chain via a
certification or label. A certified produce means there is an assurance that
the produce meets certain quality and safety standards. This entails good
agricultural practices, which include postharvest methods, marketing and
labelling standards that ensure the safety of the global food supply chain and
environment (ISO, 2018). These standards are set by specific inspection and
111
standardisation bodies, such as the Approved Inspection Service (AIS) in Kenya.
According to Kenya Bureau of Standards (2016), the fruit and vegetable code
of practice KS 1758-2:2016 specifies the requirements for legal compliance, the
responsible procurement of inputs, safe production, handling and marketing
of all edible horticultural products such as fresh fruit, vegetables, herbs and
spices. This standard applies to all players in the sector, including growers,
propagators, plant breeders, seed merchants, consolidators, transporters,
traders, shippers and cargo handlers. Some of the key requirements for
fruit and vegetables at farmer level include traceability, maximum levels of
chemical residues, and well-kept records (especially on farm inputs). Indeed,
these requirements can be hard for horticultural MSMEs to meet. However,
adopting SCP practices can help MSMEs improve their farm operations and, in
turn, achieve a compliance with KS 1758-2:2016 standard.
Given the stringent requirements relating to certification, few players in
the Naivasha basin and country manage to meet them, while those who do
comply have to charge a premium price on their produce. On the supply side,
there are low quantities of certified produce, despite the country having many
smallholder producers of commercial vegetable and fruit tree propagation
materials. This is because most of them do not meet the standards set to
ensure the supply of clean quality materials for planting (ASCU, 2012). As a
result, the consumption of certified horticultural produce remains relatively
low in Kenya. This forces farmers to rely on international markets, which are
vulnerable to global fluctuations in prices and demand. The ability to serve
both domestic and export markets offers an opportunity for the majority of
fruit and vegetable producers (MSMEs) in the basin. By applying SCP in their
farms, MSMEs can produce sustainable fruit and vegetables with high quality
that not only meet domestic demand, but also demands from export market.
To encourage the uptake of SCP practices, there is a need to close the gap
in MSMEs’ access to market, value adding activities, and adequate supply
of certified produce. This market survey in the basin and surrounding cities,
including Nairobi, is therefore necessary to help address the gap.
121
1.3 OBJECTIVES OF THE MARKET SURVEY
The broad objective of the market survey was to establish market
requirements, opportunities and challenges faced by the horticultural sector,
particularly fruit and vegetables, with the aim of improving the market access
of producers (MSMEs) and creating opportunities for improved incomes,
creation of green jobs and, ultimately, enhanced water security in the Naivasha
Lake Basin.
THE SPECIFIC OBJECTIVES ARE:
1. Mapping the existing and potential organised horticultural markets
within the Basin (Nyandarua and Nakuru counties) and surrounding cities
(including Nairobi);
2. Identifying potential buyers of sustainable horticultural produce (fruit
and vegetables) and their level of commitment to purchase;
3. Establishing requirements of each of the potential organised
horticultural produce markets;
4. Identifying the value adding methods preferred by most buyers of
horticultural produce for possible adoption by MSMEs;
5. Creating a list of potential value adding partners from the private sector
for potential linkages;
6. Analysing market access and sustainability challenges and providing
recommendations; and
7. Identifying other players (both private and public) in the fruit and
vegetable value chains and pinpointing their specific roles.
13METHODOLOGICAL APPROACH 2
2.1 STUDY AREAS AND GENERAL APPROACH
The scope of the study follows the terms of reference of the GOALAN project.
Hence, this market survey covers the counties of Nakuru, Nyandarua and
Nairobi. In terms of horticultural produce, this market survey focuses on those
already identified by the GOALAN project as the key income sources for local
MSMEs. This survey specifically focuses on vegetables since very few MSMEs
that are involved in the project are selling fruit.
Mapping the existing and potential organised horticultural markets
The focus was on identifying the existing buyers of fruit and vegetables within
the basin and surrounding towns. This included their diversity, numbers and
names; for example, supermarkets, hotels and exporters. This was informed
by focus group discussions (FGDs) with MSMEs and primary data already
collected by WWF-Kenya, combined with information from the key informant
interviews (KIIs) collected from other market actors in the value chain.
Ultimately, the study mapped out the FFV value chain actors in a diagram
(value chain map) to show the major buyers (supermarkets, hotels, exporters,
individual buyers, wholesalers). The maps also included the market prices and
of the actors.
Establishing potential buyers of fruit and vegetables and their level
of commitment to purchase
The potential buyers were identified from the KIIs conducted with other
market actors. Several categories of buyers, including individuals, supermarket
managers, hotel managers, exporters, etc. were identified and their interest
in buying fruit and vegetables from the basin was determined. They were also
requested to indicate their level of commitment to buying the produce. This
was done in terms of readiness to buy and quantities on offer. The consultant
ensured the KII respondents were people in decision-making positions, able
to meaningfully state their level of commitment to purchase if their specified
conditions were met.
Establishing the market requirements of potential buyers of fruit
and vegetables
This was done in conjunction with (a) (mapping the existing and potential
organised horticultural markets), since only the buyers could provide insights
into the market requirements. The KIIs with potential buyers provided
information about specific market requirements for different types of fruit
and vegetables. The requirements were disaggregated in tables in terms of
the type of produce and its variety, expected source of the produce, average
142
price, quantity per week, quality, frequency of supply, time of delivery,
peak demand periods/months, mode of payment to suppliers, frequency of
payments, availability of supply contracts/possibility of their use, trading
documents needed including permits, certification of the produce, record
keeping and digitalisation, etc.
Identifying the value adding methods preferred by most buyers
The value adding methods preferred by most buyers were assessed through
information gained from the KIIs. This was done by first establishing how
the buyers preserved their horticultural produce and the reasons for their
preferred approaches. This included facilities and equipment used, shelf life
and ability to retain the original quality of the fruit and vegetables by using
the preservation/value adding techniques. In addition, a list of reliable value
adding partners was created. The consultant also sought to analyse which of
the identified value adding methods could easily be adopted by MSMEs and
scaled up in a sustainable way.
Analysing the market access and sustainability challenges
The market access and sustainability challenges were assessed by, first,
identifying challenges faced by different market actors on the supply and
demand sides through the FGDs and KIIs. The information was further
disaggregated in terms of price, quality, quantity and regulatory challenges.
Challenges identified through analysing the existing data on producer traders
were also included. All emerging issues in the horticultural business were
explored with the market actors.
Identifying other players (both private and public) in the fruit and
vegetable value chains and their specific roles
The FGDs and KIIs provided the consultant with knowledge of most of the
actors in the fruit and vegetable value chains. Their roles and interactions
with other actors were also captured. This information was combined with
data from the internet, such as the National Horticulture Market Information
System and relevant official county and national government sources.
2.2 CONCEPTUAL FRAMEWORK
The study employed a simplified framework of value chain analysis (VCA)
adopted from Porter (2001) to facilitate identification of value chain actors,
their roles, linkages and value adding activities, and analysis of the data (Figure
1). This helped to capture market information from diverse actors across the
fruit and vegetable value chains and to estimate their marketing margins. The
152
value chain analysis was useful for explaining commodity flow and market
prices from producers to consumers and for identifying the points or stages
presenting major marketing challenges, i.e. the weak parts of the chain. The
analysis also included the roles and responsibilities of different value chain
supporters and enablers, and the challenges they face when promoting
sustainable consumption and production practices among the main value
chain actors.
FRUIT AND VEGETABLE VALUE CHAIN SUPPORTERS AND ENABLERS
Existing and potential traders
Producer traders Assemblers (supermarkets, exporters, Consumers
(MSMEs) individual buyers, processors,
institutions)
• Planting material • Bulking • Specifying buyer requirements • Check fruits &
selection • Packaging • Storage vegetables
• SCP practices • Value addition • Certification appearance,
• Looking for formal • Transportation • Value addition skin colour, inner
and informal • Looking for • Distribution quality & hidden
markets organised formal • Looking for suppliers quality
• Harvesting, markets • Fruit & Vegetables quality and • Storage
grading, sorting, grading based on colour, size and • Taste &
weighing, weight preferences
packaging, • Repackaging • Customer feedback
transportation • Trader feedback • Consumption
Figure 1: A simplified schematic presentation of the value chain analysis of fruit and vegetable actors in the Lake
Naivasha Basin
To complement the VCA, the structure, conduct and performance framework
was used to facilitate the analysis of interactions and performance of the
main and support value chain actors. As shown in Figure 2, important market
structure attributes included the number and size of buyers and sellers in
a market, barriers to entry (e.g. licenses, taxes, access to credit and group
marketing leading to different levels of transaction cost), the type of product
and information asymmetry between buyers and sellers.
The structure influences the way market actors are organised along the
value chain, thus determining their behaviour, which results in market conduct
(Gachena and Kabebew, 2014). The conduct of MSMEs and other market actors
includes price setting behaviour through collusion and buying and selling
162
practices including, for example, product promotion and non-transparency
of prices and side marketing, which often affect contractual arrangements.
Market conduct also showed how different actors adapted and adjusted to
market requirements, including value adding, processing and the reduction of
post-harvest losses (PHLs) at different stages of the value chain. Performance
represented the economic results of an organised value chain, particularly
the market margins for different actors in the chain and the level of access
to organised formal markets by MSMEs. All the dimensions of the VCA and
the structure, conduct and performance frameworks were influenced by
institutional, physical and socio-economic characteristics of the environment
(institutional environment) and their indirect effects on market access and
sustainability challenges were analysed.
MAIN ACTORS’ OBJECTIVES
Supply Demand
• Certified inputs and produce • Product quality & quantity
• Market access • Purchasing requirements
Market structure/buyers Conduct of actors Performance
• Number of producer traders • Value adding methods • Profitability
• Diversity of fruit and • Certification processes • Level of access to organised
vegetable markets (super • SCP practices markets
markets, hotels, exporters, • Price setting • Level of commitment
individual buyers etc.) • Contract implementation • Environmental quality
• Transaction costs of market
activities
INSTITUTIONAL ENVIRONMENT
• Research and extension support from institutional actors in the Lake Naivasha Basin
• Market coordination and regulation
• Regulation of certifications and standards
• Project and donor conditions
• Physical and socio-economic conditions in the Basin
Figure 2: Adaptation of the structure, conduct and performance framework for fruit and vegetable value chain actors in the
Lake Naivasha Basin
172
2.3 DATA COLLECTION
2.3.1 Collection of secondary data
The consultant conducted a detailed desk study on most of the issues that
were not captured directly from the interviewees. This included data and
information on actors in the FFV value chains, markets, crop production,
standards and requirements. The literature materials for this review were
collected from the GOALAN project, Kenya’s National Horticulture Market
Information System (NAHMIS, 2019), Fresh Produce Exporters Association of
Kenya (FPEAK), County Agricultural Offices and relevant national government
ministries. The consultant worked closely with GOALAN project leaders
and relevant technical staff involved in the study to gather, document and
analyse both qualitative and quantitative data and any additional information.
In addition, information gathered during this review helped inform the
interpretations of the primary and secondary data.
2.3.2 Collection of primary data
Sampling procedure for the collection of primary data
A non-probability sampling design was applied to select participants for the
MSMEs’ focus group discussions (FGDs) and key informants for the other
market actors. This approach was chosen because inference of the results
generated from qualitative data was not required. For the FGDs, about 5
farmers were selected in each zone, depending on their availability and
geographical proximity to the meeting venue. Steps were taken to ensure
representation of at least 33 % of male and female entrepreneurs.
For the other main value chain actors, supporters and enablers, a purposive
sampling approach was adopted whereby a combination of chain (starting
with individuals known by the project staff), extreme case (participants with
unique or special characteristics) and typical case (meeting average selection
criteria) sampling techniques were employed. A snowballing approach
was also used to identify some of the markets and support actors. The key
informants included markets (supermarkets, hotels, organised individual
buyers/processors, organised vegetable markets and exporters) and support
actors (including among others WWF-Kenya and officials from relevant
county and government ministries). The objective of this design was to reach
key respondents who were easily accessible and had diverse opinions and
adequate knowledge of – or linkages to – relevant FFV produce marketing
issues, interventions and other value chain activities.
182
Collection of primary data from the main value chain actors
A qualitative method was used to collect primary data from the main value
chain actors, including MSMEs and commodity buyers. Qualitative data collected
included challenges related to the production and marketing of fruit and
vegetables, value adding activities, quality assurance and certification, SCP
practices, environmental quality, opportunities and possible solutions to value
chain problems. All the issues highlighted in Section 2.1 were also included. At
the MSME level, data collection was guided by a non-structured checklist of
issues. The key informant interviews with the main value chain actors from
different market categories were conducted using a KII tool (see annexes).
Collection of primary data from value chain support and enabling actors
A qualitative approach using key informant interviews (KIIs) guided by a non-
structured tool was used for the various fruit and vegetable value chain
supporters and enablers in Naivasha, Nyandarua and Nairobi. Open informal
discussions with representatives of these organisations (see annexes) were
held to draw out issues and challenges that might not have been captured
using the tool.
19FINDINGS 3
3.1 DESCRIPTIONS OF KEY PRODUCTION AREAS
The GOALAN project engages with 207 MSMEs which are organised into seven
farmer groups spread across the upper and lower zones of the Lake Naivasha
Basin. Over 90 % of these MSMEs are located in the upper zone. The upper zone,
which sits at the foot of the Aberdare Ranges, mainly covers the Kinangop and
Kipipiri Sub-Counties. These sub-counties are characterised by fertile soil and
a cool and temperate climate with reliable rainfall distribution throughout the
year. The average annual rainfall is 1,500 mm (Nyandarua County Integrated
Development Plan 2018 – 2022), which favours the production of vegetables
such as Irish potatoes, cabbage, garden peas and snow peas.
The lower zone of the Lake Naivasha Basin
Over 90 % of these
covers Naivasha Sub-County of Nakuru County,
MSMEs are located in the that sits in the Rift Valley floor. This sub-county
falls under Agro-ecological Zone III and has
upper zone of the Lake favourable soil for farming, an annual average
Naivasha Basin rainfall of 719.5 mm and temperatures ranging
between 24 °C and 29.3 °C (Naivasha Sub-County
farm management guidelines 2018/2019). Due to the relatively dry climatic
conditions, irrigation and alternative production methods (such as greenhouse)
are necessary for the year-round production of crops. Six greenhouses
are currently being used and 11 ‘water pans’ for rainwater harvesting are
expected to be installed by Nakuru County as a measure to increase the
adoption of climate change adaptation and mitigation measures (Nakuru
County Integrated Development Plan 2018 – 2022). Major crops grown in the
area include tomatoes, onions, cabbage, lettuce, capsicum, spinach and kale.
From focus group discussions with producer traders (MSMEs) participating
in the GOALAN project, the main vegetables produced from the lower zone
include lettuce, tomatoes, beetroot, courgette, capsicum (yellow, red and
green), cucumber and dhania (ranked in order of importance in terms of
income generation). Production is on an average of 0.125 acre of land, using
both open field and greenhouse methods. In the upper zone, the main crops
include snow peas, Irish potatoes, carrot and cabbage. Production of snow
peas and Irish potatoes is on an average of one acre of land per household,
while carrot and cabbage cover an average of 0.25 acre of land per household.
203
3.1.1 Compliance with standards and sustainable consumption
and production (SCP) practices
The focus group discussions with the farmers revealed that all MSMEs
in the project had been trained on KS 1758 standard. The entrepreneurs
could explain various practices advocated in the standard. However, none
of the entrepreneurs had obtained the KS 1758 certification, although they
indicated that they were ‘working towards it’. As explained by key informants
from Nakuru County’s Ministry of Agriculture, the certification process usually
takes at least 3 seasons of assessment before a farmer can be termed to be
compliant. It was found that Kenya Plant Health Inspectorate Services (KEPHIS),
Horticultural Crops Directorate (HCD), Ministry of Agriculture Livestock and
Fisheries (MoAL&F) and WWF-Kenya were the main organisations providing
training on the KS 1758 standard. The Equity Bank is a financial institution that
is expected to provide credit to enable farmers to comply with the standards.
The main SCP practices already adopted by the MSMEs include the use
of certified seeds, mulching, intercropping, soil testing, integrated pest
management, safe use of pesticides, proper harvesting and post harvesting
methods, value adding activities and record keeping. The main constraint to
the adoption of SCP practices highlighted by the farmers was the lack of capital
to buy relevant equipment and farm inputs. For example, prior to the training
farmers could borrow equipment from each other, such as knapsack sprayers
and pumps, but afterwards every farmer was supposed to have their own to
avoid negative effects associated with shared equipment – such as increased
costs incurred for cleaning the equipment. Similarly, buying certified seed is
expensive, especially for crops such as potatoes and snow peas. Furthermore,
some farmers felt that extension services such as soil testing, which is part of
the SCP practices, are expensive. Due to the cost, most of the farmers were
yet to conduct soil testing.
213
3.1.2 Profitability of vegetable enterprises
The summaries of gross margins (GMs) for various vegetables grown in the
upper and lower zones of the Lake Naivasha Basin are presented in Table 1.
The GMs are important as they indicate the production and marketing costs
that farmers incur and the minimum break-even selling price. The minimum
price must be above the variable production cost per kilogram. The gross
margins were obtained from the agriculture offices in Naivasha Sub-County
and Kinangop Sub-County and verified with the farmers through the FDGs.
GROSS MARGIN SUMMARIES FOR VARIOUS VEGETABLES GROWN IN
THE LAKE NAIVASHA BASIN
Crop Yield per ha Gross value Total Gross Variable
(kg) per ha (Ksh) variable margin per production
costs per ha ha (Ksh) cost per kg
(Ksh) (Ksh)
Outdoor tomato 25,000 390,000 160,453 229,547 6.42
Greenhouse** 10,000 200,000 74,653 125,347 7.47
Potato 13,750 275,000 131,119 143,881 9.54
Cabbage 40,000 330,000 72,821 257,179 1.82
Carrots 10,000 150,000 100,734 49,266 10.07
Bulb onion 18,000 480,000 88,168 391,832 4.90
Kale 12,000 160,000 80,134 79,866 6.68
Spinach 10,000 150,000 75,396 74,604 7.54
Snow peas 9,000 540,000 269,191 270,810 29.91
Courgette 10,000 360,000 115,360 244,640 11.54
Beetroot 5,000 250,000 70,967 179,033 14.19
Capsicum 12,500 375,000 103,927 271,073 8.31
Table 1 – Note**: For greenhouse tomatoes, the size of the greenhouse is 15m x 8m and its construction and depreciation
costs are accounted for in these figures. The gross margins presented in Table 1 reflect the third year of production. The
farmer is only able to break even in the second year.
The GM figures indicate that if market access is guaranteed, bulb onion and
capsicum are the most profitable crops in the lower zone, while snow peas
and cabbage have a comparative advantage over other crops in the upper
zone. In both zones there was evidence that farmers were cultivating these as
their target crops.
223
3.2 MAPPING OF THE EXISTING MARKETS
3.2.1 General description of existing markets
Two types of existing markets were identified: informal and formal organised
markets. Informal markets include buyers at farm gates or open-air markets,
such as traders (brokers) and retailers. They also include brokers targeting
the export market. The buyers in the informal market do not offer written
contracts specifying the terms of engagement. The market requirements are
not negotiated and buyers can easily manipulate the buying price, quantities
and units of measurement in their favour.
In informal markets, farmers do not incur marketing costs for transport or
market information research as the traders (mainly brokers) are the ones
who establish where the MSMEs are located and collect the produce direct
from the farms or nearby collection centres. The mode of payment is cash
and is immediate. The informal buyers do not grade the produce and no value
addition is required.
The formal and organised buyers identified have formal written contracts
with the farmers stipulating the agreed prices. Other requirements in the
contracts include produce quantities, value addition methods, mode of
payment and timeframes for delivery. The main formal buyers are exporters,
hotels and wildlife conservancies operating near the production areas. When
accessing these markets, the farmers incurred marketing costs (both visible
and hidden) for transporting the produce to the buyer and searching for
market information such as prevailing prices, and value addition costs such
as washing, grading and packaging. Units of measurement are determined
before contracts are agreed and methods of payment are strictly by cheque or
money transfer on delivery of the produce and submission of delivery notes
and invoices.
Farmers expressed their preference for formal organised buyers because the
market is more secure and the prices offered are higher than those in informal
markets, even after factoring in value addition costs and all visible and hidden
costs. During contract negotiation, farmers use gross margins as the basis for
setting the prices. Farmers can also get lump sum payments, which can then be
better allocated to farming and other household needs. Some buyers, such as
exporters, also offered inputs in kind and, once trust was established between
the supplier and the buyer, emergency loans, which are later recovered from
the sale of the produce, could be offered.
233
3.2.2 Value chain mapping of the existing markets
The main vegetables considered when drawing the value chain map are
tomatoes, green vegetables (sukuma wiki and spinach), potatoes and snow
peas (Figure 3). The vegetables basically flow from the farmer to informal
markets – but also to formal markets comprising actors such as processors,
exporters and retailers – and finally to the consumer in domestic and
international markets. Due to value addition activities such as grading,
cleaning, processing and repackaging, the prices tend to rise along the chain.
Farmers selling to informal markets (to neighbours, brokers and at open-
air markets) fetch the lowest prices, with tomatoes, green vegetables and
potatoes sold on average for Ksh 20, Ksh 10 and Ksh 10 per kg respectively.
Processors mainly buy under contract and tend to offer constant prices, which
are higher than in informal markets. For example, potatoes are bought at an
average of Ksh 20 per kg. Similarly, the export market where farmers mainly
export snow peas and sugar snap peas is under contract and these vegetables
command on average Ksh 50 per kg. The exporters sell to international buyers
at an average price of Ksh 120 per kg and finally the international buyers sell
to the end consumers in their countries at about Ksh 220 per kg.
Locally, there are diverse retail outlets ranging from supermarkets, organised
grocery stores and hotels. The prices offered to the farmer by the retailers
are lower than those offered by other actors. For example, the retailers
buy tomatoes at an average of Ksh 40 per kg from the farmers, but offer an
average of Ksh 50 per kg to other actors. Some special retailers buy in bulk
and sell to final consumers but also sell to other buyers like vendors and
hotels. These include Twiga Foods and Manna Supplies. The hotels also form a
unique set of retailers, since their prices are higher than all other retailers. For
example, hotels buy tomatoes at an average of Ksh 70 per kg.
243
PRODUCERS MARKETS END CONSUMERS
Informal markets Processors Exporters Retailers
(e .g . neighbours,
Average selling Average selling Average buying prices
brokers & open-air
prices Ksh/kg prices Ksh/kg Ksh/kg
markets)
Tomatoes = 40
snow peas & Farmer Broker/
Average selling Greens* = 20
sugar snap Processor
prices Ksh/kg Potatoes = 20
peas = 50 Tomatoes 40 50
Tomatoes: 20
*(Sukuma & Sukuma 15 20
Greens*: 10
spinach) Potatoes 30 40
Potatoes: 10
*(Sukuma & spinach)
FFV small Food process- Exporters Supermarkets International End consumers
scale ing factories, e.g. Jani Fresh e.g. Naivas buyers Snow peas:
producers of e.g. Kinangop Limited Snow peas: Ksh 220/kg
(with less than Fries & KDF Ksh. 120/kg
processing Hotels e.g
2 acres of a
factory Elsamere lodge
particular fruit
Brokers
Fresh vegetabels
or vegetable)
Organized
grocery Domestic
stores/outlets consumption
Local open-air e.g. Zucchini (farm level)/
markets and households/
roadside individual
selling – small Bulk buyers with consumers (e.g.
kiosks packhouses, e.g. Twiga neighbours)
foods, Manna supplies
Figure 3: Value chain map of assorted vegetables
3.2.3 MSMEs’ constraints in the existing informal and formal markets
The main disadvantage that the farmers (MSMEs) highlighted in terms of
selling to informal buyers is that the prices are always very low – especially
low during glut periods. As vegetables are highly perishable, the MSMEs are
generally price takers. This leads to farmers making losses as the informal
market prices are simply dictated by the buyers and are not based on gross
margins.
Another challenge with the informal markets is the frequency of rejected
produce – particularly when supply exceeds demand. For instance, farmers of
the Geta Community Forest Group explained that during such periods brokers
sometimes fail to make payments, claiming that the export companies have
rejected all the produce.
In the formal or organised markets, the MSMEs often incur losses due to orders
of small quantities which are requested by hotels. As an example, the Momaki
Green Growers group received orders of 5 kg vegetables from the hotels. For
253
the delivery, the motorbike1 transport costs the MSMEs about Ksh 300 which
is equivalent to the vegetable value. Similarly, a group from the upper zone
of Naivasha Lake Basin was unable to deliver two sacks of potatoes due to
the high transport costs. Consequently, the MSMEs often have to rely on the
informal market.
Another constraint in tapping into the formal market is the seasonality of
some vegetables, particularly the ones under rainfed condition. This results in
unstable supply of vegetables, where farmers are not always able to meet the
demands. However, one MSME group has successfully mitigated this challenge
by synchronising the vegetable production using irrigation and greenhouses
to ensure a stable supply throughout the year.
3.2.4 Buyers’ constraints within the existing markets
Reportedly, buyers in the informal market do not face any constraints. Most
of the buyers are brokers who dictate market requirements to the producers
(MSMEs). Therefore, only constraints linked to the formal and organised
markets are discussed in this section.
Based on key informant interviews, the main constraint hindering hotels
to develop an effective business with MSMEs is associated with the nature
of hotel business. Most hotels rely on walk-in guests and for MSMEs it is
particularly difficult to meet instant orders (unlike the suppliers). The second
1) Use of motorbikes for transportation is preferred because they are readily available and can quickly deliver well-packed
produce in crates in line with market requirements.
263
constraint facing the buyers is lack of diversity of produces supplied by
MSMEs. MSMEs can provide only a few types of vegetables and herbs that
hotels need, so hotels have to rely on the more established suppliers.
The next constraint is linked to produce requirements. MSMEs are at times
unable to deliver potatoes and tomatoes in the preferred size. For example,
most hotels demand long potatoes for potato chips, and large tomatoes that
can be sliced thinly for salads. Some hotels even prefer tomatoes that are
grown outside as opposed to the ones grown in greenhouses. This is due to
the preference of their guests who presume that outdoor-grown tomatoes
are tastier, juicier and have a longer shelf life.
Although producers breaking their contracts by failing to deliver the agreed
quantities is not common, on occasion this leads to buyers incurring losses.
For example, one hotel cited that a group of MSMEs in the upper zone of the
Basin failed to deliver potatoes without giving explanation. This has forced the
hotel to buy from an old supplier, when actually the hotel wanted to procure
sustainable potatoes from the MSMEs. Also, MSMEs sometimes practice side
selling. While they may have already a contract to supply to an exporter, the
MSMEs sell to brokers, especially during a high season when demand outstrips
supply. This happens when brokers offer higher prices than other buyers in
the market.
3.3 POTENTIAL SOLUTIONS TO THE MARKET CONSTRAINTS
3.3.1 Fruit and vegetable aggregation hubs
To address the constraints related to quantities and the vegetable type and
varieties supplied by MSMEs, aggregation hubs need to be established. These
are collection centres where MSMEs can bring their various produce before
supplying to the existing as well as potential markets which will be elaborated
further in the subsequent sections of this report. Each MSME group can
establish its own aggregation hub, which it can manage efficiently to address
the constraints associated with group dynamics. Since MSMEs are dealing
with highly perishable produce, the aggregation hub will need a cold storage
and diverse value addition activities. The hubs can also sell to non-contracted
buyers and walk-in customers.
From a discussion with one of the hotels, there is willingness among the
buyers to support the MSMEs to set up hubs. With a proper management, the
aggregation hubs can help MSMEs maintain their existing markets and expand
their businesses to more lucrative markets, as they will be able to stock all
sorts of fruit and vegetables and supply these to the formal markets whenever
273
needed. While setting up such aggregation hubs is an expensive undertaking,
the long-term benefits far outweigh the costs and can contribute to the
adoption of sustainable production and consumption (SCP) practices among
horticultural MSMEs and buyers alike.
3.3.2 Product labelling and promotion
MSMEs need to create an awareness of their sustainable produce and
compliance to certain standards among their consumers and buyers.
Product labelling is an approach that can be used to communicate MSMEs’
sustainability performance and certification. A product label can reduce the
risk of product rejection by exporting companies. A label also allows MSMEs to
sell with premium prices and increase profitability – provided the production
costs do not increase significantly.
The MSMEs can take advantage of various forums organised by the
government as well as private companies, such as trade fairs and farmers’
markets, to showcase their sustainable products. Good examples are the
Naivasha farmers’ market that takes place at Longonot Farm on specific dates,
and the Agricultural Society of Kenya Show in Nakuru and other counties.
The MSMEs can also consider creating a wider awareness of their sustainable
products via radio as well as digital platforms and social media such as
Facebook, Instagram and Twitter.
3.3.3 Product diversification and differentiation
Since the vegetable supply depends largely on local agroecological conditions,
MSMEs can invest in product diversification. This would mean sourcing other
types of vegetables from farmers who are not members of their producer
groups. To ensure product quality and safety, the MSMEs will have to select
farmers who have implemented SCP practices or complied with commonly
accepted standards, such as KS 1758 and GlobalG.A.P. However, many farmers
or farmers groups in Naivasha basin have not yet applied SCP practices or
obtained certification. Hence, the MSMEs which have been trained by the
GOALAN project on SCP and KS 1758 standard can reach out to other farmers
or farmer groups to transfer their knowledge via peer-to-peer training. This
training can take place through the use of farmer’s field and local business
schools where farmers are trained to train others. At press time, this peer-to-
peer training has taken place within the formal export market for snow peas.
In the event that the demand in the formal and organised markets exceed the
supply and if the MSMEs cannot train other farmers to meet certain product
quality, they still can source from other farmers. To differentiate the products,
28You can also read