CGFS Papers Operationalising the selection and application of macroprudential instruments
←
→
Page content transcription
If your browser does not render page correctly, please read the page content below
Committee on the Global
Financial System

CGFS Papers
No 48
Operationalising the
selection and application of
macroprudential instruments
Report submitted by a Working Group established by the
Committee on the Global Financial System

The Group was chaired by José Manuel González-Páramo,
then European Central Bank

December 2012

JEL Classification numbers: E58, G01, G28
This publication is available on the BIS website (www.bis.org).

© Bank for International Settlements 2012. All rights reserved. Brief excerpts may be
  reproduced or translated provided the source is cited.

ISBN 92-9131-897-3 (print)
ISBN 92-9197-897-3 (online)
Preface
Following the comprehensive stocktake of macroprudential policy developments conducted
by the CGFS in 2010, in September 2011, the Committee established a Working Group,
chaired by José-Manuel González-Páramo (then European Central Bank), to provide
practical guidance for policymakers on how macroprudential instruments should be chosen,
combined and applied.
To this end, the current report draws out three high-level criteria, which are key in
determining instrument selection and application: (i) the ability to determine the appropriate
timing for the activation or deactivation of the instrument; (ii) the effectiveness of the
instrument in achieving the stated policy objective; and (iii) the efficiency of the instrument in
terms of a cost-benefit assessment. In trying to operationalise these criteria, the report
proposes a number of practical tools that can aid the choice and implementation of
macroprudential instruments.
Following discussion and approval by the CGFS, the report was presented to central bank
Governors at the Global Economy Meeting in November 2012, where it received
endorsement for publication. We hope that the practical approaches described in this report
will prove to be a relevant and timely input to the macroprudential policy frameworks that are
currently being established in a large range of jurisdictions.

William C Dudley
Chairman, Committee on the Global Financial System
President, Federal Reserve Bank of New York

CGFS – Operationalising the selection and application of macroprudential instruments            iii
Contents

Preface .................................................................................................................................... iii
Executive summary ..................................................................................................................1
1.       Introduction ......................................................................................................................3
2.       Determining the appropriate timing for the activation or deactivation of MPIs ................5
         2.1     Stylised scenarios for the activation and release of MPIs ......................................6
         2.2     Indicators to guide MPIs: a three-step identification approach ..............................8
         2.3     Linking systemic risk assessment and MPI selection ..........................................15
3.       The transmission mechanism of MPIs ..........................................................................17
         3.1     Tightening capital-based MPIs .............................................................................18
         3.2     Tightening liquidity-based tools ............................................................................24
         3.3     Tightening asset-side MPIs ..................................................................................27
         3.4     Managing the release phase ................................................................................30
         3.5     Interactions...........................................................................................................32
4.       Macroprudential policy in practice: questions and answers ..........................................35
Annex 1:         Broad principles for the design and operation of macroprudential policy .............40
Annex 2:         Instrument and signal threshold selection: a conceptual framework ....................43
Annex 3:         Indicators supporting the application of MPIs .......................................................45
Annex 4:         The empirical strength of transmission channels .................................................51
Annex 5:         How to operationalise sectoral capital requirements? ..........................................58
Annex 6:         The interaction of macroprudential instruments with other policies ......................60
References .............................................................................................................................63
Members of the Working Group..............................................................................................69

CGFS – Operationalising the selection and application of macroprudential instruments                                                          v
Executive summary
As a response to the recent global crisis, new or strengthened mandates for macroprudential
policies have been established in a range of jurisdictions. This report aims to help
policymakers in operationalising macroprudential policies, building on earlier work by the
Committee, particularly on the comprehensive stocktake of macroprudential instruments
(MPIs) (CGFS (2010a)) and the seven broad principles for the design and operation of
macroprudential policies formulated by the CGFS in 2011.
Specifically, this report provides guidance on how to assess three high-level criteria that are
key in determining the selection and application of macroprudential instruments from a
practical perspective: (i) the ability to determine the appropriate timing for the activation or
deactivation of the instrument; (ii) the effectiveness of the instrument in achieving the stated
policy objective; and (iii) the efficiency of the instrument in terms of a cost-benefit
assessment.
In trying to operationalise these criteria, this report proposes a number of practical tools.
First, to help policymakers determine the appropriate timing for the activation and
deactivation of their policy tools, the report lays out stylised scenarios in which
macroprudential instrument settings may be tightened or released. The identification of these
states is facilitated by two alternative approaches that seek to link systemic risk analysis and
instrument selection. Second, to support the evaluation of the effectiveness and efficiency of
macroprudential tools for a range of macroprudential instruments, the report proposes
“transmission maps” – stylised presentations of how changes in individual instruments are
expected to contribute to the objectives of macroprudential policy.
Against this backdrop, this report concludes with a set of nine practical questions that can be
helpful in guiding the selection and application of macroprudential instruments. These, and
their respective answers, are set out and elaborated in detail in Section 4 of this report. In
brief, they are as follows:
To what extent are vulnerabilities building up or crystallising?
How (un)certain is the risk assessment?
Is there a robust link between changes in the instrument and the stated policy
objective?
How are expectations affected?
What is the scope for leakages and arbitrage?
How quickly and easily can an instrument be implemented?
What are the costs of applying a macroprudential instrument?
How uncertain are the effects of the policy instrument?
What is the optimal mix of tools to address a given vulnerability?
CGFS – Operationalising the selection and application of macroprudential instruments 11. Introduction
The recent financial crisis has accelerated efforts to develop macroprudential policy
frameworks. As a result, new or strengthened mandates for macroprudential policies have
been established in a growing range of jurisdictions. The broad goal of these policies is to
limit the risk of financial system disruptions that can destabilise the macroeconomy (see
Box 1). Such systemic risk arises from externalities (such as joint failures and procyclicality)
that are not easily internalised by financial market participants themselves. Thus, by explicitly
taking a system-wide perspective, macroprudential policies complement other policies, such
as macroeconomic and prudential ones, which can also impact on financial stability
conditions.
Despite progress over recent years, the development and implementation of macroprudential
policies are still at an early stage. In the area of systemic risk monitoring, efforts have
focused on closing data gaps and on developing better indicators and models to assess
systemic risk. With respect to macroprudential tools, new instruments have been developed
– for example, international agreement was reached on the introduction of countercyclical
capital buffers and additional loss absorbency for global systemically important banks – and
experience with the use of existing ones has been shared among policymakers. On the
governance front, a number of jurisdictions have been adjusting institutional arrangements to
support macroprudential policy, based on analyses identifying desirable characteristics of
such governance frameworks. This includes work on the two appropriate objectives for
macroprudential policies – increasing the resilience of the financial system and leaning
against the financial cycle – and on principles for their design and operation (see
CGFS (2010a) and FSB-BIS-IMF (2011); Annex 1 provides seven broad principles for the
design and operation of macroprudential policy, as originally formulated by the CGFS in
2011). In contrast, practical issues of policy implementation have so far received less
attention.
One such practical challenge is how to select and apply macroprudential policy instruments
(MPIs). To help answer this question, this report provides guidance on how to assess three
high-level criteria for determining MPI selection and application:1
(i) the ability to determine the appropriate timing for the activation or deactivation of the
instrument;
(ii) the effectiveness of the MPI in achieving the macroprudential policy objective of
limiting systemic risk; and
(iii) the efficiency of the instrument in terms of a cost-benefit assessment. 2
In trying to operationalise these criteria, the report proposes a number of practical tools that
can aid the assessment of individual MPIs. Specifically:
(a) To help policymakers determine the appropriate timing for the activation and
deactivation of MPIs, the report lays out stylised scenarios in which MPI settings
may be tightened or released. The identification of these states is facilitated by two
alternative approaches that seek to link systemic risk analysis and MPI selection.
1
The logic and interaction of these criteria are illustrated in a simple theoretical framework, as described in
Annex 2, that conceptualises MPI choice for a given policy objective.
2
For the purposes of this report, the effectiveness of MPIs refers to their capacity to fulfil the objective of limiting
systemic risk by enhancing resilience or leaning against the credit cycle. Efficiency, in turn, reflects their ability
to achieve this objective at the lowest cost in terms of negative repercussions for other policy areas or the
economy as a whole.
CGFS – Operationalising the selection and application of macroprudential instruments 3(b) To support the evaluation of the effectiveness and efficiency of MPIs, “transmission
maps” are being proposed as a practical tool for the evaluation of macroprudential
instruments. These maps provide a stylised representation of how changes in
individual MPIs are expected to contribute to the objectives of macroprudential policy
as well as how they may interact with the objectives pursued in other policy areas.
In general, macroprudential instruments can be defined as primarily prudential tools that are
calibrated and explicitly assigned to target one or more sources of systemic risk (see Box 1).
While this gives rise to a large number of potential instruments, the focus of this report is on
a small range of MPIs whose calibration can be varied over the cycle.3 Specifically, the
Box 1
Macroprudential policy frameworks: a short review
The basic features of macroprudential policy frameworks have been laid out in previous CGFS
work, such as CGFS (2010a), as well as in reports published by other institutions, including
FSB-BIS-IMF (2011). As discussed in more detail there, the main goal of macroprudential policies is
to reduce systemic risk, defined as the risk of widespread disruptions to the provision of financial
services that have serious negative consequences for the real economy. As such, macroprudential
policy focuses on the interactions between financial institutions, markets, infrastructure and the
wider economy. It complements the microprudential focus on risk positions of individual institutions,
which largely takes the rest of the financial system and the economy as given.
In articulating the practical objectives of macroprudential policy, two aims can be distinguished
(CGFS (2010a)). The first is to strengthen the resilience of the financial system to economic
downturns and other adverse aggregate shocks. The second is to actively limit the build-up of
financial risks. Such leaning against the financial cycle seeks to reduce the probability or magnitude
of a financial bust. These aims are not mutually exclusive, and they both go beyond the purpose of
microprudential policy with its focus on insuring that individual firms have sufficient capital and
liquidity to absorb shocks. Macroprudential policy takes risk factors into account that extend further
than the circumstances of individual firms. These include shock correlations and the interactions
that arise when individual firms respond to shocks. Such factors determine the likelihood and
consequences of the systemically important shocks that macroprudential policy seeks to mitigate.
To achieve these macroprudential aims, CGFS (2010a) and IMF (2011a) review a broad range of
existing and proposed instruments. In general, macroprudential instruments can be defined as
primarily prudential tools that are calibrated to target one or more sources of systemic risk, such as
excessive leverage, excessive liquidity mismatches, too much reliance on short-term funding or
interconnectedness.
_____________________
Between these two macroprudential aims, leaning against the financial cycle is the somewhat more
ambitious target. Accountability measures appear to be more straightforward to construct for an objective of
strengthening the resilience of the financial system, given the long experience gained with (micro-)prudential
interventions aimed at maintaining the resilience of individual institutions. By contrast, the concept of the
financial cycle and its sensitivity to macroprudential interventions remain less well understood – a fact that
supports a careful approach until more practical experience has been gained (CGFS (2010a)). In
addition, some non-prudential tools, such as infrastructure policies, can also from part of the overall
macroprudential toolkit. Yet, these tools would need to clearly target systemic risk to be considered
macroprudential (FSB-BIS-IMF (2011)).
3
Based on an informal survey, the tools discussed in this report were identified by the majority of members as
promising or practical MPIs in their jurisdiction. Future work could provide guidance on how to operationalise
other important macroprudential tools, in particular those addressing the cross-sectional dimension.
4 CGFS – Operationalising the selection and application of macroprudential instrumentsanalysis is limited to providing as much detailed guidance as possible on capital-based tools
(eg countercyclical capital buffers, sectoral capital requirements and dynamic provisions),
liquidity-based tools (eg countercyclical liquidity requirements) and asset-side tools (loan-to-
value (LTV) and debt-to-income (DTI) ratio caps). However, many of the findings presented
here also apply to other instruments.
The remainder of the report is organised as follows. Section 2 provides guidance on how to
determine the appropriate timing for the application of MPIs. Section 3 explores the
transmission mechanism of capital-based, liquidity-based and asset-side MPIs. Where
possible, the analysis is supplemented with empirical evidence to provide some indications of
the effectiveness and efficiency of different MPIs. The last section concludes with a set of
nine practical questions and answers that can be helpful in guiding the selection and
application of macroprudential tools.
2. Determining the appropriate timing for the activation or
deactivation of MPIs
The ability to identify and measure systemic risks and vulnerabilities is a key factor for
successfully implementing MPIs, because imprecise timing of MPI application can result in
overshooting or undershooting of macroprudential objectives.4 Costs of a mistimed activation
are asymmetric, as delayed action is generally more costly than a premature intervention.
During the build-up phase of any vulnerability, delayed activation may imply that MPIs are
less effective or even ineffective as there is insufficient time for them to gain traction.
Alternatively, it may even initiate the disorderly unwinding of imbalances that have been built-
up. In both cases, crises may materialise. Implementing MPIs too early, in contrast, is likely
to incur unnecessary regulatory costs and may weaken the impact of the chosen instrument,
as market participants will have more time to develop strategies to avoid and arbitrage them.
During the release phase, on the other hand, deactivating MPIs too early may give market
participants a wrong signal, whilst releasing them too late may amplify procyclical effects, as
banks may have to deleverage more to satisfy additional macroprudential buffers.
In stylised terms, two approaches linking systemic risk assessments and MPI activation can
be distinguished: (i) a top-down systemic risk approach; and (ii) a bottom-up tools-based
approach. While the two approaches are generally mixed in practice, it is conceptually useful
to look at them separately.
Top-down approach
Under the top-down approach, policy decisions are guided by a general, comprehensive,
system-wide risk assessment. Decisions are taken in light of an accepted model which
properly captures the links between systemic risk, market dynamics and macroprudential
policy choices. Potential policy actions, by means of one or more instruments, are guided by
the signals received from a combination of indicators and forecasting models. In an ideal
world, such a top-down approach would allow for an assessment of the impact that particular
macroprudential policy actions would have, including their effectiveness in reducing systemic
4
The experience of imposing quantitative limits on real estate lending by Japan in the early 1990s provides an
illuminating example of how important the appropriate timing is. In this case, a quantitative ceiling on banks’ real
estate loans was introduced in March 1990, right before land prices peaked in early 1991. This measure came
too late to achieve the goal of preventing excessive increases in land prices and ended up accelerating the
decline in land prices. This example also shows how important it is to avoid regulatory arbitrage. The ceiling on
the extension of real estate loans by banks encouraged the expansion of brokered loans placed through
non-banks, parts of Japan’s shadow banking system. As a result, the original goal was not achieved in Japan.
CGFS – Operationalising the selection and application of macroprudential instruments 5risk as well as their associated costs, possible side effects, and interactions with other policy
objectives. This approach should, in principle, allow for the selection and use of the most
effective instrument(s).
The main downside of the top-down approach is that a generally accepted theoretical and
empirical framework for using macroprudential instruments is not yet available. And given the
multifaceted nature of systemic risk, it is unclear whether this can be really achieved, even
though progress has been made in developing key elements of such a framework.5
Bottom-up approach
The bottom up, instrument-based approach starts with a set of instruments and assesses the
vulnerabilities they can address and the types of indicators that should be used to trigger
their implementation and release. A key advantage of this approach is that it is more
tractable than the systemic top-down approach in at least three respects. First, it allows for a
direct and in-depth understanding of the basic features of each instrument without requiring
the ex ante development of a general analytical framework. Second, it is less prone to model
risk. Third, and depending on country characteristics, it is possible to build on the experience
gained by other countries in using particular MPIs.
These advantages in implementing bottom-up approaches come with a number of potential
downsides. Most importantly, potential spillovers, second-round effects and general-
equilibrium effects of the respective policy measures are hardly, if at all, captured, even
though they can dominate first-round effects. As such, particular vulnerabilities may be
missed if they fall outside the range of instruments considered. The instrument-based
approach may also neglect to take account of interactions with other policy objectives as well
as interaction between MPIs, which are important to assess, as some vulnerabilities may be
best addressed with a mix of instruments.
In the absence of a fully fledged top-down approach, it is useful as a first step to clarify in
which high-level situations MPIs should be activated or released. In a second step, it is helpful
to identify indicators that can provide real-time information about the scenario policymakers
face. In the last step, policymakers have to bring this information together to determine the
appropriate policy action. The contours of such an approach are outlined below.
2.1 Stylised scenarios for the activation and release of MPIs
As a starting point to judge the appropriate timing for the activation and release of MPIs,
Table 2.1 sets out six scenarios which are deliberately stylised to focus on a limited number
of key characteristics. In particular, they abstract from cross-border problems and the
possibility that different vulnerabilities may emerge at different times. Both these questions
are addressed below, once the scenarios have been covered in more detail.
Independently of whether the macroprudential objective is to increase resilience or to lean
against the financial cycle (which is rather ambitious; see Box 1), macroprudential policies
are designed to respond to or target developments in the financial cycle. Thus, the stage of
the financial cycle is the main determinant in guiding the activation and release of MPIs. Yet,
as financial cycles are considerably longer and more pronounced than standard business
cycles,6 other macroeconomic conditions need not move in sync with the financial cycle, and
it is important for macroprudential policymakers to take this cyclical backdrop into account.
5
For recent theoretical contributions see eg Adrian and Boyarchenko (2012), He and Krishnamurthy (2012) or
Goodhart et al (2012a).
6
See eg Aikman et al (2010), Claessens (2011) or Schularick and Taylor (2012).
6 CGFS – Operationalising the selection and application of macroprudential instrumentsTable 2.1
High-level scenarios for the activation and release of MPIs1
Financial cycle
Bust
Boom
With crisis Without crisis
Leave unchanged
Tighten
Strong or release
Other (Scenario 1)
(Scenario 4)
macroeconomic
conditions Leave unchanged
Release2 Release
Weak or tighten
(Scenario 3) (Scenario 5)
(Scenario 2)
1
Macroprudential policies are designed to respond to or target the financial cycle, taking other macroeconomic
2
conditions as a cyclical backdrop. To resolve some crises, it may be necessary to increase the overall level
of capital and liquidity in the system to restore market confidence. As discussed in detail in Section 3.4, the
effectiveness of releasing MPIs in such situations depends critically on several factors, such as the appropriate
timing and the impact on market expectations.
The suggested policy action that is likely to be the least controversial applies when the
financial cycle is booming and the real economy is strong (Scenario 1). In this case, provided
that the build-up of a particular vulnerability can be reliably identified (see below), tightening
MPIs seems self-evident to achieve both macroprudential objectives. The years in the run-up
to the global crisis in many economies are the prime example in this regard.
The optimal course of policy may be less apparent when the financial cycle is booming,
whilst the real economy is weak, potentially leading to higher loss rates on loans and similar
instruments (Scenario 2). However, the release of MPIs may not be justified as long as a
systemic risk event fails to materialise. Policymakers may thus want to leave MPI settings
unchanged or even tighten them as long as the financial cycle continues to expand rapidly.
An example of such a situation could be the shallow recession in some countries in the early
2000s, which coincided with rapid credit expansion and house price increases.
For the release phase, it is important to differentiate whether the downswing of the financial
cycle coincides with a financial crisis or not. In a crisis context, MPIs may need to be
released to avoid excessive deleveraging (Scenario 3). However, to resolve some crises, it
may be necessary to increase the overall level of capital and liquidity in the system to restore
market confidence – as was, for example, the case after the Supervisory Capital Assessment
Program (SCAP) in the United States in 2009. As discussed in detail in Section 3.4, the
effectiveness of releasing MPIs in such situations depends critically on several factors, such
as the appropriate timing and the impact on market expectations.
At the same time, downswings in the financial cycle do not necessarily lead to crises. One
example for this kind of scenario may be Germany in the early 2000s, which then
experienced severe stress in parts of the banking sector. While output growth was very
weak, no outright failures in the banking system occurred. In such a situation (Scenario 5),
releasing previously tightened MPIs may be warranted to soften the impact of the downturn
and avoid the asset disposals and bank deleveraging that might otherwise be necessary if
MPI settings were to be held fixed.
Arguably, providing guidance for macroprudential policymakers is most difficult when the real
economy is booming but the financial cycle has turned or is about to do so (Scenario 4). This
happened, for example, in 2007, when money markets started to freeze, yet the real economy
continued to expand for more than a year in a large number of economies and it was not yet
obvious that a systemic crisis was about to crystallise. On the one hand, a release in this
CGFS – Operationalising the selection and application of macroprudential instruments 7situation may have helped to absorb part of the impact of the turning financial cycle, thereby
reducing the severity of the crisis. On the other hand, it may have also sent the wrong signal
to markets, delaying the appropriate responses by banks and other market participants. The
balance of these risks will be highly situation-dependent, so that no clear indication can be
given ex ante whether it is optimal to release MPIs or keep them unchanged.
In a more benign situation, the economy could expand whilst the financial cycle is in a
downswing, as systemic risk subsides smoothly. This would be the ideal outcome, if
macroprudential policies are successful in leaning against the cycle. In this case, a gradual
release seems appropriate.
A complicating factor in thinking through the scenarios laid out above is international
interlinkages. Whereas Table 2.1 takes a domestic perspective, internationally active banks
and other financial institutions are exposed to a range of financial and real cycles, which are
not necessarily synchronised. The same applies to most asset markets, which are inherently
global. This suggests that, in many cases, macroprudential requirements applied to a bank’s
globally consolidated balance sheet cannot be determined by developments in one country
alone. Rather, they would need to reflect changes in systemic risk and the macroprudential
policy stance in the countries where the ultimate exposures reside. This may require
international coordination – for example, through reciprocal arrangements applying to cross-
border loans.7
Table 2.1 also abstracts from the possibility that different financial vulnerabilities may emerge
at different times. While this does not affect the broad guidance for the build-up and release,
different indicators are potentially useful for guiding different instruments, as discussed in
more detail in the following.
2.2 Indicators to guide MPIs: a three-step identification approach
Judging the state of the economy to determine the appropriate policy action is not as clear-
cut in practice as the discussion of Table 2.1 suggests. Given the lack of a fully fledged
top-down approach, macroprudential indicators will play a crucial role in helping
policymakers to identify the scenario they are faced with. This, in turn, raises the issue of
how these indicators should be selected. As monitoring frameworks for the real economy are
well established, the discussion here focuses entirely on the financial cycle. The link between
risk assessment and MPI application is discussed in greater detail in Section 2.3.
The complexities of real-world policymaking suggest that, to be useful for policy
implementation, macroprudential indicators would ideally be available in real time, while
being robust, so that signals are noise-free and comparable across time. Robustness also
requires that indicators are difficult to manipulate by individual institutions or market
participants. Practical challenges in establishing robust indicators, which are compounded by
data availability issues, are discussed in more detail in Annex 3.
Table 2.2 highlights a set of potential indicators that are useful in measuring the broad state
of the financial cycle. Many of these indicators, such as credit developments or banking
sector indicators, are slow-moving.8 As a result, they have been found to be more suitable in
7
This is, for instance, the case for the countercyclical capital buffer under Basel III, where banks’ total
countercyclical capital buffers are a weighted average of capital buffer requirements determined by
policymakers in the various jurisdictions that the bank is exposed to (see Basel Committee (2010b)).
8
A downside of these types of indicators is that they are generally not available in real time and are only
updated infrequently. This contrasts with market-based indicators or systemic risk measures based on market
8 CGFS – Operationalising the selection and application of macroprudential instrumentsTable 2.2
Capturing the financial cycle: some useful indicators
Macroeconomic indicators Broad credit aggregates
Measures of debt sustainability (debt to income, debt service ratio)
Banking sector indicators Stress tests, bank risk metrics
Leverage ratios
Maturity and currency mismatch
Indicators of funding vulnerabilities
Profits and losses
Market-based indicators Asset valuations in equity and property markets
Corporate bond and CDS spreads and risk premia
Margins and haircuts
Lending spreads
Qualitative information Underwriting standards
Asset quality
Credit conditions
guiding the activation of MPIs (eg the build-up of buffers). For the same reason, they will be
less useful in guiding the rapid release of policy instruments during crises, even though they
may still be helpful in steering a more gradual release (ie, in cases when the financial cycle is
in a downswing but no crisis emerges).
Indicator identification: three steps
A key challenge in the operationalisation of macroprudential policy is to narrow down the
broad list of candidate indicators depicted in Table 2.2, and to assess how they relate to
particular vulnerabilities, to then assign them to individual (classes of) MPIs. A three-step
approach is being proposed for this purpose:
As a first step, Table 2.3 identifies potential indicators that could guide the build-up of the
instruments discussed in this report. Indicator selection is being guided by three broad
criteria: (i) relevance for the MPI, (ii) ease of data availability and (iii) simplicity (ie the ability
to easily communicate and replicate).
Step 2 requires a more rigorous assessment of the empirical robustness of candidate
indicators to guide the build-up or activation of specific MPIs. To provide a benchmark, it is
useful for such an assessment to start with a cross-country analysis, which is then brought to
the country level to account for potential country-specific factors. With the exception of
countercyclical capital buffers and dynamic provisions, little empirical work has been done in
this area. While a complete empirical assessment of the usefulness of each variable in
Table 2.3 goes beyond the focus of this report, Section 2.2.1 below details the practical steps
data such as Acharya et al (2012), Adrian and Brunnermeier (2008) or Huang et al (2011). Yet, some of these
indicators can be relatively noisy. Future work would therefore be useful to assess the robustness of market
indicators as empirical guides for the calibration of macroprudential measures and the safeguards which need
to be deployed while using them.
CGFS – Operationalising the selection and application of macroprudential instruments 9Table 2.3
Policy instruments and potential indicators
Policy instrument Potential indicators
Capital-based instruments
Countercyclical capital buffers1 Measures of the aggregate credit cycle
1
Dynamic provisions Bank-specific credit growth and specific provisions (current and
historical average)
Sectoral capital requirements Measures of the price and quantity of different credit
aggregates (stock and new loans) on a sectoral basis:
interbank credit, OFIs, non-financial corporate sector and
households
Measures of sectoral concentrations
Distribution of borrowing within and across sectors
Real estate prices (commercial and residential, old and newly
developed properties)
Price-to-rent ratios
Liquidity-based instruments
Countercyclical liquidity LCR and NSFR
requirements
Liquid assets to total assets or short-term liabilities
Loans and other long-term assets to long-term funding
Loan-to-deposit ratios
Libor-OIS spreads
Lending spreads
Margins and haircuts in markets Margins and haircuts
Bid-ask spreads
Liquidity premia
Shadow banking leverage and valuation
Market depth measures
Asset-side instruments
LTVs and DTIs Real estate prices (commercial and residential, old and newly
developed properties)
Price-to-rent ratios
Mortgage credit growth
Underwriting standards
Indicators related to household vulnerabilities
Indicators of cash-out refinancing
1
To steer the application of countercyclical capital buffers and dynamic provisions, a range of indicators is
useful. However, the table only shows the indicators which have been officially proposed or implemented (for
countercyclical capital buffers, see Basel Committee (2010b); for dynamic provisions, see Saurina (2009)).
10 CGFS – Operationalising the selection and application of macroprudential instrumentsnecessary, based on a selection of indicator variables that can help gauge the potential
build-up of vulnerabilities in the household sector.
Step 3 concerns the release phase. The scenarios discussed above highlight that, for the
release of MPIs, policymakers have to assess whether there is a downswing in the financial
cycle and whether there is a crisis or not. If not (Scenarios 4 and 5 in Table 2.1), a more
gradual release may be warranted. In this case, indicators that are useful in steering MPI
activation, such as the ones shown in Table 2.3, can be used to guide the release as well,
because a return to more normal levels would signal that systemic risks have subsided.When
crises emerge, they tend to erupt quickly (Scenario 3 in Table 2.1). In this case, many of the
more slow-moving indicators highlighted above cannot be relied upon to inform the need to
relax MPI settings. This suggests that market-based indicators, which are available at high
frequencies, have an important role to play.9 In addition, a more detailed analysis of banks’
balance sheets, building on supervisory information, may be warranted to judge whether
system-wide stress is about to materialise. Some indicators for this purpose are shown in
Table 2.4. However, there is little empirical evidence capturing the performance of these
indicators for crises except the most recent one. In this case, market-based indicators turned
out to provide good signals of the onset of the crisis, even though they also issued warning
signals for non-crisis countries like Canada, indicating that their reliability needs further
evaluation.10
Table 2.4
Potential indicators to signal systemic crises
Market-based indicators Liquidity conditions in money markets
Credit and CDS spreads
Market risk premia and systemic risk measures
Margins and haircuts
Banking sector indicators Stress tests, risk metrics
Profitability
Losses
Lending standards
2.2.1 Evaluating macroprudential indicators: systemic risk in the household sector
This section illustrates the selection of robust indicators for the build-up phase of financial
imbalances, based on the example of risks in the household sector. As such, the proposed
process would form part of the implementation of MPIs that target this specific vulnerability,
such as LTV or DTI caps, sectoral capital requirements and buffers related to household risk.
To provide a benchmark, the analysis starts with a cross-country analysis, which is then
brought to the country level to illustrate how country-specific differences can potentially be
accounted for.11
9
See also IMF (2011b).
10
For a statistical assessment of the performance of indicators for the release of MPIs, see Drehmann et al (2011).
11
While it is important to take account of country-specific characteristics, there is a risk of overemphasising such
factors, which could bias policymakers in the direction of “this country (or time) is different”. Across time and
CGFS – Operationalising the selection and application of macroprudential instruments 11Cross-country analysis
Two broad categories of indicators are analysed, which together should provide useful and
complementary information about the build-up of systemic risks in the household sector:
variables related to credit developments and variables measuring developments in the
residential housing market. Table 2.5 lists the specific indicators, which are a refinement of
the class of indicators listed in Table 2.3 above.12
In general, a good indicator for the build-up or activation of MPIs is characterised by a
systematic pattern prior to the onset of crisis episodes – such as high and increasing levels
for instance – thus providing a persistent signal if imbalances are building up, and no false
warnings during normal times. In addition, an ideal indicator would also provide the
appropriate signals for the release, either rapidly in the case of crises or more gradually if
imbalances unwind smoothly. It is unlikely in practice, though, that a single indicator can
provide reliable signals with such different characteristics.
All indicators listed in Table 2.5 provide useful signals about the build-up of vulnerabilities
ahead of crises. However, as expected, they are not well suited to guide releases once
crises materialise. This can be seen from Graph 2.1, which presents average developments
for each indicator variable around systemic crises.13 All indicators rise prior to a crisis, but
some, such as the credit-to-GDP gap, continue to rise for some quarters even after the onset
Table 2.5
Potential indicators to measure risks in the household sector
Credit variables
Credit-to-GDP gap: deviation from a long-term trend (Basel III reference indicator)
Household credit-to-GDP: deviation from a long-term trend1
Annual growth rate in real household credit: deviation from a 15-year rolling average
Aggregate debt service ratio: deviation from a 15-year rolling average
Residential property market indicators
Annual growth rate in real residential property prices: deviation from a 15-year rolling average
Residential property prices over rents: deviation from a long-term trend1
1
Long-term trends are calculated as for the credit-to-GDP gap under Basel III (Basel Committee (2010b)).
countries and in different stages of development, certain indicators (eg excessive leverage and exuberant
asset prices) have been shown to be a persistent feature ahead of financial crises (see eg Reinhart and
Rogoff (2009) or Schularick and Taylor (2012)). A conservative approach for macroprudential policies could
take these regularities into account by following the international benchmark unless country-specific factors
suggest a more proactive policy stance.
12
Many of the indicators listed in Table 2.3 have trends, which have to be removed to achieve comparability
across time and countries. For the purposes of this report, this is done by using either statistical filters or long-
run averages (see also discussion on detrending in Annex 3).
13
Depending on data availability, at most 19 different crisis episodes in 11 countries are considered. Crisis dates
are based on the IMF database (Laeven and Valencia (2012)) and conversations with central banks.
12 CGFS – Operationalising the selection and application of macroprudential instrumentsGraph 2.1
Developments of indicators around crises
In percentage points
Credit-to-GDP gap HH credit-to-GDP gap HH credit growth
30 10 10
Mean
th th
25 and 75 percentiles
20 5 5
10 0 0
0 –5 –5
–10 –10 –10
–16 –12 –8 –4 0 4 8 12 16 –16 –12 –8 –4 0 4 8 12 16 –16 –12 –8 –4 0 4 8 12 16
Debt service ratio Residential property price growth Price-to-rent gap
9 16 40
6 8 20
3 0 0
0 –8 –20
–3 –16 –40
–16 –12 –8 –4 0 4 8 12 16 –16 –12 –8 –4 0 4 8 12 16 –16 –12 –8 –4 0 4 8 12 16
The horizontal axis depicts plus/minus 16 quarters around a crisis, which is indicated by the vertical line. Zero on the vertical axis
corresponds roughly to the average in non-crisis periods. The historical dispersion of the relevant variable is taken at the specific
quarter across crisis episodes. Depending on data availability, at most 19 different crisis episodes in 11 countries are considered. For
a definition of variables, see Table 2.5.
Sources: National data; BIS calculations.
of the crisis, suggesting that they are not well suited to signal the appropriate release time. In
contrast, valuation-based indicators, such as the price-to-rent gap or the residential property
price gap, tend to peak four to eight quarters prior to the crisis. The debt service ratio is
closest to being a contemporaneous indicator.14 The width of the 25–75 percentile bands
indicates that some indicators provide very tight signals in the run-up to crises, while others
are noisier.
On this basis and a statistical analysis (see Annex 3), the credit-to-GDP gap, the debt
service ratio, the growth in residential property prices and their gap turn out to have been
useful indicators in signalling past crises. Variables involving household credit, in turn,
appear less reliable.
14
The construction of aggregate debt service ratios and their early warning properties for systemic crises are
analysed by Drehmann and Juselius (2012).
CGFS – Operationalising the selection and application of macroprudential instruments 13Country-level analysis
The next step in the selection of indicators is to break down cross-country evidence to the
country-level. This step is illustrated below for the case of two candidate indicators: the
credit-to-GDP gap and the price-to-rent gap. Both of these have been identified during the
first stage of the analysis as providing useful signals in the build-up phase of the cycle. In
addition, they are not highly correlated with each other. This suggests that their information
could be considered complementary and should be combined using either judgment or
statistical techniques (see Annex 3 for a description of how this could be done).
To highlight potential issues for country-level analysis, Graph 2.2 depicts the evolution of the
two indicators around crisis periods for four countries (see Annex 3 for the remaining
countries where both indicators were available). The vertical black lines denote financial
crises and the vertical orange lines indicate other periods of interest, as discussed below.
The red horizontal lines highlight the critical threshold, determined by statistical tests for the
price-to-rent gap, while the green horizontal lines are the critical thresholds suggested under
Basel III for the credit-to-GDP gap.
Graph 2.2
Price-to-rent and credit-to-GDP gaps for selected countries1
In percentage points
Price-rent gap2
Australia Switzerland Sweden United Kingdom
60 60 60 60
40 40 40 40
20 20 20 20
0 0 0 0
–20 –20 –20 –20
–40 –40 –40 –40
85 90 95 00 05 10 85 90 95 00 05 10 85 90 95 00 05 10 85 90 95 00 05 10
Credit-to-GDP gap3
Australia Switzerland Sweden United Kingdom
40 40 40 40
30 30 30 30
20 20 20 20
10 10 10 10
0 0 0 0
–10 –10 –10 –10
–20 –20 –20 –20
–30 –30 –30 –30
85 90 95 00 05 10 85 90 95 00 05 10 85 90 95 00 05 10 85 90 95 00 05 10
1
The black vertical lines indicate the beginning of systemic banking crises. The orange vertical lines indicate stress periods that did
not result in crises. 2 The red horizontal line is the critical threshold (24 pps), determined by the statistical tests described in
Annex 3. 3 The credit-to-GDP gaps are based on bank credit to the private non-financial sector, using the same definitions as the
countercyclical capital buffer guidance document (Basel Committee (2010b)). For Sweden, this includes lending from Swedish
branches outside Sweden to non-resident entities. The green horizontal lines are critical thresholds as determined by Basel Committee
(2010b). At 2 pps, the guidance given by the credit-to-GDP gap would suggest that buffers should start to accumulate. At 10 pps, the
gap would suggest that buffers should have reached their maximum.
14 CGFS – Operationalising the selection and application of macroprudential instrumentsOverall, the graph confirms that both indicators provide useful signals, as suggested above,
albeit with different lead and lag structures around crises. Comparing statistical cross-country
evidence with a country-specific perspective, several issues stand out.
First, the indicators under consideration are imperfect in that they issue wrong signals
(ie they may signal a crisis without one materialising and vice versa, as highlighted by the
orange lines in Graph 2.2). In Switzerland, for instance, one major bank required government
support during the recent global crisis, but the indicators presented here correctly identified
no domestic vulnerabilities. The reason for this dichotomy was losses stemming from
oversees exposures, rather than domestic vulnerabilities, highlighting the importance of
cross-border positions for macroprudential policy purposes (see Section 2.1).
Equally, the build-up of vulnerabilities as signalled by the indicators does not necessarily
mean that crises will erupt. This was, for example, the case in Australia in the early 2000s,
where imbalances decreased after Australian authorities implemented a series of measures
targeting the exuberant residential property sector, which could be considered
macroprudential.15 Rather than mechanically relying on specific indicators, though, the
Australian authorities used a broad a range of information and supervisory judgment.
Second, structural features might render an indicator inappropriate as a reference point for
MPIs in a particular country. One example is the price-to-rent gap in Sweden, which would
have signalled vulnerabilities persistently since 1998. The housing market in Sweden is,
however, characterised by a high degree of regulation, with rents in the public housing sector
effectively capping those in the private sector. As a result, observed rents generally do not
reflect the market value of the rented units, implying that the price-to-rent ratio cannot
provide reliable information.
2.3 Linking systemic risk assessment and MPI selection
An overarching question that policymakers have to decide on is whether they want to link
systemic risk assessments and MPI application in a rules-based or discretionary fashion. The
principal trade-offs of both approaches are also discussed in detail in previous reports, such
as CGFS (2010a).
Rules versus discretion
A rules-based application relies on indicators to provide correct signals for the build-up and
release. Given the identification problems described above, this can raise serious calibration
issues. In addition and depending on the policy implementation, the Lucas critique may also
apply, ie the underlying dynamics may change once the policy is in place. However, a rules-
based approach has the benefit of being very transparent, is easily communicated and may
act as a commitment device to “take the punch bowl away once the party gets going”.
Alternatively, policymakers may want to act in a discretionary manner. In this case,
policymakers would typically try to use as much information as possible and rely on judgment
in drawing this information together. In this context, warning signals issued by indicators
would tend to act as triggers for deeper analysis, which could involve the use of more formal
methods, such as stress tests (see Box 2 in Section 3 below) or full-scale financial stability
15
In particular, APRA undertook a rigorous industry-wide stress test in 2003 designed around a scenario of a
severe housing bust. The results of this test spurred it to introduce a more risk-sensitive capital framework for
high risk exposures to the household sector and significantly raise minimum regulatory capital requirements
for the mortgage insurance sector as well as tighten other prudential standards.
CGFS – Operationalising the selection and application of macroprudential instruments 15models.16 Practical experience has also shown that qualitative information can play an
important role. For example, the implementation of macroprudential measures for the real
estate sector in India was guided by supervisory judgment based on a softer type of
information such as evidence of lax underwriting standards, a few fraud cases, anecdotal
evidence of inventory build-up and emerging signs of underpricing of risks due to spiralling
real estate prices (Table 2.6 suggests some questions that could be useful starting points to
elicit this type of soft information during the build-up phase).
Table 2.6
Potential questions to provide qualitative information about the build-up of
vulnerabilities
Are there signs of speculative behaviour?
Are particular asset classes heavily advertised or discussed in the media?
Are banks taking large positions where profits continuously exceed measured risks?
Are there relatively new products with large market shares, and have they been increasing rapidly?
Are lending standards falling?
Are profit margins decreasing?
Is competition increasing from the shadow banking sector?
Addressing measurement uncertainty
Measurement uncertainty is another issue that policymakers have to take into account. In
part, this uncertainty is inherent to problems of measuring systemic risk, as fragilities emerge
infrequently and often in new and unexpected ways. However, uncertainties also arise from
problems common to other policy areas, such as delays in data reporting or conflicting
messages arising from different sources of information.
The uncertainty of risk assessments has to be set against the cost of mistiming the
application of MPIs. While the assessment of this trade-off is situation-dependent,
policymakers can use different strategies to cope with it.
If the uncertainty is very large, but there is a clear sense of an underlying vulnerability, they
may want to implement MPIs which are not time-varying.17 Similarly, if policymakers are
confident that vulnerabilities are building up in a particular sector, sectoral capital
requirements could be the appropriate tool. However, such an assessment would also need
to take into account that spillovers from a small sector often tend to have broader, system-
wide effects.18 In cases where uncertainties around the source of exuberance and potential
spillovers are too large, a system-wide countercyclical buffer may be more appropriate.
Alternatively, when the reliability of underlying risk weights is in doubt, a risk insensitive
16
For a survey of financial stability models for policy purposes, see Bisias et al (2012). For a more detailed
discussion of the advantages of two-stage frameworks for systemic risk monitoring, see Eichner et al (2010)
and Cecchetti et al (2010).
17
See Annex 2 as to why this could be an optimal response in theory.
18
For example, a detailed analysis of spillovers from the household sector to the broader economy is provided
by Sveriges Riksbank (2011).
16 CGFS – Operationalising the selection and application of macroprudential instrumentsinstrument such as a leverage ratio may be a useful tool. Another strategy to manage
uncertainty in risk assessments is based on gradualism, which Asian policymakers have
tended to rely on in their application of macroprudential policies. That is, policymakers may
adjust MPIs in small steps and sufficiently early, retaining the ability to observe the impact
and change the setting, if necessary.
Taking account of instrument characteristics and the policy process
The appropriate timing for the application of MPIs also depends on inherent characteristics of the
instruments and the policy process. For example, once the legal and operational infrastructure is
in place, LTV and DTI caps can be implemented rather rapidly. On the other hand, banks may
need possibly several months to adjust to higher capital or liquidity requirements without being
forced into fire sales or deleveraging, unless these are applied just to the flow of new lending
(see Annex 5 for a discussion). The policy process may also take some time, as for example
data are reported with lags. In addition, in many cases the application of MPIs does not
completely rest with one authority, but measures are often discussed and information is shared
among a group of relevant agencies through inter-agency groups, which may prolong the
process further. These considerations favour starting the process of adjusting MPIs early, and
relying on instruments for which knowledge about any implementation lags already exists.
3. The transmission mechanism of MPIs
To select the appropriate MPIs, policymakers have to judge which instruments can effectively
and efficiently address an identified vulnerability. This section studies the conceptual
transmission mechanism for a range of MPIs to illustrate key aspects of how the efficiency
and effectiveness of instruments could be judged in practice.
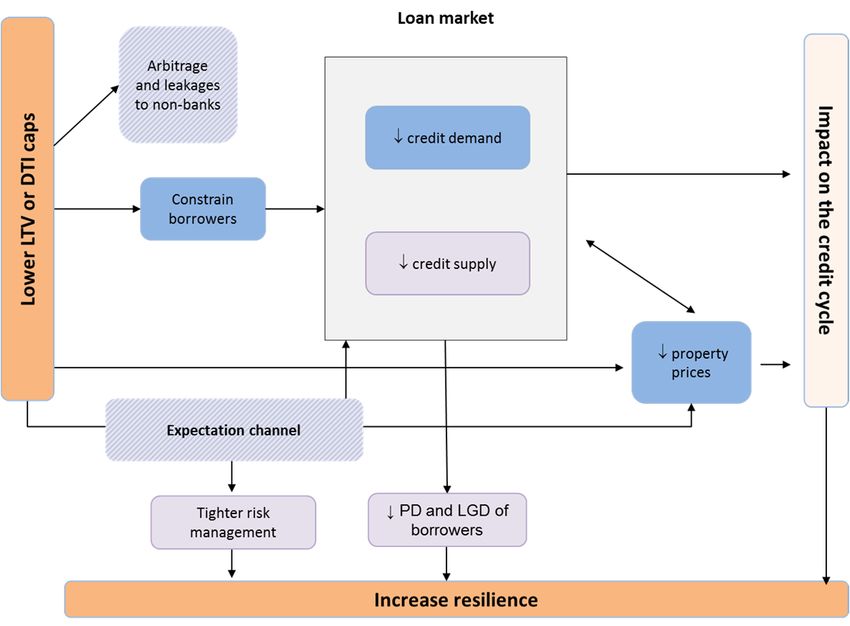
As a practical tool, “transmission maps” are proposed to draw attention to the main
transmission channels through which MPIs can achieve the macroprudential objectives of
increasing resilience and leaning against the credit cycle.19 Both objectives are highlighted,
even though the latter (“leaning”) is the more ambitious one, which, if pursued, implies a
careful approach until more practical experience has been gained with the impact of MPIs on
the credit cycle (see CGFS (2010a) and Box 1).
Where possible, the analysis is supplemented with empirical evidence to provide some
indications of the effectiveness and efficiency of different MPIs, as a full cost-benefit analysis
of different tools is likely to be highly state-dependent in practice and fraught with
uncertainties in the absence of a usable top-down approach. The main aim of the discussion
is, therefore, to provide a clearer narrative on the transmission channels through which the
tools can achieve the two macroprudential objectives.
The build-up and release phases are analysed separately, as the dynamics may differ,
starting with the tightening phase of capital-based, liquidity-based and then asset-side tools.
Subsequently, potential interactions between MPIs as well as with other policy areas are
discussed.
19
The transmission maps are stylised representations of the transmission mechanism of MPIs, highlighting the
key channels through which MPIs can achieve both macroprudential objectives. As such, they abstract from
potential second-round effects, like the feedback from the credit cycle to output, which in turn may impact on
leverage, asset prices and risk-taking.
CGFS – Operationalising the selection and application of macroprudential instruments 17You can also read