Genetic Biomarkers of Psychiatric Disease: Discriminating Bipolar Disorder From Major Depressive Disorder With Polygenic Risk Scores
←
→
Page content transcription
If your browser does not render page correctly, please read the page content below
Genetic Biomarkers of Psychiatric
        Disease: Discriminating Bipolar
        Disorder From Major Depressive
      Disorder With Polygenic Risk Scores
                  The Harvard community has made this
               article openly available. Please share how
               this access benefits you. Your story matters

Citation              Liebers, David. 2020. Genetic Biomarkers of Psychiatric Disease:
                      Discriminating Bipolar Disorder From Major Depressive Disorder
                      With Polygenic Risk Scores. Doctoral dissertation, Harvard Medical
                      School.

Citable link          https://nrs.harvard.edu/URN-3:HUL.INSTREPOS:37365229

Terms of Use          This article was downloaded from Harvard University’s DASH
                      repository, and is made available under the terms and conditions
                      applicable to Other Posted Material, as set forth at http://
                      nrs.harvard.edu/urn-3:HUL.InstRepos:dash.current.terms-of-
                      use#LAA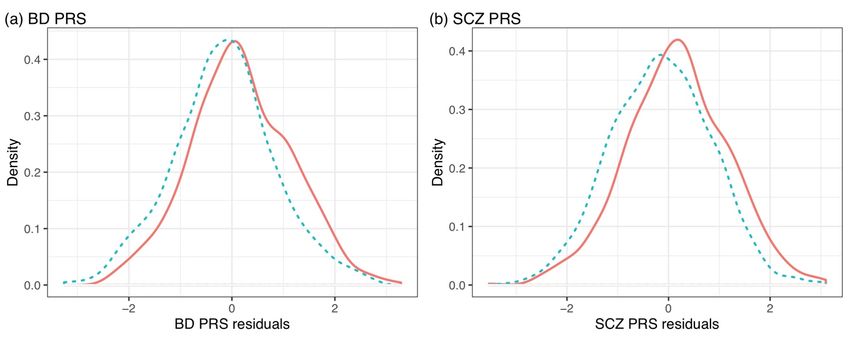
Genetic Biomarkers of Psychiatric Disease: Discriminating Bipolar Disorder from
            Major Depressive Disorder with Polygenic Risk Scores

                                      by

                               David T. Liebers

    Submitted in Partial Fulfillment of the Requirements for the M.D. Degree
           with Honors in a Special Field at Harvard Medical School

                               February 10, 2020

                                       1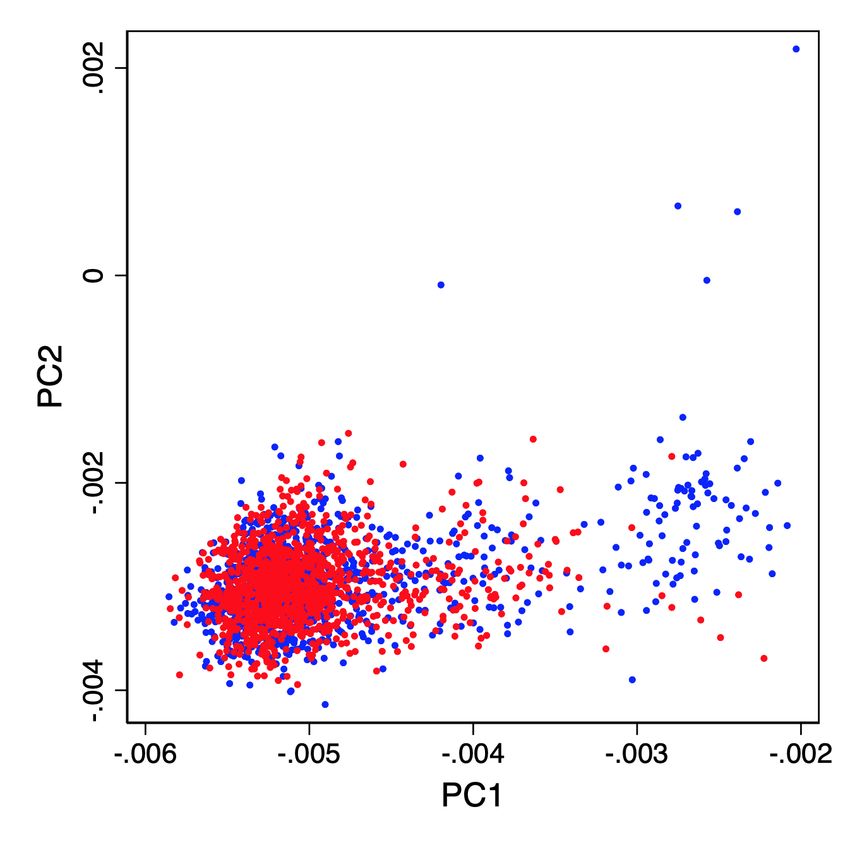
ABSTRACT.                                                    3

GLOSSARY                                                     5

INTRODUCTION.                                                6

Differentiating Unipolar and Bipolar Depressive Syndromes    6

The Genetic Basis of Mood Disorders                          7

Polygenic Risk Scores and Clinical Medicine                  8

MATERIALS AND METHODS.                                      11

Subjects                                                    11

Genome-wide Association Study (GWAS)                        12

Calculation of PRSs                                         12

Statistical Analysis                                        13

RESULTS.                                                    15

Clinical and Demographic Features                           15

Polygenic Association with BD vs. MDD                       15

Genetic risk and Clinical Features                          16

Association of PRS with Symptoms / Clinical Features        17

SUMMARY, FUTURE WORK AND DISCUSSION                         17

Moving Polygenic Risk Scores to the Clinic                  18

Future Research                                             19

Limitations                                                 21

TABLES AND FIGURES                                          24

REFERENCES                                                  34

ACKNOWLEDGEMENTS AND DISCLOSURES                            40

ATTACHED PAPERS                                             41

                                                       2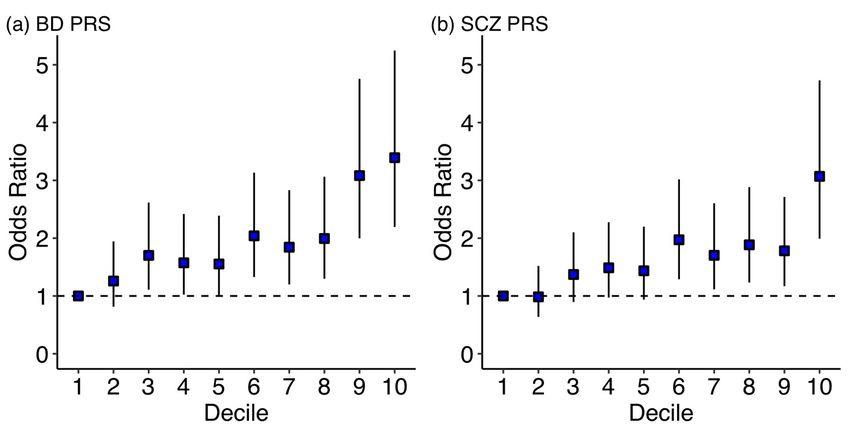
Abstract.
      Polygenic risk summary scores (PRSs) based on genome-wide association

studies for psychiatric diseases have shown promise in discriminating cases from

controls, predicting disease course, and response to treatment. The research presented

here has sought to investigate whether such an approach may improve differentiation

between bipolar disorder (BD) and major depressive disorder (MDD), a clinical distinction

with important prognostic and therapeutic implications, and one which is often challenging

based on clinical grounds alone. More specifically, this study tested whether psychiatric

polygenic risk scores (PRSs) for bipolar disorder (BD) and schizophrenia (SCZ) improve

clinically based classification models of BD-MDD diagnosis. The test sample in the

present analysis included 843 BD and 930 MDD subjects similarly genotyped and

phenotyped using the same standardized interview. The primary analysis tested the

association of clinical risk factors and PRSs with diagnosis of BD versus MDD. A

secondary analysis used multivariate modeling and receiver operating characteristic

analysis to test the additive effect of PRSs on a baseline model with clinical features

known to associate with BD-MDD status. PRSs drawn from BD (R2=3.5%, p=4.94x10⁻¹²)

and SCZ (R2 = 3.2%, p=5.71x10⁻¹¹) GWAS meta-analyses associated with BD-MDD

diagnosis. Individuals with top decile BD PRS had a significantly increased risk for BD

versus MDD compared with those in the lowest decile (OR=3.39, CI=2.19-5.25). PRSs

improved the discriminatory ability of a symptom-based model (DC=0.021, p=1.05x10⁻⁴)

and a full model with symptoms and clinical features (DC = 0.011, p=6.48x10⁻⁴). This

                                            3
study demonstrates that psychiatric PRSs provide modest independent discrimination
between BD and MDD cases, suggesting that PRS could ultimately have utility in subjects
at the extremes of the distribution and subjects for whom clinical symptoms are poorly
measured or yet to manifest.
4Glossary
AUC – Area Under-the-Curve
BD – Bipolar Disorder
EHR—Electronic Health Record
GenRED – Genetics of Recurrent Early-Onset Depression
GWAS – Genome-wide Association Study
LD – Linkage disequilibrium
LDpred – Python based package that adjusts GWAS summary scores for LD.
MDD – Major Depressive Disorder
NIMH – National Institute of Mental Health
PCA – Principal Components Analysis
PRS – Polygenic Risk Score
SCZ – Schizophrenia
SNP – Single Nucleotide Polymorphism
5Introduction.
Differentiating Unipolar and Bipolar Depressive Syndromes
Recurrent depressive syndromes, whether diagnostically linked to unipolar Major
Depressive Disorder (MDD) or Bipolar Disorder (BD), affect up to a fifth of the world's
population and are associated with substantial morbidity, increased risk for suicide, and
premature mortality (1,2). The distinction between bipolar disorder (BD) and major
depressive disorder (MDD) finds early roots in Emil Kraepelin’s description of manic-
depressive psychosis (3), and was subsequently validated by the discovery of
pharmacologic agents with relative specificity for depressive and manic syndromes (4,5).
Differentiating between bipolar and unipolar depression poses a diagnostic challenge.
The greater burden of depressive symptoms in BD often leads to prolonged periods of
misdiagnosis and ineffective treatment (6,7). While subjects with a clear history of mania
are easily distinguished from those with MDD, many subjects with BD experience milder
or atypical forms of (hypo)mania that may be difficult to recall or characterize, particularly
within the context of routine clinical care (8). Moreover, the early manifestation of BD is
often marked by depressive symptoms, with most subjects experiencing depressive
episodes years before the emergence of manic symptoms (9).
Clinical features such as psychotic symptoms, anxiety, psychomotor retardation,
greater overall severity, and earlier onset have been shown to associate with bipolar
depression (10–14). However, the extent of these associations has varied across study
populations. For example, higher rates of psychosis in the context of depression has not
consistently associated with bipolar depression (15–17). Moreover, the availability of
6studies that control for exposure to pharmacotherapy has been limited. Studies that
include drug washout periods have demonstrated even less consistency with fewer
characteristics and clinical features that reliably associate with bipolar versus unipolar
depression (16,18,19). Thus, these nuanced differences are often insufficient for
diagnostic purposes. Initial efforts to combine symptoms, illness features, and
demographic risk factors into more comprehensive models of disease course have
yielded greater discrimination, with AUC indexes ranging from 0.7-0.8, though these
analyses have been limited by relatively small replication sets and heterogeneity of
interviewing tools (11,12,20). Clinical features can be imprecise, poorly recalled, and only
provide prognostic utility after their manifestation, thereby limiting their utility in prodromal
and early onset cases, where the need for better diagnostic indices is arguably greatest
(9). In this way, while anti-depressant monotherapy of BD is generally avoided due to the
risk of inducing mania, the use of augmentation mood stabilizers in patients presenting
with a severe first episode depressive episode is subject to significantly more inter-
provider variability (21).
The Genetic Basis of Mood Disorders
The genetic basis of complex disorders such as BD and MDD is overwhelmingly
polygenic, with hundreds and potentially thousands of contributing genetic loci distributed
across the genome (22,23). Based on twin studies, the heritability of BD has been
estimated to be greater than 70% (24–26), and the most recent GWAS meta-analysis has
identified 30 loci that attain genome-wide significance. Despite individual loci having
relatively modest association with disease status, consideration of all associated markers
7in aggregate as polygenic risk scores (PRS) can provide improved predictive ability (24).
This approach was first tested in schizophrenia where it was shown to predict case-
control status in replication sets (27). The extent of the predictive potential is bounded by
the overall heritability attributable to additive effects of common variation ("GWAS
heritability"), which ranges from about ~10% for MDD to 20-30% for more heritable
disorders such as BD or schizophrenia (22,28,29). At currently available sizes, GWAS
studies are under-powered to detect the full range of heritability from common variation
based on these estimates, with the proportion of variance estimates explained (R2)
ranging from ~12% for SCZ, to ~8% for BD and ~2-3% for MDD (22,28,29). Thus, at
present GWAS discovery sample sizes and with currently available computational tools,
PRSs have attained less than half of their predicted potential to discriminate cases from
controls in test populations. While the estimated R2 will increase with larger GWAS
samples, PRSs already provide indices of genetic susceptibility, providing novel insights
into nosological relationships (30) which may, in certain contexts, have potential future
clinical implications.
Polygenic Risk Scores and Clinical Medicine
The use of PRSs in the psychiatry literature has spanned the investigation of
disease endophenotypes, associations with cognitive performance, and success in
creative professions (31–33). More recently, the field has pushed towards research with
more immediate clinical relevance. Musliner et al (34) investigated how psychiatric PRSs
associate with disease risk in the Danish population, finding that high MDD (30%), BD
(5%), and SCZ (12%) PRSs associated with differential increased liability of a first
8episode depression. Multi-site biobank consortia linked to electronic health records have
allowed for the study of polygenic risk score associations at the level of health systems,
demonstrating pleiotropic effects across a number of neurocognitive phenotypes as well
as non-psychiatric comorbidities (35). Studies have linked PRS for SCZ with suboptimal
response to antipsychotics in first episode psychosis (36), higher antipsychotic dose
requirements (37), disease course after first psychotic episode (38) and poor response to
lithium in BD (39). Although GWAS studies of medication “responders” versus “non-
responders” may more directly address the question of pharmacogenetics (39,40),
disease-based summary statistics have shown an ability to stratify for disease course
intensity and likelihood of medication response. The conspectus of this work is that as the
performance of PRSs increase, they may motivate randomized trials populated with
individuals at the tails of the genetic risk spectrum for severity. The direction of association
between PRS and drug response may not always be a priori predictable. In the study
mentioned above, high SCZ PRS associated with poor response to antipsychotics.
However, in a study of individuals with migraines, high PRS associated with improved
response to triptans (41). Whichever the direction of association, for heritable complex
diseases with severity that tracks with polygenic risk, stratifying by PRS may help capture
signal that may otherwise be diluted across the full spectrum of genetic risk, and thus help
match potential therapies to biomarker-defined sub-groups.
PRSs are being increasingly studied for prediction in a range of common medical
disorders such heart disease (42), type II diabetes (43), obesity (44), and common
cancers like breast (45) and prostate cancer (46). In these examples, clinical utility is
9likely to be found in the tails of the PRS distribution, where increased risk is substantial
and largely independent of clinically-based risk estimation tools, including family history,
which suggests PRS could have a role in comprehensive models to inform decision
making on prevention therapies and screening (47). Arguably the most successful
application of polygenic risk score thus far has occurred in cardiovascular disorders,
where population based samples have provided strong evidence that PRS can identify
that proportion of the population at high risk for cardiovascular morbidity who are likely to
benefit from implementation of risk mitigation strategies and pharmacological treatment
(48). However, for most studied disorders, including BD, the link to specific clinical utility
is unclear and will require further research based on prospective cohort studies and
randomized trials. Ultimately, the most informative risk models are likely to integrate
epidemiologic parameters, clinical data, non-genetic biomarkers, and potentially a
broader index of genetic risk, summing the effects both common and rare variants.
Importantly, for PRSs to be clinically useful at the BD-MDD diagnostic decision
point, they must complement clinical data. Discrimination between diagnosis group is less
useful if clinical features that could be obtained from a patient interview have similar, non-
orthogonal discriminative power. While genetic information has advantages over other
kinds of clinical information and even other biomarkers which may fluctuate with time,
PRSs should be evaluated in the context of models that integrate all available forms of
clinical data.
In this study, we explored the degree to which polygenic risk scores may aid in
distinguishing bipolar from unipolar depression, arguably one of the most important
10clinical decisions in psychiatry, since the prognosis and optimal treatment of either
disorder is likely to be different for most patients. We have specifically selected samples
that were similarly genotyped and phenotyped, thereby allowing us to test the effect of
PRSs individually, but also within the broader context of clinical risk factors that are
typically used to help with clinical decision making.
Materials and Methods.
Subjects
The sample included BD and MDD cases from National Institute of Mental Health
(NIMH) Bipolar Disorders Initiative and Genetics of Recurrent Early-Onset Depression
(GenRED) collections, which were initially ascertained for genetic studies and have
undergone previous case-control GWAS analyses (49,50). Both studies used the
Diagnostic Interview for Genetic Studies (DIGS) and similar best estimate procedures
(51). Subjects were restricted to high-confidence diagnoses of BD (more specifically,
bipolar I disorder) or MDD genotyped on the Affymetrix 6.0 Microarray. All subjects were
unrelated, of European ancestry, and independent of the initial training set GWAS studies.
We further selected samples with non-missing data for all seven symptoms and clinical
features (psychomotor retardation, incapacitation, delusions and number of mixed
symptoms during worst depressive episode, length of most severe episode, number of
depressive episodes, antidepressant induced “high” feeling) previously shown to
discriminate BD from MDD in a larger but partially overlapping dataset (55% of the
samples used in the present analysis were part of the training dataset in the previous
11analysis) (11). The final sample included a total of 1773 subjects, consisting of 843 with
BD and 930 with recurrent MDD. Samples were previously collected under Institutional
Review Board (IRB) approved protocols (49,50) that included informed consent for
genetic studies and data sharing.
Genome-wide Association Study (GWAS)
Cases with BD and MDD as described above were previously genotyped using the
Affymetrix 6.0 micro-array. Raw genotypes were combined using PLINK1.9 (52) followed
by sequential quality control (QC) steps removing: (1) SNPs with missing rates ≥ 5%; (2)
individuals with overall missing rates ≥ 2%; (3) remaining SNPs with missing rates ≥ 2%;
(4) SNPs in Hardy-Weinberg disequilibrium (P 2%. The filtered combined file underwent additional
QC/harmonization steps (https://www.well.ox.ac.uk/~wrayner/tools/HRC-1000G-check-
bim-v4.2.7.zip) prior to imputation to the multiethnic 1000Genomes version 3 reference
panel. Imputation was performed using the Michigan Imputation Server and high-quality
genotypes ( r2> 0.6) with a minor allele frequency of 1% or greater were extracted and
converted to PLINK format for downstream analyses. Principal components analysis
(PCA) was performed using PLINK1.9 by combining the filtered genotypes with the
1000G multi-ethnic panel and extracting the top 10 principal components. We excluded
5 samples that were outliers in the PCA analysis (Supplementary Figure 1).
Calculation of PRSs
12PRS were calculated using recommended parameters in LD-Pred (53), which
utilizes a Bayesian approach to infer the mean effect at each individual marker while
accounting for linkage disequilibrium (LD) between markers. We utilized summary
statistics from the largest meta-analysis GWAS of BD (22) and SCZ (28) as the training
dataset sets and the European subjects from the 1000 Genomes version 3 as the linkage-
disequilibrium (LD) reference genotypes. Using an LD-radius of 1775 and 1981, weighted
risk scores were constructed for 5,325,407 and 5,943,410 markers in the harmonized BD
and SCZ datasets, respectively. PRS were derived across nine training dataset
thresholds, defined as the assumed "fraction of causal variants" (--PS=1, 0.3, 0.1, 0.03,
0.01, 0.003, 0.001, 0.0003, 0.0001), and standardized to reflect the standard deviation as
the unit of measurement. PRS thresholds were selected maximize the explained
difference between BD and MDD phenotypes. For SCZ, this optimal p-value threshold
(0.3) was the same as the one used in the original study validating LDPred as method of
PRS calculation (53).
Statistical Analysis
All analyses were performed in R version 3.4.2. Association of PRSs with
phenotype status was performed with a generalized linear model using a logit link
function. We initially fit baseline models with BD-MDD status as the dependent variable
and the first ten principal components (PCs), age at interview, and sex as covariates. We
subsequently added the PRS variable into that base model and compared the difference
in Nagelkerke’s pseudo-R2 (∆R2) to estimate proportion of variance attributable to the
PRS. For ease of visualization, the sample was stratified into deciles using the residuals
13of the top performing BD and SCZ PRSs adjusted for first 10 PCs, age, and sex. Odds
ratios (OR) for BD vs MDD status and 95% confidence intervals (CIs) were calculated for
each decile in comparison with the first decile.
We performed a receiver operating characteristic (ROC) analysis to estimate
classifying potential of PRS. We initially fit a logistic model with the first 10 PCs, age, and
sex, and then measured the c-index. To this model we serially added (1) top performing
BD and SCZ PRSs, (2) each symptom/clinical feature (psychomotor retardation,
incapacitation, delusions, length of most severe episode, number of depressive episodes,
presence of high feeling after antidepressant, and number of mixed symptoms), both
separately and then with PRSs to measure the additive effect (3) a set of symptoms that
might plausibly be ascertained from a psychiatric interview on initial presentation with a
depressive episode (psychomotor retardation, delusions, and number of mixed
symptoms) both as a clinical model and with PRSs, and all clinical features/symptoms
taken together and PRSs.
Lastly, we tested the association of the top performing BD and SZ PRS with each
of the symptoms/clinical features shown listed above, controlling for diagnosis. Logistic
regression was used for binary variables (presence of psychomotor retardation,
delusions, incapacitation, and high feeling after antidepressant) and linear regression for
continuous variables (length of worst depression in weeks, number of episodes, and
number of mixed symptoms).
14Results.
Clinical and Demographic Features
Of the 1773 subjects, 843 had BD and 930 had MDD, with more females than
males in both groups (66.0% and 70.0%, respectively) (Table 1). Subjects with BD were
slightly older at the time of their interview (42.0 years BD versus 40.2 years MDD), had
fewer years of education (14.9 BD versus 16.0 MDD), and were less likely to be married
(29.8% BD versus 47.8% MDD). Consistent with our previous study (11), subjects with
BD were more likely to have experienced psychomotor retardation and delusions, a
shorter length depressive episode, incapacitation, a greater number of depressive
episodes, high feeling after antidepressant treatment, and a greater number of mixed
symptoms (Table 1).
Polygenic Association with BD vs. MDD
Given the strong co-heritability between bipolar disorder and schizophrenia (26)
we performed polygenic analyses utilizing the largest meta-analyses of each disorder to
provide the specific markers and weights for polygenic risk scoring. Notably, both BD and
MDD samples were not part of the GWAS meta-analyses, assuring independence across
the training and testing datasets. The p-value thresholds for BD (0.003) and SCZ (0.3)
PRSs were chosen to maximize association with BD-MDD status (Supplementary Table
1). In our primary analysis, we found that PRS for BD was strongly associated with BD
compared with MDD (∆R2=3.53%, p=4.94x10⁻¹²), with an effect size that was
approximately half of that usually seen in BD case-control studies. Similarly, PRS for SCZ
was aassociated with BD versus MDD phenotype (∆R =3.16%, p=5.71x10⁻¹¹). The
2
15distribution of PRS among BD and MDD samples showed prominent overlap, with greater
discriminative ability found at the more extreme values of PRS, as has been observed in
other common complex disorders (Figure 1). Using PRSs to help classify the overall
sample, we found that a baseline model with covariates and PRS produced an AUC c-
statistic of 0.65 for the BD PRS and 0.64 for the SCZ PRS. For ease of interpretability,
we divided the samples into PRS deciles, and found that individuals with PRS in the top
decile had an OR of 3.39 (CI: 2.19-5.25) when compared to the lowest decile. Similarly,
those in the top decile of SCZ PRS residuals had an OR of 3.07 (CI: 1.99-4.73) compared
to the lowest decile, in terms of BD-MDD status (Figure 2).
Genetic risk and Clinical Features
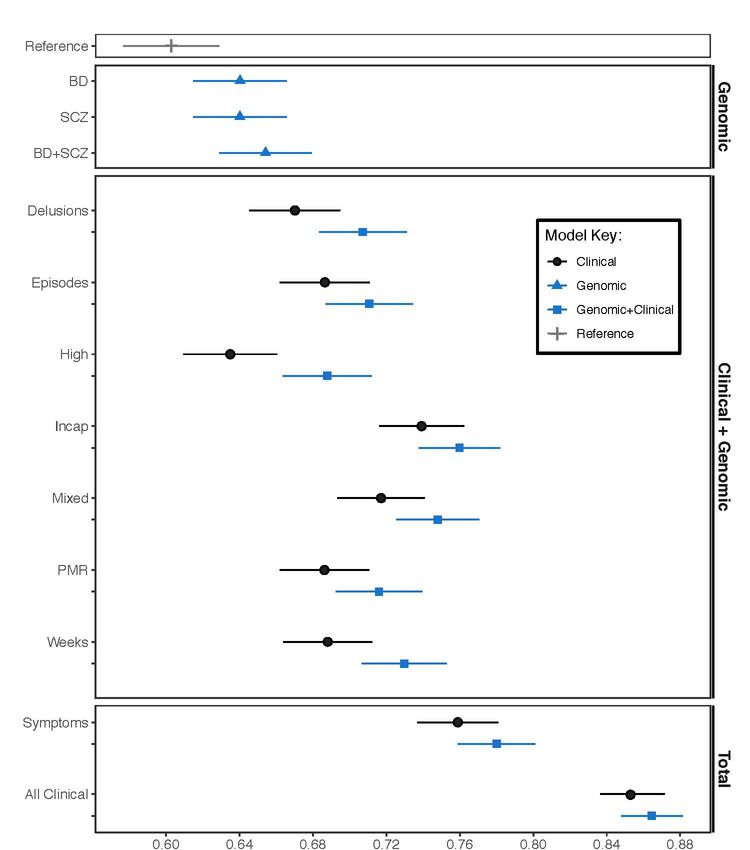
We found that PRSs discriminated BD-MDD status to a degree comparable to
many of the individual symptoms and clinical features tested. PRSs contributed marginal
additive effects to all individual clinical features, providing evidence that prediction based
on PRSs is likely to be independent of that based on clinical features (Figure 3). When
combined, the clinical features showed a more significant AUC, consistent with our prior
study (11). Inclusion of the PRSs to a symptom-based model and a full model with
symptoms and clinical features led to statistically significant increases in discriminatory
ability (DC=0.021, p=1.05x10⁻⁴ and DC = 0.011, p=6.48x10⁻⁴, respectively). The
classifying ability of PRSs in models with individual clinically-based predictors varied
based on the independence of these variables. For example, PRSs provided a larger
increase in discriminatory ability in a model with delusions alone (DC = 0.042) than
16incapacitation alone (DC = 0.021) (Supplementary Table 2). The PRS association
remained strongly significant even with the full multi-variate clinical model (Table 2).
Association of PRS with Symptoms / Clinical Features
Finally, in order to further explore effect of polygenic risk, we sought to formally
test whether the polygenic signal was differentially associated with specific clinical
features, thereby providing a more granular view of overall genetic susceptibility. Using
a logistic regression model adjusted for covariates that included the main effect of
diagnosis, we found a single significant association with BD PRS and incapacitation
(Table 3). In contrast, the SCZ PRS was associated with longer length of depression
(p=0.0043), but not with any of the additional risk factors, suggesting significant
heterogeneity despite comparable predictive effects.
Summary, Future Work and Discussion
Although mania remains the cardinal syndrome that defines the diagnosis of BD,
subjects often first present with years of depressive symptoms (54). Consequently,
subjects who are eventually diagnosed with BD are often misdiagnosed on initial
presentation, and may receive treatments of limited efficacy (55) that could be associated
with iatrogenic harm (7). Clinical symptoms, particularly in the prodromal phase of BD,
are often poorly captured and insufficiently prognostic, particularly in primary care settings
(8). Patients often lack insight into the nature of their manic symptoms, which can delay
diagnosis (56). Hence, there is a clear need for better prognostic tools that can help to
17stratify subjects are higher risk for developing BD. In this study, we have tested whether
markers of genetic risk (as indexed by PRSs) can augment traditionally used clinically-
based factors, thereby helping to identify subjects with depression who may be at high
risk for "converting" to bipolar disorder. We found that PRSs derived from the most recent
PGC GWAS discriminate modestly between BD and MDD cases, with BD PRS
demonstrating a slightly higher association than SCZ PRS. Subjects with top decile BD
PRS were more than three times as likely to have BD than MDD, compared with those in
the lowest BD PRS decile. This level of discrimination was similar to that found in a recent
study of PRS in first episode psychosis (38). PRSs had comparable classifying ability to
individual clinical features and symptoms previously shown to associate with BD,
although when included in a model with all clinical features and symptoms, the increase
in overall classification was more modest. The effect of PRSs appeared to be largely
independent of the clinical features, suggesting that PRSs may represent orthogonal risk
factors that may provide additional information beyond traditional clinical factors.
Moving Polygenic Risk Scores to the Clinic
For psychiatric disorders there is a strong need for reliable biomarkers of disease
etiology and progression due to the complexity and inaccessibility of brain tissue, and an
imprecise diagnostic taxonomy based exclusively on clinical phenomenology (57). While
genetic data has limitations, most notably the constraints placed by heritability estimates,
it may also hold advantages over clinically derived predictors, in view of the longitudinal
time-course where most psychiatric disorders manifest, and polymorphic clinical
manifestations that are often protean, time-limited, and poorly recalled. Unlike clinical
18predictors, genetic predictors can be measured before the onset of symptoms and can
be informative during the life-course. In contrast, several of the clinical features included
in our model, such as number of lifetime episodes and the duration of depressive episode
represents information that would not be available during a first episode or prior to the full
manifestation of the disorder. Moreover, as discovery sample sizes increase, the
divergence in risk between those at the tails of the PRS distribution will likely be greater.
Improved computational tools that more accurately adjust for the effects of linkage
disequilibrium in the generation of weights have shown promise in their improved ability
to discriminate cases and controls in test sets (58). Combined, the increasing size of
GWAS and improved computational, together with the inclusion of rarer variation, will
push PRSs closer to their full potential as predicted by GWAS heritability estimates.
These improved PRSs will likely be of greater clinical value.
Future Research
Here, I will highlight two areas of future research building on this preliminary study
on the use of PRSs in discriminating mood disorder disease course.
First, the harmonization of EHR data across health systems with associated
biobanks allows for the evaluation of granular patient data, longitudinally. Such datasets
facilitate research on questions about how high polygenic risk scores may predict the
accrual of psychiatric diagnoses, the presentation of psychiatric phenomenon, and the
prescription of psychotropics over time. The cost of misdiagnosis may also be estimated.
Second, it will be important to prepare the ground for future prospective
randomized trials in psychiatry that integrate genetic information. A body of research has
19shown that delivery of genetic tests results in a variety of clinical settings does not have
adverse consequences in terms of depression or anxiety. This had been a major concern
in the era of whole-genome and whole-exome screening for research purposes (59,60).
However, it is unclear whether this would hold true in patients who are at already higher
risk for psychiatric disease. Individuals who present with a first depressive episode, or
other psychiatric symptoms, may benefit from risk stratification with a polygenic risk score,
however, they may be less inclined to choose to be tested for polygenic risk of more
severe psychiatric disease due to reasons associated with historical stigma. Those that
do choose to pursue testing may be less well equipped to assimilate test results than
those presented with test results when they are not depressed.
In the community, physician interest and comfort with the use of PRSs for assisting
with the management of comfort disease risk is still developing. Research that better
delineates clinical decisions that could be nudged in one direction or another with PRSs,
may help motivate clinical trials that are likely to influence physician decision making.
PRSs may change a psychiatrist’s threshold to augment anti-depressant therapy with
lithium in patients with depression and high BD PRS. Similarly, high PRSs for severe
psychiatric disease may adjust a primary care provider’s threshold for referring to
psychiatry or therapy in patients with first episode depression. A more thorough
understanding of how physicians would respond to PRS, would increase the likelihood of
defining clinically relevant thresholds for prospective studies.
Many psychiatric diseases emerge during adolescence, a period of substantial
neurobiological change. If disease modifying therapies are developed based on targeting
20genetic factors identified through GWAS for psychiatric disease, the timing of the delivery
of such therapies will likely need to be at or before disease onset. This represents another
important future role for PRSs in predicting disease and adds urgency to developing
paradigms around ethical and practical concerns about the use of PRS in clinical
decision-making and the design of prospective trials.
Limitations
An important strength of our study is that rather than comparing cases and healthy
controls, we focus on the more clinically relevant comparison between two disorders with
symptom overlap yet require relatively distinct forms of pharmacotherapy. As such, we
therefore restricted our sample to subjects with either disorder who were diagnosed with
identical diagnostic instruments and genotyped with the same microarray chip, in order
to mitigate confounding. Additionally, our current analysis focused on the more realistic
assumption that polygenic risk scores will ultimately be used in conjunction with traditional
clinical risk factors, rather than studied or applied in isolation. We therefore applied
polygenic risk scoring to previously identified clinical factors that had shown replicable
associations in a prior comparison of BD and MDD (11). Our results therefore may have
greater face validity while providing a more contextual view of where PRS may have
clinical utility in future studies.
As an initial proof of concept study, there are also several important limitations.
We have analyzed opportunistically samples previously collected for genetic studies that
focused on the ascertainment of the more severe types of BD and on recurrent forms of
MDD. Further work should test the performance of psychiatric PRS in discriminating MDD
21and BD cases in more naturalistic clinical cohorts that include the full manifestation of the
BD-MDD mood spectrum, particularly in the early phases of illness (61). Second, our
clinical features were derived from a single cross-sectional evaluation that is subject to
typical retrospective limitations, including recall bias (62). Although best-estimate
procedures include additional information to supplement the interview, it is possible that
certain symptoms may have been under-reported. Third, we limited our focus to clinical
factors to available in our shared diagnostic instrument identified by our previous study
(11), whereas a more comprehensive diagnostic model may ultimately include additional
risk and state related factors that may only be reliably assessed using a prospective
cohort. Lastly, our study was performed in samples of European ancestry. It is likely that
these PRSs would be less predictive in non-European samples, which reflects a central
limitation of integrating currently available PRS into clinical medicine, and one which has
consequences for health equity (63).
2223
Tables and Figures

Table 1. Characteristics of Bipolar Disorder and Major Depressive Disorder samples
(n=1773).

                                              BD          MDD
                                            (n=843)      (n=930)
 Gender, n (%)
       Female                             556 (66.0)  651 (70.0)
 Age at interview, mean (s.d.)                  42.0  40.2 (11.8)
                                              (12.3)
 Years education, mean (s.d.)              14.9 (2.7)  16.0 (2.8)
 Married, n (%)                           250 (29.8)  352 (47.8)
 Length in weeks, mean (s.d.)                   35.8 81.9 (179.0)
                                              (93.7)
 Number of lifetime episodes, mean (s.d.)       22.1   8.0 (14.0)
                                              (51.2)
 Number of mixed symptoms, mean (s.d.)      1.3 (2.3)    0.5 (1.0)
 Psychomotor retardation, number (%)      492 (58.4)  304 (32.7)
 Delusions, number (%)                    194 (23.0)     27 (3.0)
 High after antidepressant, number (%)    357 (42.3)  105 (11.3)
 Incapacitation, number (%)               672 (79.7)  382 (41.1)

                                         24
Table 2: Odds Ratios of BD versus MDD Status for Clinical Features and Polygenic Risk Scores. Results of multivariate logistic regression with clinical features, symptoms and PRS as predictors of BD-MDD status (OR=odds ratios, CIL= lower bound 95% confidence interval, CIU=upper bound 95% confidence interval). Adjusted for 10 PCs, age and sex. Units for PRS is per standard deviation. Feature OR CIL CIU z-value p-value PMR 2.45 1.92 3.13 7.20 5.99x10⁻¹³ Del 5.71 3.58 9.43 7.10 1.29x10⁻¹² Mixed 1.26 1.16 1.37 5.53 3.18x10⁻⁸ Episodes 1.02 1.01 1.03 5.56 2.66x10⁻⁸ Weeks 0.99 0.99 1.00 -5.12 3.06x10⁻⁷ High 3.70 2.76 4.97 8.76
Table 3. PRS Association with Clinical Features. Association between top performing
 bipolar disorder (BD) and schizophrenia (SCZ) polygenic risk scores and individual
 clinical features (model including diagnosis, first 10 principal components, age and sex).
 Top performing PRSs are defined as those calculated from p-value thresholds for BD
 (0.003) and SCZ (0.3), which maximized association with BD-MDD status. Results from
 logistic regression with Z statistics are reported for binary variables: presence of
 psychomotor retardation, delusions, incapacitation, and high feeling after antidepressant
 treatment. Results from linear regression with t-statistic are reported for continuous
 variables (length of worst depression in weeks, number of episodes, and number of
 mixed symptoms).

           PRS                           SCZ                                BD
                              Estimate SE            P           Estimate SE        P
Length worst depression       11.264   3.942         0.004a      2.044    4.607     0.657
Psychomotor retardation       0.003    0.061         0.958       0.068    0.067     0.309
Number of mixed
                               -0.008      -0.156     0.876       -0.118   0.056    0.035
symptoms
Incapacitation                 0.003       0.061      0.958       0.214    0.072    0.003a
High after antidepressant      -0.056      0.067      0.404       -0.040   0.079    0.610
Number of episodes             -0.505      1.001      0.614       -1.122   1.167    0.336
Delusions                      0.037       0.087      0.672       -0.257   0.104    0.013
  asignificant after Bonferroni correction (p
Figure 1. Density distribution of bipolar disorder (BD) (a) and schizophrenia (SCZ) (b)
polygenic risk scores (PRSs) in BD and major depressive disorder (MDD)
samples. PRS represents standardized residuals after adjustment for first ten
principal components, age and sex. Dashed=MDD; solid= BD.
27Figure 2. Odds ratios for bipolar disorder (BD) versus major depressive disorder and
confidence intervals by decile for top BD and schizophrenia polygenic risk score
predictors (using residuals adjusting for first 10 principal components, age and sex).
Odds ratios measured against lowest decile.
28Figure 3. C-indices for models classifying bipolar disorder (BD) and major depressive
disorder (MDD) showing the additive effect of genetic information to clinical models. The
figure is divided into four sections. (1) Reference model including 10 principal
components, age and sex. (2) Models including polygenic risk scores (PRSs) from
bipolar disorder (BD) and schizophrenia (SCZ) GWAS. (3) Models with each clinical
feature or symptom, individually, with (blue) and without (black) PRSs. (4) “Symptoms,”
or data which could be ascertained at first interview (number of mixed symptoms,
presence of delusions and psychomotor retardation), and a total model with all
symptoms and clinical features, with and without PRSs. All models included 10 principal
components, age and sex. High=High after antidepressant treatment;
Incap=incapacitation during worst depressive episode; Mixed=Number of mixed
symptoms during worst depressive episode; PMR=Psychomotor retardation during
worst depressive episode; Weeks=Length of longest depressive episode.
2930
Supplementary Table 1. DR2 for model with PRS as classifier of BD-MDD (against
baseline model with first 10 PCs, sex and age at interview). BD=PRS derived from
Bipolar Disorder GWAS. SCZ=PRS derived from Schizophrenia GWAS.

 P-value Threshold       R2        DR2 a      OR        SE        Z           P
 baseline              0.0610
 BD: 0.0001            0.0648     0.0038     1.12     0.0504     2.29    2.21x10⁻²
 BD: 0.0003            0.0617     0.0007     0.949    0.0523    -1.00    3.15x10⁻¹
 BD: 0.001             0.0622     0.0012     0.934    0.0526    -1.31    1.92x10⁻¹
 BD: 0.003             0.0963     0.0353     1.59     0.0672     6.91    4.94x10⁻¹²
 BD: 0.01              0.0942     0.0332     1.58     0.0686     6.71    1.97x10⁻¹¹
 BD: 0.03              0.0917     0.0307     1.56     0.0685     6.46    1.08x10⁻¹⁰
 BD: 0.1               0.0907     0.0297     1.54     0.0683     6.36    2.05x10⁻¹⁰
 BD: 0.3               0.0903     0.0293     1.54     0.0683     6.31    2.73x10⁻¹⁰
 BD: 1                 0.0902     0.0292     1.54     0.0682     6.30    3.01x10⁻¹⁰
 SCZ                     R2        DR 2       OR        SE        Z          P
 SCZ: 0.0001           0.0636     0.0026     1.14     0.0693     1.89    5.87x10⁻²
 SCZ: 0.0003           0.0619     0.0009     1.06     0.0488     1.13    2.59x10⁻¹
 SCZ: 0.001            0.0612     0.0002     1.03     0.0504    0.546    5.85x10⁻¹
 SCZ: 0.003            0.0655     0.0045     1.14     0.0540     2.49    1.28x10⁻²
 SCZ: 0.01             0.0643     0.0033     1.12     0.0541     2.15    3.16x10⁻²
 SCZ: 0.03             0.0850     0.024      1.38     0.0557     5.72    1.06x10⁻⁸
 SCZ: 0.1              0.0906     0.0296     1.44     0.0571     6.34    2.29x10⁻¹⁰
 SCZ: 0.3              0.0926     0.0316     1.46     0.0576     6.55    5.71x10⁻¹¹
 SCZ: 1                0.0918     0.0308     1.45     0.0577     6.47    9.53x10⁻¹¹
a Difference baseline model and model with PRS.

                                         31
Supplementary Table 2. C-index of a reference model, and models with polygenic risk
scores (PRSs), clinical features, and a combination of clinical features and PRSs that
associate with BD-MDD status. Symptoms include parts of history that likely could be
obtained from a psychiatric history during a first episode depression (PMR + Mixed +
Delusions). CIL=Lower bound of 95% confidence interval. CIU=Upper bound of 95%
confidence interval.
Model C CIL CIU Type ΔC (with PRS)
Reference 0.603 0.577 0.629 -
SCZ 0.640 0.615 0.666 Genomic 0.037
BD 0.640 0.615 0.666 Genomic 0.038
BD + SCZ 0.654 0.629 0.679 Genomic 0.051
Weeks 0.670 0.645 0.695 Clinical -
Weeks + BD + SCZ 0.707 0.683 0.731 Combined 0.037
PMR 0.687 0.662 0.711 Clinical -
PMR + BD + SCZ 0.711 0.687 0.734 Combined 0.024
Mixed 0.635 0.609 0.661 Clinical -
Mixed + BD + SCZ 0.688 0.664 0.712 Combined 0.053
Incapacitated 0.739 0.716 0.762 Clinical -
Incapacitation + BD + SCZ 0.760 0.738 0.782 Combined 0.021
High 0.717 0.693 0.741 Clinical -
High + BD + SCZ 0.748 0.726 0.771 Combined 0.031
Episodes 0.686 0.662 0.711 Clinical -
Episodes + BD + SCZ 0.716 0.693 0.739 Combined 0.030
Delusions 0.688 0.664 0.712 Clinical -
Delusions + BD + SCZ 0.730 0.707 0.753 Combined 0.042
Symptoms 0.759 0.737 0.781 Clinical
Symptoms + BD + SCZ 0.780 0.759 0.801 Combined 0.021
All Clinical 0.854 0.837 0.872 Clinical -
All Clinical + BD 0.862 0.845 0.879 Combined 0.0076
All Clinical + SCZ 0.861 0.845 0.879 Combined 0.0074
All Clinical + BD + SCZ 0.865 0.848 0.881 Combined 0.011
32Supplementary Figure 1. PCA demonstrating outliers that were removed prior to
analysis.
33References
1. Kessler RC. The Costs of Depression. Psychiatric Clinics of North America. 2012
Mar;35(1):1–14.
2. Bauer M, Andreassen OA, Geddes JR, Vedel Kessing L, Lewitzka U, Schulze TG, et al. Areas of
uncertainties and unmet needs in bipolar disorders: clinical and research perspectives. The
Lancet Psychiatry. 2018 Nov;5(11):930–9.
3. Leonhard K, Korff I, Schulz H. [Temperament in families with monopolar and bipolar phasic
psychoses]. Psychiatr Neurol (Basel). 1962;143:416–34.
4. Pacchiarotti I, Bond DJ, Baldessarini RJ, Nolen WA, Grunze H, Licht RW, et al. The
International Society for Bipolar Disorders (ISBD) Task Force Report on Antidepressant Use
in Bipolar Disorders. AJP. 2013 Nov;170(11):1249–62.
5. Altshuler LL, Post RM, Leverich GS, Mikalauskas K, Rosoff A, Ackerman L. Antidepressant-
induced mania and cycle acceleration: a controversy revisited. Am J Psychiatry. 1995
Aug;152(8):1130–8.
6. Lish JD, Dime-Meenan S, Whybrow PC, Price RA, Hirschfeld RMA. The National Depressive
and Manic-depressive Association (DMDA) survey of bipolar members. Journal of Affective
Disorders. 1994 Aug;31(4):281–94.
7. Baldessarini RJ, Faedda GL, Offidani E, Vázquez GH, Marangoni C, Serra G, et al.
Antidepressant-associated mood-switching and transition from unipolar major depression
to bipolar disorder: A review. Journal of Affective Disorders. 2013 May;148(1):129–35.
8. Das AK. Screening for Bipolar Disorder in a Primary Care Practice. JAMA. 2005 Feb
23;293(8):956.
9. Van Meter AR, Burke C, Youngstrom EA, Faedda GL, Correll CU. The Bipolar Prodrome: Meta-
Analysis of Symptom Prevalence Prior to Initial or Recurrent Mood Episodes. Journal of the
American Academy of Child & Adolescent Psychiatry. 2016 Jul;55(7):543–55.
10. Mitchell PB, Frankland A, Hadzi-Pavlovic D, Roberts G, Corry J, Wright A, et al. Comparison
of depressive episodes in bipolar disorder and in major depressive disorder within bipolar
disorder pedigrees. Br J Psychiatry. 2011 Oct;199(4):303–9.
11. Leonpacher AK, Liebers D, Pirooznia M, Jancic D, MacKinnon DF, Mondimore FM, et al.
Distinguishing bipolar from unipolar depression: the importance of clinical symptoms and
illness features. Psychol Med. 2015 Aug;45(11):2437–46.
3412. Gan Z, Diao F, Wei Q, Wu X, Cheng M, Guan N, et al. A predictive model for diagnosing
bipolar disorder based on the clinical characteristics of major depressive episodes in
Chinese population. Journal of Affective Disorders. 2011 Nov;134(1–3):119–25.
13. Frankland A, Roberts G, Holmes-Preston E, Perich T, Levy F, Lenroot R, et al. Clinical
predictors of conversion to bipolar disorder in a prospective longitudinal familial high-risk
sample: focus on depressive features. Psychol Med. 2018 Jul;48(10):1713–21.
14. Cuellar AK, Johnson SL, Winters R. Distinctions between bipolar and unipolar depression.
Clin Psychol Rev. 2005 May;25(3):307–39.
15. Breslau N, Meltzer HY. Validity of subtyping psychotic depression: examination of
phenomenology and demographic characteristics. Am J Psychiatry. 1988 Jan;145(1):35–40.
16. Beigel A, Murphy DL. Unipolar and bipolar affective illness. Differences in clinical
characteristics accompanying depression. Arch Gen Psychiatry. 1971 Mar;24(3):215–20.
17. Black DW, Nasrallah A. Hallucinations and delusions in 1,715 patients with unipolar and
bipolar affective disorders. Psychopathology. 1989;22(1):28–34.
18. Kupfer DJ, Weiss BL, Foster G, Detre TP, McPartland R. Psychomotor activity in affective
states. Arch Gen Psychiatry. 1974 Jun;30(6):765–8.
19. Katz MM, Robins E, Croughan J, Secunda S, Swann A. Behavioural measurement and drug
response characteristics of unipolar and bipolar depression. Psychol Med. 1982
Feb;12(1):25–36.
20. Schaffer A, Isometsä ET, Tondo L, Moreno DH, Sinyor M, Kessing LV, et al. Epidemiology,
neurobiology and pharmacological interventions related to suicide deaths and suicide
attempts in bipolar disorder: Part I of a report of the International Society for Bipolar
Disorders Task Force on Suicide in Bipolar Disorder. Aust N Z J Psychiatry. 2015
Sep;49(9):785–802.
21. Barowsky J, Schwartz TL. An Evidence-Based Approach to Augmentation and Combination
Strategies for: Treatment-Resistant Depression. Psychiatry (Edgmont). 2006 Jul;3(7):42–
61.
22. Stahl EA, Breen G, Forstner AJ, McQuillin A, Ripke S, Trubetskoy V, et al. Genome-wide
association study identifies 30 loci associated with bipolar disorder. Nat Genet. 2019
May;51(5):793–803.
23. Wray NR, Goddard ME, Visscher PM. Prediction of individual genetic risk to disease from
genome-wide association studies. Genome Research. 2007 Sep 4;17(10):1520–8.
3524. Kendler KS, Pedersen NL, Neale MC, Mathé AA. A pilot Swedish twin study of affective
illness including hospital- and population-ascertained subsamples: results of model fitting.
Behav Genet. 1995 May;25(3):217–32.
25. Smoller JW, Finn CT. Family, twin, and adoption studies of bipolar disorder: AMERICAN
JOURNAL OF MEDICAL GENETICS (SEMIN. MED. GENET.). Am J Med Genet. 2003 Nov
15;123C(1):48–58.
26. The Brainstorm Consortium, Anttila V, Bulik-Sullivan B, Finucane HK, Walters RK, Bras J, et
al. Analysis of shared heritability in common disorders of the brain. Science. 2018 Jun
22;360(6395):eaap8757.
27. Purcell SM, Wray NR, Stone JL, Visscher PM, O’Donovan MC, Sullivan PF, et al. Common
polygenic variation contributes to risk of schizophrenia and bipolar disorder. Nature
[Internet]. 2009 Jul 1 [cited 2019 Apr 20]; Available from:
http://www.nature.com/doifinder/10.1038/nature08185
28. Pardiñas AF, Holmans P, Pocklington AJ, Escott-Price V, Ripke S, Carrera N, et al. Common
schizophrenia alleles are enriched in mutation-intolerant genes and in regions under
strong background selection. Nat Genet. 2018;50(3):381–9.
29. Howard DM, Adams MJ, Clarke T-K, Hafferty JD, Gibson J, Shirali M, et al. Genome-wide
meta-analysis of depression identifies 102 independent variants and highlights the
importance of the prefrontal brain regions [Internet]. Genetics; 2018 Oct [cited 2019 Jul
28]. Available from: http://biorxiv.org/lookup/doi/10.1101/433367
30. The Brainstorm Consortium, Anttila V, Bulik-Sullivan B, Finucane HK, Walters RK, Bras J, et
al. Analysis of shared heritability in common disorders of the brain. Science. 2018 Jun
22;360(6395):eaap8757.
31. Liebers DT, Pirooznia M, Seiffudin F, Musliner KL, Zandi PP, Goes FS. Polygenic Risk of
Schizophrenia and Cognition in a Population-Based Survey of Older Adults. Schizophr Bull.
2016;42(4):984–91.
32. Ranlund S, Calafato S, Thygesen JH, Lin K, Cahn W, Crespo-Facorro B, et al. A polygenic risk
score analysis of psychosis endophenotypes across brain functional, structural, and
cognitive domains. Am J Med Genet. 2018 Jan;177(1):21–34.
33. Power RA, Steinberg S, Bjornsdottir G, Rietveld CA, Abdellaoui A, Nivard MM, et al.
Polygenic risk scores for schizophrenia and bipolar disorder predict creativity. Nat
Neurosci. 2015 Jul;18(7):953–5.
34. Musliner KL, Mortensen PB, McGrath JJ, Suppli NP, Hougaard DM, Bybjerg-Grauholm J, et
al. Association of Polygenic Liabilities for Major Depression, Bipolar Disorder, and
Schizophrenia With Risk for Depression in the Danish Population. JAMA Psychiatry. 2019
May 1;76(5):516.
3635. Zheutlin AB, Dennis J, Karlsson Linnér R, Moscati A, Restrepo N, Straub P, et al. Penetrance
and Pleiotropy of Polygenic Risk Scores for Schizophrenia in 106,160 Patients Across Four
Health Care Systems. AJP. 2019 Oct 1;176(10):846–55.
36. Zhang J-P, Robinson D, Yu J, Gallego J, Fleischhacker WW, Kahn RS, et al. Schizophrenia
Polygenic Risk Score as a Predictor of Antipsychotic Efficacy in First-Episode Psychosis.
American Journal of Psychiatry. 2019 Jan;176(1):21–8.
37. Hettige NC, Cole CB, Khalid S, De Luca V. Polygenic risk score prediction of antipsychotic
dosage in schizophrenia. Schizophr Res. 2016 Feb;170(2–3):265–70.
38. Vassos E, Di Forti M, Coleman J, Iyegbe C, Prata D, Euesden J, et al. An Examination of
Polygenic Score Risk Prediction in Individuals With First-Episode Psychosis. Biological
Psychiatry. 2017 Mar;81(6):470–7.
39. International Consortium on Lithium Genetics (ConLi+Gen), Amare AT, Schubert KO, Hou L,
Clark SR, Papiol S, et al. Association of Polygenic Score for Schizophrenia and HLA Antigen
and Inflammation Genes With Response to Lithium in Bipolar Affective Disorder: A
Genome-Wide Association Study. JAMA Psychiatry [Internet]. 2017 Nov 9 [cited 2019 Jul
28]; Available from:
http://archpsyc.jamanetwork.com/article.aspx?doi=10.1001/jamapsychiatry.2017.3433
40. Guo W, Machado-Vieira R, Mathew S, Murrough JW, Charney DS, Grunebaum M, et al.
Exploratory genome-wide association analysis of response to ketamine and a polygenic
analysis of response to scopolamine in depression. Transl Psychiatry. 2018 14;8(1):280.
41. Kogelman LJA, Esserlind A-L, Francke Christensen A, Awasthi S, Ripke S, Ingason A, et al.
Migraine polygenic risk score associates with efficacy of migraine-specific drugs. Neurol
Genet. 2019 Dec;5(6):e364.
42. Khera AV, Chaffin M, Aragam KG, Haas ME, Roselli C, Choi SH, et al. Genome-wide
polygenic scores for common diseases identify individuals with risk equivalent to
monogenic mutations. Nat Genet. 2018 Sep;50(9):1219–24.
43. Udler MS, McCarthy MI, Florez JC, Mahajan A. Genetic Risk Scores for Diabetes Diagnosis
and Precision Medicine. Endocrine Reviews. 2019 Dec 1;40(6):1500–20.
44. Khera AV, Chaffin M, Wade KH, Zahid S, Brancale J, Xia R, et al. Polygenic Prediction of
Weight and Obesity Trajectories from Birth to Adulthood. Cell. 2019 Apr;177(3):587-
596.e9.
45. Mavaddat N, Michailidou K, Dennis J, Lush M, Fachal L, Lee A, et al. Polygenic Risk Scores
for Prediction of Breast Cancer and Breast Cancer Subtypes. The American Journal of
Human Genetics. 2019 Jan;104(1):21–34.
3746. Seibert TM, Fan CC, Wang Y, Zuber V, Karunamuni R, Parsons JK, et al. Polygenic hazard
score to guide screening for aggressive prostate cancer: development and validation in
large scale cohorts. BMJ. 2018 Jan 10;360:j5757.
47. Lee A, Mavaddat N, Wilcox AN, Cunningham AP, Carver T, Hartley S, et al. BOADICEA: a
comprehensive breast cancer risk prediction model incorporating genetic and nongenetic
risk factors. Genet Med [Internet]. 2019 Jan 15 [cited 2019 May 24]; Available from:
http://www.nature.com/articles/s41436-018-0406-9
48. Mega JL, Stitziel NO, Smith JG, Chasman DI, Caulfield M, Devlin JJ, et al. Genetic risk,
coronary heart disease events, and the clinical benefit of statin therapy: an analysis of
primary and secondary prevention trials. Lancet. 2015 Jun 6;385(9984):2264–71.
49. Smith EN, Koller DL, Panganiban C, Szelinger S, Zhang P, Badner JA, et al. Genome-wide
association of bipolar disorder suggests an enrichment of replicable associations in regions
near genes. PLoS Genet. 2011 Jun;7(6):e1002134.
50. Shi J, Potash JB, Knowles JA, Weissman MM, Coryell W, Scheftner WA, et al. Genome-wide
association study of recurrent early-onset major depressive disorder. Mol Psychiatry. 2011
Feb;16(2):193–201.
51. Nurnberger JI, Blehar MC, Kaufmann CA, York-Cooler C, Simpson SG, Harkavy-Friedman J,
et al. Diagnostic interview for genetic studies. Rationale, unique features, and training.
NIMH Genetics Initiative. Arch Gen Psychiatry. 1994 Nov;51(11):849–59; discussion 863-
864.
52. Chang CC, Chow CC, Tellier LC, Vattikuti S, Purcell SM, Lee JJ. Second-generation PLINK:
rising to the challenge of larger and richer datasets. GigaSci. 2015 Dec;4(1):7.
53. Vilhjálmsson BJ, Yang J, Finucane HK, Gusev A, Lindström S, Ripke S, et al. Modeling
Linkage Disequilibrium Increases Accuracy of Polygenic Risk Scores. The American Journal
of Human Genetics. 2015 Oct;97(4):576–92.
54. Bauer M, Andreassen OA, Geddes JR, Vedel Kessing L, Lewitzka U, Schulze TG, et al. Areas
of uncertainties and unmet needs in bipolar disorders: clinical and research perspectives.
The Lancet Psychiatry. 2018 Nov;5(11):930–9.
55. Sachs GS, Nierenberg AA, Calabrese JR, Marangell LB, Wisniewski SR, Gyulai L, et al.
Effectiveness of Adjunctive Antidepressant Treatment for Bipolar Depression. N Engl J
Med. 2007 Apr 26;356(17):1711–22.
56. Shen H, Zhang L, Xu C, Zhu J, Chen M, Fang Y. Analysis of Misdiagnosis of Bipolar Disorder
in An Outpatient Setting. 2018;30(2):9.
57. Martin AR, Daly MJ, Robinson EB, Hyman SE, Neale BM. Predicting Polygenic Risk of
Psychiatric Disorders. Biological Psychiatry. 2018 Dec;S000632231832119X.
3858. Ge T, Chen C-Y, Ni Y, Feng Y-CA, Smoller JW. Polygenic prediction via Bayesian regression
and continuous shrinkage priors. Nat Commun. 2019 Dec;10(1):1776.
59. for the MedSeq Project team, Roberts JS, Robinson JO, Diamond PM, Bharadwaj A,
Christensen KD, et al. Patient understanding of, satisfaction with, and perceived utility of
whole-genome sequencing: findings from the MedSeq Project. Genet Med. 2018
Sep;20(9):1069–76.
60. Vassy JL, Lautenbach DM, McLaughlin HM, Kong S, Christensen KD, Krier J, et al. The
MedSeq Project: a randomized trial of integrating whole genome sequencing into clinical
medicine. Trials. 2014;15(1):85.
61. Smith DJ, Craddock N. Unipolar and bipolar depression: different or the same? The British
Journal of Psychiatry. 2011 Oct;199(4):272–4.
62. Wells JE, Horwood LJ. How accurate is recall of key symptoms of depression? A
comparison of recall and longitudinal reports. Psychol Med. 2004 Aug;34(6):1001–11.
63. Martin AR, Kanai M, Kamatani Y, Okada Y, Neale BM, Daly MJ. Clinical use of current
polygenic risk scores may exacerbate health disparities. Nature Genetics. 2019
Kwiecie;51(4):584–91.
39Acknowledgements and Disclosures
The Bipolar Samples were genotyped under the direction of Bipolar Genome Study. The
Principal Investigators and Co-Investigators were: John R Kelsoe, Tiffany A
Greenwood, Caroline M Nievergelt, Rebecca McKinney, Paul D Shilling, Nicholas
Schork, Erin N Smith, Cinnamon Bloss, John Nurnberger, Howard J Edenberg, Tatiana
Foroud, Daniel L Koller, Elliot Gershon, Chunyu Liu, Judith A Badner, William A
Scheftner, William B Lawson, Evaristus A Nwulia, Maria Hipolito, William Coryell, John
Rice, William Byerley, Francis McMahon, Thomas G Schulze, David T Chen, Wade
Berrettini, James B Potash, Peter P Zandi, Pamela B Mahon, Melvin G McInnis,
Sebastian Zöllner, Peng Zhang, David W Craig, Szabolcs Szelinger, Thomas B Barrett.
We thank Mark Chaffin for assistance in the calculation of polygenic risk scores. I would
like to thank Dr. Fernando Goes for his mentorship during this project, as well as
Andrea Ganna for his assistance in planning the analysis. Additionally, I would like to
thank Dr. Jordan Smoller for agreeing to serve as my honors thesis mentor, and for
valuable conversations in planning future work. We are grateful for the participation of
all the subjects contributing to this research.
The text has been adapted from:
Liebers DT, Pirooznia M, Seiffudin F, Musliner KL, Zandi PP, Goes FS. Polygenic Risk
of Schizophrenia and Cognition in a Population-Based Survey of Older Adults.
Schizophr Bull. 2016;42(4):984–91.
Liebers DT, Pirooznia M, Ganna A, Bipolar Genome Study (BiGS), Goes FS (2020).
Discriminating bipolar depression from major depressive disorder with polygenic risk
scores. Psychological Medicine 1–8. https:// doi.org/10.1017/S003329172000015X
Leonpacher AK, Liebers D, Pirooznia M, Jancic D, MacKinnon DF, Mondimore FM, et
al. Distinguishing bipolar from unipolar depression: the importance of clinical symptoms
and illness features. Psychol Med. 2015 Aug;45(11):2437–46.
40Attached Papers
Liebers DT, Pirooznia M, Ganna A, Bipolar Genome Study (BiGS), Goes FS (2020).
Discriminating bipolar depression from major depressive disorder with polygenic risk
scores. Psychological Medicine 1–8. https:// doi.org/10.1017/S003329172000015X (In
Press).
Liebers DT, Pirooznia M, Seiffudin F, Musliner KL, Zandi PP, Goes FS. Polygenic Risk
of Schizophrenia and Cognition in a Population-Based Survey of Older Adults.
Schizophr Bull. 2016;42(4):984–91.
Leonpacher AK, Liebers D, Pirooznia M, Jancic D, MacKinnon DF, Mondimore FM, et
al. Distinguishing bipolar from unipolar depression: the importance of clinical symptoms
and illness features. Psychol Med. 2015 Aug;45(11):2437–46.
41You can also read