Medium-density housing supply and demand analysis - Ian Page SR379 2017 Study Report
←
→
Page content transcription
If your browser does not render page correctly, please read the page content below
Study Report   SR379 [2017]

               Medium-density housing
               supply and demand analysis

               Ian Page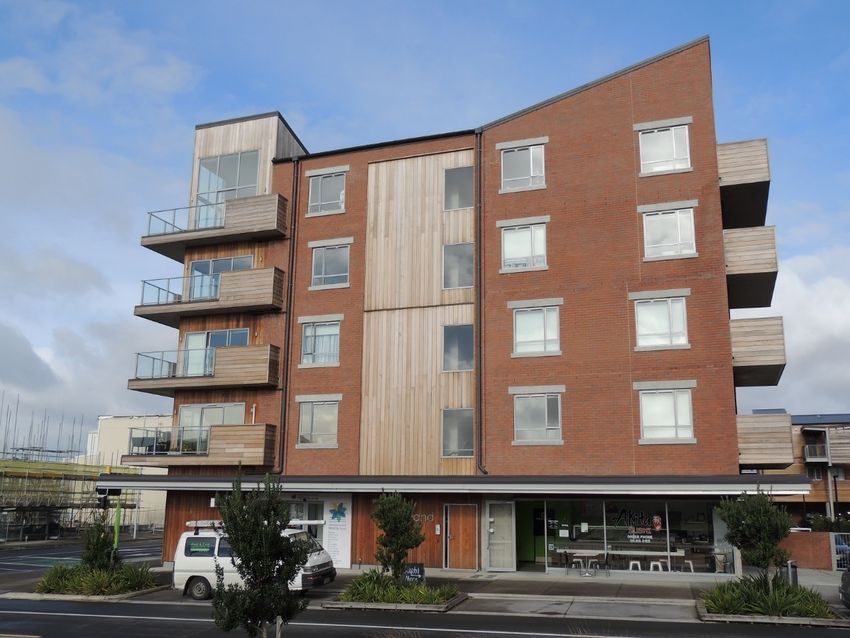
1222 Moonshine Rd, RD1, Porirua 5381
Private Bag 50 908, Porirua 5240        © BRANZ 2017
New Zealand                            ISSN: 1179-6197
branz.nz
Study Report SR379 Medium-density housing demand and supply analysis

Preface
New Zealanders increasingly are living in multi-unit dwellings rather than stand-alone
houses. At present, about 29% of all new dwellings are multi-units. Most of these are
low rise, below 3 storeys. This project contains forecasts of medium-density housing
(MDH), which is a subset of multi-units and is further defined in the report. The ability
of the industry to supply new volumes of MDH is also considered in the forecasts.

This project is one within the BRANZ programme of work on enabling the industry to
provide MDH. The main findings are that new MDH supply is currently about 6,800
units per year, demand remains strong and is increasing. Despite supply constraints,
growth in MDH units is expected to be about 5% per year for the next 9 years. About
48% of these new MDH units are expected to be in Auckland.

Acknowledgements
We would like to thank the numerous external and internal stakeholders who
contributed to this study.

                                                i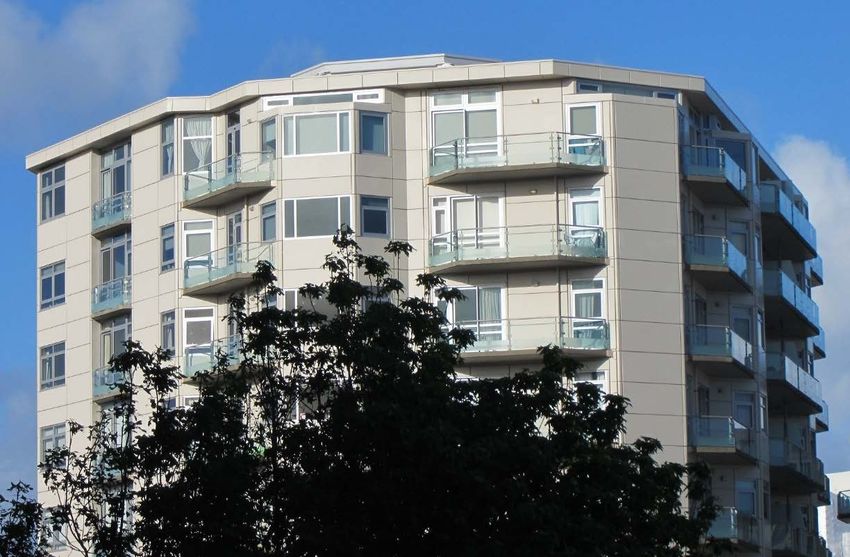
Study Report SR379 Medium-density housing demand and supply analysis

Medium-density housing supply
and demand analysis
BRANZ Study Report SR379
Author
Ian Page

Reference
Page, I. (2017). Medium-density housing supply and demand analysis. BRANZ Study
Report SR379. Porirua, New Zealand: BRANZ Ltd.

Abstract
This report summarises the findings of research into the supply and demand for
medium-density housing (MDH) in the New Zealand market. The principal types of
MDH are illustrated. The drivers of demand are discussed and the capacity of the
industry to provide MDH is outlined. The main findings are that MDH units are being
built at a rate of about 6,800 per year. This number is expected to grow at about 5%
per year through to 2025. By then, MDH will represent about 35% of all new dwellings.

The two main types of MDH units are light-framed units horizontally attached up to 3
storeys in height and concrete/steel-framed units vertically attached 3–6 storeys in
height. The former is forecast at about 74% of new MDH and the latter about 26% of
new MDH.

The supply side is constrained, especially in Auckland, by shortages of skilled labour,
including site management, and council inspection services. Even so, the capacity to
build new housing in Auckland is expected to expand by another 30% over the 3 years
to December 2018.

Keywords
MDH, medium-density housing, housing supply, housing demand, affordability, multi-
units

                                                ii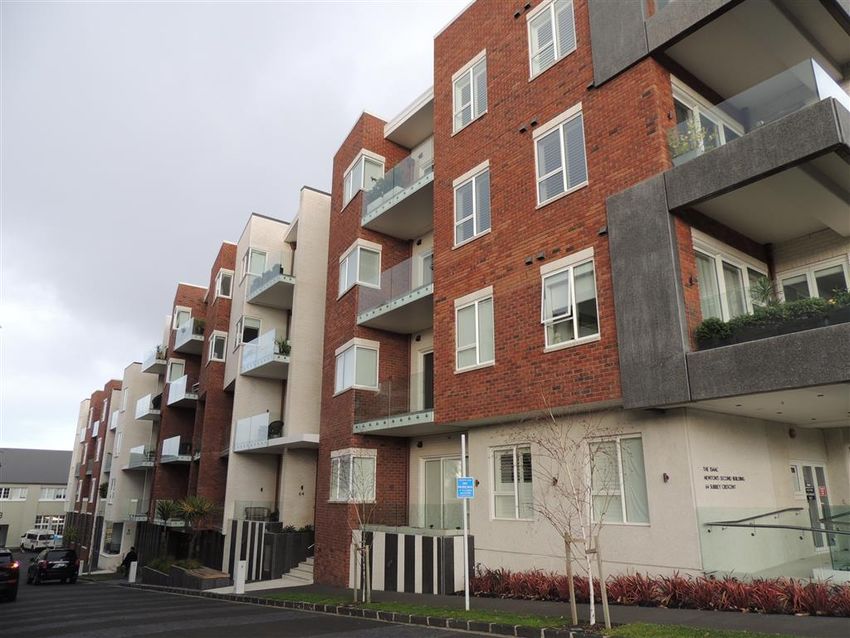
Study Report SR379 Medium-density housing demand and supply analysis

Contents
EXECUTIVE SUMMARY.................................................................................... 1
1.  INTRODUCTION ..................................................................................... 2
    1.1 Literature review ...................................................................................2
        1.1.1 Auckland studies.........................................................................3
    1.2 Definitions of medium-density housing ....................................................6
2.  MDH FUTURE SUPPLY FORECASTS ....................................................... 12
    2.1 Types of MDH construction .................................................................. 14
    2.2 Required labour to deliver future housing supply.................................... 15
    2.3 Affordability and MDH types ................................................................. 16
3.  CURRENT SUPPLY FOR MULTI-UNITS AND MDH ................................. 19
    3.1 Stock numbers of multi-units and MDH ................................................. 19
    3.2 Numbers of new multi-units ................................................................. 19
    3.3 Current types supplied of MDH ............................................................. 21
    3.4 Construction cost of multi-units ............................................................ 23
    3.5 Auckland multi-unit types ..................................................................... 25
4.  FACTORS AFFECTING THE FUTURE SUPPLY OF HOUSING ................... 27
    4.1 Land availability .................................................................................. 27
        4.1.1 Auckland Unitary Plan ............................................................... 27
        4.1.2 Wellington District Plan ............................................................. 28
        4.1.3 Christchurch Plan ...................................................................... 29
    4.2 Labour requirements ........................................................................... 29
        4.2.1 MBIE skills demand forecast ...................................................... 29
        4.2.2 BCITO supply planning .............................................................. 29
        4.2.3 New-entrant supply .................................................................. 31
        4.2.4 Professional skills ...................................................................... 33
    4.3 Access to materials .............................................................................. 33
    4.4 Financiers, developers and builders....................................................... 35
        4.4.1 Developers doing MDH .............................................................. 35
        4.4.2 Finance industry role in MDH ..................................................... 36
        4.4.3 Builders of MDH........................................................................ 36
    4.5 Large companies building MDH............................................................. 37
    4.6 Construction delays as a measure of industry capacity............................ 39
5.  DISCUSSION ........................................................................................ 41
6.  CONCLUSIONS ..................................................................................... 43
REFERENCES ................................................................................................ 44
APPENDIX A ................................................................................................. 46
    A.1 Section prices and land areas ............................................................... 46
    A.2 Forecasting MDH future supply needs ................................................... 48
    A.3 Determining current MDH stock numbers .............................................. 50
    A.4 Storey height distribution of new multi-units .......................................... 51
    A.5 Retirement village dwelling demand model ............................................ 52
    A.6 Average floor areas for MDH ................................................................ 53
    A.7 Canterbury post-earthquake housing consents ....................................... 55

                                                      iii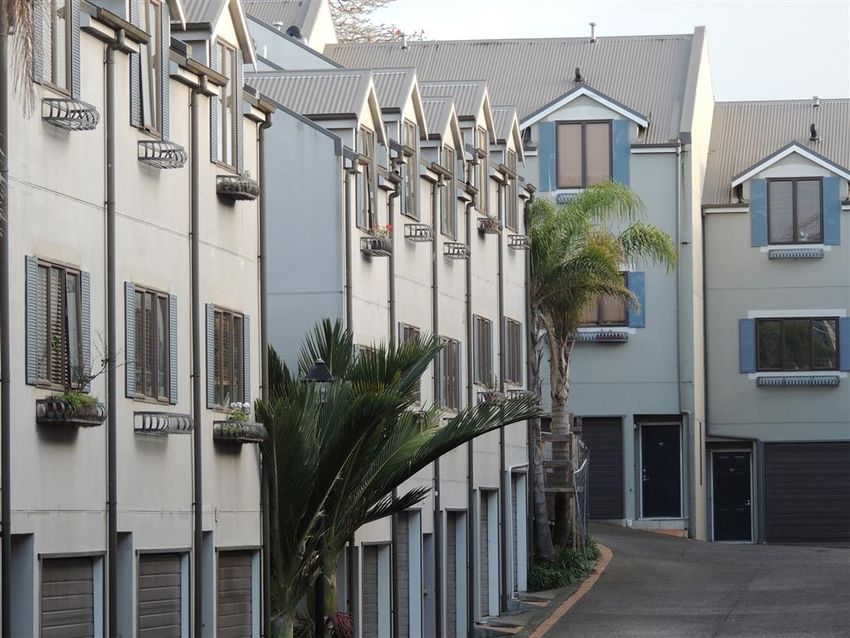
Study Report SR379 Medium-density housing demand and supply analysis

    A.8 Recent offerings of MDH in Auckland .................................................... 56
APPENDIX B: STAKEHOLDER CASE STUDIES ............................................... 57
    B.1 Financiers’ views ................................................................................. 59
    B.2 Developers’ views ................................................................................ 64
        B.2.1 Developer 1 – MDH in Auckland ................................................. 64
        B.2.2 Developer 2 – MDH in Auckland ................................................. 64
        B.2.3 Developer 3 – MDH in Auckland ................................................. 66
    B.3 Designers’ views ................................................................................. 69
        B.3.1 Architect 1 ............................................................................... 69
        B.3.2 Architect 2 ............................................................................... 70
        B.3.3 Architect 3 – MDH in Wellington................................................. 71
        B.3.4 Civil engineer ........................................................................... 73
    B.4 Builders’ views .................................................................................... 74
        B.4.1 Builder 1 .................................................................................. 74
        B.4.2 Builder 2 .................................................................................. 74
        B.4.3 Builder 3 .................................................................................. 74
        B.4.4 Builder 4 .................................................................................. 75
        B.4.5 Builder 5 .................................................................................. 78
        B.4.6 Builder 6 .................................................................................. 80
    B.5 Other stakeholders’ views .................................................................... 83
        B.5.1 Real estate agent...................................................................... 83
        B.5.2 Economist ................................................................................ 84
    B.6 Interview conclusions .......................................................................... 85

Figures
Figure   1. 1-storey flats. ..........................................................................................7
Figure   2. 2-storey flats. ..........................................................................................7
Figure   3. Semi-detached terraced housing. ...............................................................8
Figure   4. 2-storey terraced MDH with garages. .........................................................8
Figure   5. 2-storey terraced or flats MDH (garages accessed at back). .........................9
Figure   6. 3-storey terraced MDH..............................................................................9
Figure   7. 4-storey MDH apartments (concrete/steel construction)............................. 10
Figure   8. 5-storey building – ground floor commercial, 4 levels of apartments above. 10
Figure   9. 6 -storey MDH apartment building. .......................................................... 11
Figure   10. Multi-unit stock by selected regions........................................................ 19
Figure   11. New multi-units for selected regions....................................................... 20
Figure   12. Types of multi-units. ............................................................................. 20
Figure   13. Storey distribution of MDH. ................................................................... 21
Figure   14. MDH storey distribution for Auckland and the rest of New Zealand. .......... 21
Figure   15. Terraced housing by consent size. ......................................................... 22
Figure   16. Apartments by project size. ................................................................... 22
Figure   17. Apartments by storey height.................................................................. 23
Figure   18. $/m2 construction costs for multi-units. .................................................. 24
Figure   19. Auckland residential consents 2007–2016. .............................................. 25
                                                       iv
Study Report SR379 Medium-density housing demand and supply analysis

Figure   20.   Auckland Unitary Plan redevelopment capacity for new housing. .............. 28
Figure   21.   BCITO trainee numbers......................................................................... 31
Figure   22.   Potential recruits for the industry. .......................................................... 32
Figure   23.   Industry skills migration. ....................................................................... 32
Figure   24.   Price indexes for inputs into building work. ............................................. 33
Figure   25.   Ready-mix concrete volumes. ................................................................ 34
Figure   26.   Sawn timber production. ....................................................................... 34
Figure   27.   Residential building work delays. ........................................................... 39
Figure   28.   Residential framing delays. .................................................................... 40
Figure   29.   Industry employment versus workloads. ................................................. 40
Figure   30.   Unit land prices in the main centres. ...................................................... 46
Figure   31.   Section sizes in the main centres (REINZ data). ...................................... 47
Figure   32.   PLT migration by visa type. ................................................................... 48
Figure   33.   New dwelling unit trends and forecasts. ................................................. 49
Figure   34.   Storeys distribution for multi-units – all New Zealand............................... 51
Figure   35.   Multi-unit project size by number of units – all New Zealand. ................... 52
Figure   36.   Modelling retirement village dwelling unit demand................................... 53
Figure   37.   MDH building consent average floor areas. ............................................. 54
Figure   38.   Dwelling consents for selected Canterbury authorities.............................. 55
Figure   39.   Auckland terraced housing consents 2007–2015. .................................... 56

Tables
Table   1. National building consent forecasts for new housing. .................................. 12
Table   2. MDH forecasts......................................................................................... 13
Table   3. MDH consents regional forecasts. ............................................................. 14
Table   4. Auckland-only consents forecasts.............................................................. 14
Table   5. MDH construction types. .......................................................................... 15
Table   6. Demand for skills for all building work. ...................................................... 15
Table   7. Income to price ratios for new dwellings. .................................................. 17
Table   8. Estimated stock numbers. ........................................................................ 19
Table   9. Auckland consent subgroups 2007–2016. .................................................. 26
Table   10. New housing in Wellington city by type 2008–2012. .................................. 28
Table   11. Industry employment demand forecasts. ................................................. 30
Table   12. Major MDH builders. .............................................................................. 38
Table   13. MDH regional percentage shares. ............................................................ 50
Table   14. Regional MDH number of units forecast. .................................................. 50
Table   15. Estimate of MDH stock numbers. ............................................................ 51
Table   16. Development costs in Auckland in 2015. .................................................. 62
Table   17. Other consultants/sundry breakdown. ..................................................... 62
Table   18. Project complexity. ................................................................................ 77
Table   19. MDH cost breakdown – small apartment project. ...................................... 80
Table   20. MDH cost breakdown – apartments and terraced houses. ......................... 82

                                                         v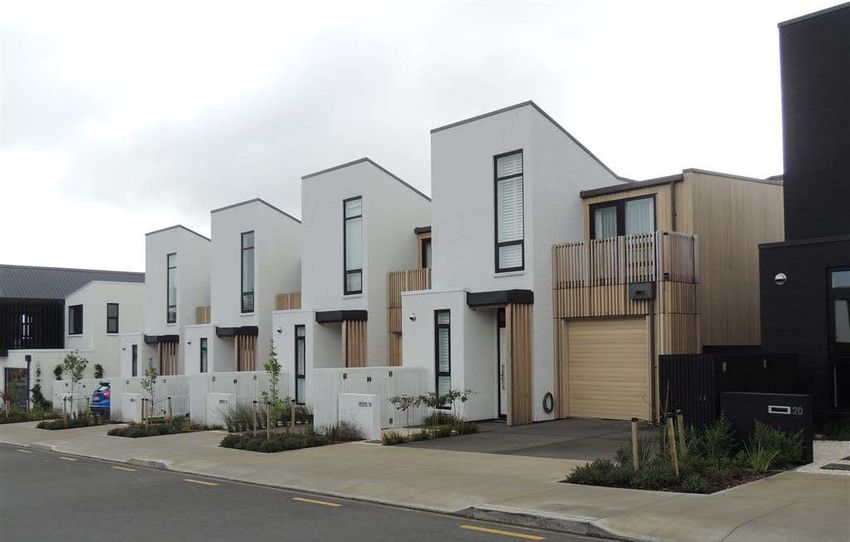
Study Report SR379 Medium-density housing demand and supply analysis

Executive summary
Multi-unit dwellings are projected to be an increasing share of new dwelling
construction. The main driver for this is the rising price of land, particularly in the main
centres. This project is part of a programme of work on medium-density housing
(MDH). The project sets out to provide forecasts of demand for new MDH and includes
breakdowns by type and location.

The forecasts consider the industry’s ability to supply new dwelling units. Due to
capacity constraints, there is a backlog of unmet demand that is projected to be met
over the next few years.

BRANZ (Bryson & Allen, 2017) has defined MDH as multi-unit dwellings below 7 storeys
in height above ground level.

These are the main findings:

•     Detached housing is the predominant new housing type, but multi-units have
      increased their share in recent years and are currently 29% of all dwelling units
      nationally. In Auckland, the percentage for multi-units is higher, at 43%.
•     MDH is a subset of multi-units and, as defined above, makes up 23% of all new
      dwellings. The size of the new MDH market in 2017 is estimated at 6,800 units per
      year and is projected to grow at about 5% per annum over the next 9 years. By
      then, they would number about 10,400 per year and would represent 33% of all
      new dwellings. Auckland would then have about 51% of the New Zealand new
      MDH total.
•     The two main categories of MDH are horizontally attached occupancies and
      vertically attached occupancies. The former is mainly flats and terraced housing of
      up to 3 storeys. The latter category includes some 3–4 storey terraced housing but
      predominantly apartments, which are defined as having ceiling/floors in common
      with other occupancies. They usually have walls in common as well.
•     Horizontally attached units are projected to account for 73% of all MDH in 5 years’
      time, while vertically attached units are projected to account for 23%.
•     Vertically attached units in the MDH group are 2–6 storeys and are built mainly of
      concrete and steel. Horizontally attached MDH (1–3 storeys) is almost all timber or
      light steel-framed construction.
•     Flats and terraced housing are potentially a main first-home choice in the main
      centres. This is based on their relative affordability compared with apartments
      (vertically attached units), which are usually more expensive on a $/m2 basis.
•     New dwelling numbers in Auckland are predicted to peak in 2021 at about 13,100
      units. This 30% increase on current levels is a challenge for the industry. Sufficient
      skilled labour is expected to be available on site, but managers, designers and
      council inspectors may be hard put to meet this level of work.

                                                  1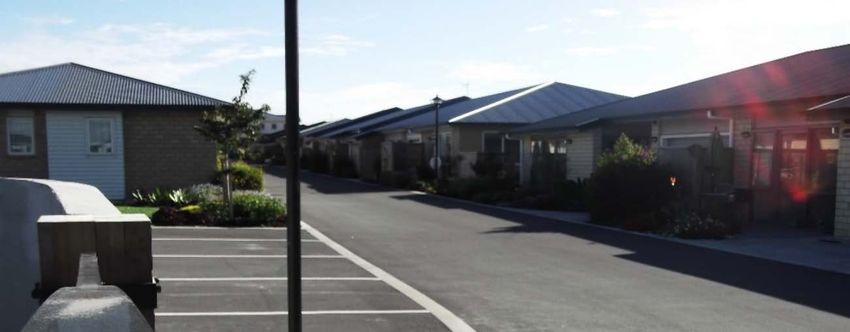
Study Report SR379 Medium-density housing demand and supply analysis

1.          Introduction
This project is part of the work programme at BRANZ on enabling the industry to
deliver medium-density housing (MDH). The project provides estimates of the demand
for MDH by type and region and some analysis of affordability. It also provides case
studies, mainly from developers, of what types of household are in the market for
MDH. Thus, it combines quantitative analysis with qualitative research on the
perceptions of those in the industry.

There are two distinct aspects of housing supply: current supply and future supply.
Current supply includes all available housing stock for purchase or rental, issues
associated with the state of this stock and market forces affecting its procurement by
potential renters, buyers and investors. Future supply includes all housing that is in the
consent pipeline as well as that which could potentially be built as the result of the
convergence of market forces and housing demand. Both sides of housing supply are
considered in this report.

Housing demand results from a combination of housing needs and housing
preferences. Housing needs largely can be determined by identifying demographic
trends and projections and synthesising these alongside tenure trends and projections.
In contrast, housing preferences are subjective and changeable, ultimately resulting in
housing choices through a process of trade-offs. Housing preferences refer to the idea
that the houses that people ‘need’ are not necessarily the houses that people choose.
In this report, the part of demand that is presented relates to the quantifiable aspects
of housing needs. This is rather than relating to the complete – and much more
complex and unpredictable – picture of housing demand, which includes housing
preferences.

The demand forecasts are modified by the industry capacity to supply, and hence the
forecasts are effective supply. Supply capacity is analysed from a survey of building
work put in place plus anecdotal reports, which indicate constraints on supply in most
locations.

MDH is a common and established housing form in large international cities, in forms
such as terraced housing and apartment buildings of up to 6 storeys. These types are
common in Sydney and Vancouver, cities with which ours are often compared
(Environmental Management Services, 2015). However, until recently, MDH types have
not been common in New Zealand, where the detached house and garden on a
1,000 m2 section has been the dominant housing form.

1.1         Literature review
MDH is not new to New Zealand. Examples can be found that were built in the late
19th century, and there are many blocks of flats and grouped houses that were built in
the 1930s. This present study is the latest supply and demand research to be done
that looks specifically at MDH in recent years.

Examination of previous studies dating from 2000 (Auckland Regional Council, 2003;
Grimes, 2007; Grimes & Aitken, 2006a, 2006b; Grimes, Aitken, Mitchell & Smith, 2006;
Harrison Grierson, 2008; Mead & McGregor, 2007; Ministry for the Environment, 2016;
Murphy, 2016; Sharam, Bryant & Alves, 2015; Watson, 2013) show the circumstances
that have created the need for this study. They describe both rising prices and the
growth of MDH as an alternative to traditional housing options, two trends that go
                                               2
Study Report SR379 Medium-density housing demand and supply analysis

hand in hand. Increasing difficulties with the supply of traditional stand-alone houses
have added to the demand for attached types. At the same time, social changes – in
the reducing size of households, particularly – have led to more people wanting
alternatives to the 3-bedroom detached house on a large section in the suburbs.

The state of the market in the early years of this century, the background to this study,
is revealed by Grimes and Aitken (2006b). The research found real construction costs
had remained broadly stable since 1991 but land prices had increased dramatically.
Between 1981 and 2004, the real price of vacant residential sections rose by 286% on
average across New Zealand. The increase in Auckland City was almost 700%. Other
areas were not exempt. In the Queenstown-Lakes region, where the growth of tourism
and the influx of newcomers put pressure on the housing market, real house prices
(adjusted for inflation) rose by 244%. Real prices in Rodney and Thames-Coromandel
rose by around 200%. However, not all regions shared high land and house price
increases. Ten territorial local authorities experienced real house price falls between
1981 and 2004, and four experienced real land price falls. Areas with negative or low
real price rises were predominantly in rural North Island or southern South Island
regions. By 2004, New Zealand had experienced an extended period of price rises,
reflecting urbanisation, economic reform and global changes. Prices continued to rise
in the following years and have yet to stop.

A report by the Department of the Prime Minister and Cabinet (2008) found that real
house prices had increased by 80% since 2002. The report identified population
growth, lower interest rates and increasing availability of credit as factors that boosted
demand. The tax system had encouraged investors into housing, putting further
pressure on prices. The report acknowledged that supply responses in the housing
market tend to be slow since it takes time to turn undeveloped land into new houses
or to subdivide land. Nevertheless, the construction industry built over 120,000
additional dwellings between 2001 and 2006. The report observed that rising prices
contributed to lower home ownership rates and constrained the housing market
choices available to a growing group of New Zealanders. By 2006, only 29% of renting
couples and 2% of renting individuals could afford a lower-quartile price house in their
region and pay a maximum of 30% of their income in mortgage repayments. A
growing group that could not afford a mortgage on a house and would be ineligible for
state housing assistance would need secure long-term tenure arrangements in the
private rental market.

These nationwide studies indicated what was to come: an increasingly difficult housing
market for many New Zealanders as prices continued to rise.

1.1.1       Auckland studies
Much of the research on prices, supply and demand has solely examined the Auckland
region. Auckland is the largest single region of New Zealand and, arguably, has
experienced the most dramatic changes in housing. However, nationwide studies
continue to be an area that would benefit from additional attention from future supply
and demand analyses.

Many of the studies considered in this report have been commissioned by Auckland
local authorities, principally Auckland Regional Council and, from 2010, its successor,
Auckland Council.

A 2003 study by Auckland Regional Council observed that the stand-alone dwelling was
by far the most common type in the Auckland region, accounting for 78% of
                                               3
Study Report SR379 Medium-density housing demand and supply analysis
permanent private dwellings in 2001. This proportion had not changed since 1991
(Auckland Regional Council, 2003). The 3-bedroom house remained the most common
type of home, despite growing numbers of very small and very large households. Both
these ends of the scale were increasing faster than medium-sized households,
reflecting more single people and more multi-generational households. The correlation
between dwelling size and the size of the household was weak. Many households
appeared to be living in dwellings that had more bedrooms than household members.
Larger dwellings of 4 or more bedrooms were increasing at a faster rate than the 3-
bedroom house. At the same time, smaller dwellings of 1 and 2 bedrooms were
increasingly occupied by larger households. Conversely, larger dwellings increasingly
were occupied by smaller households. This study indicates problems of overcrowding
and of inequality. Large households were forced into housing types designed for the
traditional nuclear family, while some small households enjoyed more room than they
needed.
In 1999, Auckland Regional Council adopted the Auckland Regional Growth Strategy,
which promoted nodal-based intensification in the form of terraced and apartment-type
housing around transport hubs, town centres and along important corridors. A later
study (Mead & McGregor, 2007, p. 1) found that, because of this strategy and market
effects, the intensive housing segment grew rapidly over the 10 years to 2006. By this
time, it represented 35% of the total urban housing market in the Auckland region and
over 60% in Auckland city. In this period, the character of intensification also shifted
from infill housing being the main form to terraced housing on brownfield land to
redevelopment of established areas with mid-rise to high-rise apartments. MDH
effectively became an instrument of housing policy – a means of achieving
intensification and avoiding further outward growth of the city (Mead & McGregor,
2007).
A 2007 paper by Grimes summarised and synthesised results from several studies
dealing with the impacts of land availability, housing supply and associated planning
infrastructure on New Zealand house prices (Grimes, 2007). Grimes found that
restrictions on land supply around Auckland – partially a result of that city’s planning
infrastructure – were instrumental in raising land costs. The consenting processes in
Auckland also limited supply responsiveness. Across New Zealand, regions with high
supply responsiveness were found to have relatively small price spikes following
demand shocks.
Grimes et al. (2006) examined constraints to expansion of Auckland’s housing supply.
Since 2000, increased demand for housing outstripped increases in supply, resulting in
major increases in land and house prices. Demand was increased by positive net
immigration, higher incomes and higher employment, coupled with strong ability to
borrow to finance property purchases. At the same time, a number of factors
constrained supply, including the limited supply of land and delays in the consents
process.
Policy also affected the supply of land for intensification. A 2008 study observed that
land supply in the Auckland region was governed by the growth concept, a crucial
element of the Auckland Regional Growth Strategy (Harrison Grierson, 2008). This was
premised on the idea of a compact city form, with growth focused in and around
centres and along transport corridors, limiting sprawl and protecting arable land at the
peripheries. The city was constrained by the Metropolitan Urban Limit, which divided
the region between urban and rural land uses, containing growth within its urban
borders. This policy was intended to protect the rural edges of the Auckland region
4Study Report SR379 Medium-density housing demand and supply analysis
from sprawl but also limited land supply. This created incentives for more efficient land
use within Auckland’s urban areas but also could lead to inefficient allocation of land,
price increases and delay in the rate of release of residential land. A later discussion
paper (Gray & Hill, 2010) found the Auckland Regional Growth Strategy appeared to
have had little impact on the pattern or quality of urban development. Intensification
had occurred but not in the right places or of sufficient magnitude to challenge the
region’s suburban housing culture.
Recent studies have noted increasing problems both in Auckland and in the rest of
New Zealand. A paper by the Chief Economist of Auckland Council observed that the
median house price in metropolitan Auckland was about 10 times greater than the
median household income (Parker, 2015). Increases in prices had benefited a large
number of owner-occupier households and landlords in Auckland but disadvantaged
those who did not own their own property but who wanted to buy in Auckland. Parker
considered the housing affordability problem to be driven by the market signalling the
need to transform the housing stock to accommodate up to 1 million more people over
the next 30 years. He suggested a number of supply and demand drivers.
The demand issues included:
• people buying land in the expectation of profit from Auckland’s future success as a
world-class city
• inelastic supply and high costs (because creating new homes is slow and
expensive)
• natural population growth putting pressure on prices
• strong migration driven by a worldwide trend for people to move to major regional
cities
• a tax system that allowed investors to pay less income tax when they invest in loss-
making properties but pay no tax on capital gains.
Supply drivers included:
• planning constraints
• design requirements such as building height limits, minimum apartment sizes and
floor to ceiling heights
• environmental performance requirements.
A paper for the Reserve Bank observed that low housing supply responsiveness can
result in volatile house price inflation and increases in house prices that appear to be
semi-permanent (Watson, 2013). Supply tends to be slow to respond to increased
demand, particularly in Auckland, where population growth is strong and, as noted
above, land supply is constrained by regulation. Expectations of continuing land
scarcity and population pressures in Auckland may underpin expectations that
Auckland house prices will continue rising in the future. However, Watson warned,
rising house prices have a tendency to overshoot and then ultimately to reverse
substantially. A change in the balance between population growth and new housing
supply could lead to a significant and sustained fall in real house prices.
The emphasis of this research has been on house supply and prices, and it is from
these studies that this update by BRANZ was developed.
5Study Report SR379 Medium-density housing demand and supply analysis
1.2 Definitions of medium-density housing
For the purposes of this report, the definition of MDH is as follows:
• 6 storeys or fewer in height above ground level.
• No constraints on MDH land density or on the project size.
• MDH types included include duplexes, flats, attached townhouses, terraced housing
and apartments.
Statistics New Zealand (2015) has three categories of multi-unit housing construction
in its building consent series. All three fall partly or wholly into the MDH definition:
• Apartments – these have a floor/ceiling in common with any occupancy and may
also have an inter-tenancy wall in common with an adjacent occupancy.
• Townhouses/flats/terraced housing – these have a wall in common with other
occupancies but no adjacent vertical occupancy.
• Retirement villages – these are a mix of the other two categories. They have a
mixture of apartments and flats/townhouses/terraced housing. They also include
some detached houses, which that are not included in the MDH definition.
Forecasting is based on these categories with survey data providing a guide to the
percentage of units in each category that are MDH.
Apartments of 6 storeys or fewer fall within the MDH definition, and about 60% of new
apartments (in number of units) are within the definition, the rest being in high-rise
buildings. Constructions of 3 storeys and below are typically built with light timber
framing. Those of 4 storeys and above are typically built with concrete and/or steel
framing with concrete floors, timber partitions and inter-tenancy walls. Some
apartments, with a basement garage area below ground level, have 6 storeys above,
and these are included in our definition of MDH. Similarly, 6-storey developments with
commercial use at the ground level and apartments above are included.
Townhouses/flats and terraced housing are a varied group that includes every dwelling
type that is not vertically attached to another occupancy. The distinction between them
can be somewhat blurred. For the purposes of this report the following definitions are
used:
• Townhouses are small attached 2-storey houses or duplex 2-storey houses.
• Flats are a row of single or 2-storey units. They have a continuous roof ridge line
and commonly consist of two or more units.
• Terraced housing consists of a row of 2 or 3 storey units, consisting of 3 or more
units per building. The roof lines are individual to each unit.
The walls separating tenancies of townhouses, flats and terraced housing are typically
built of precast concrete partitions or double timber stud walls, with lightweight
materials used for wall partitions and upper floors.
Retirement village building consents are usually a mixture of terraced housing or flats
(estimated at 55%) and apartments (40%). There are also a small number of detached
houses (5%) in these villages. Very few of the village apartments are over 6 storeys in
height, so they mainly fall into the MDH category.
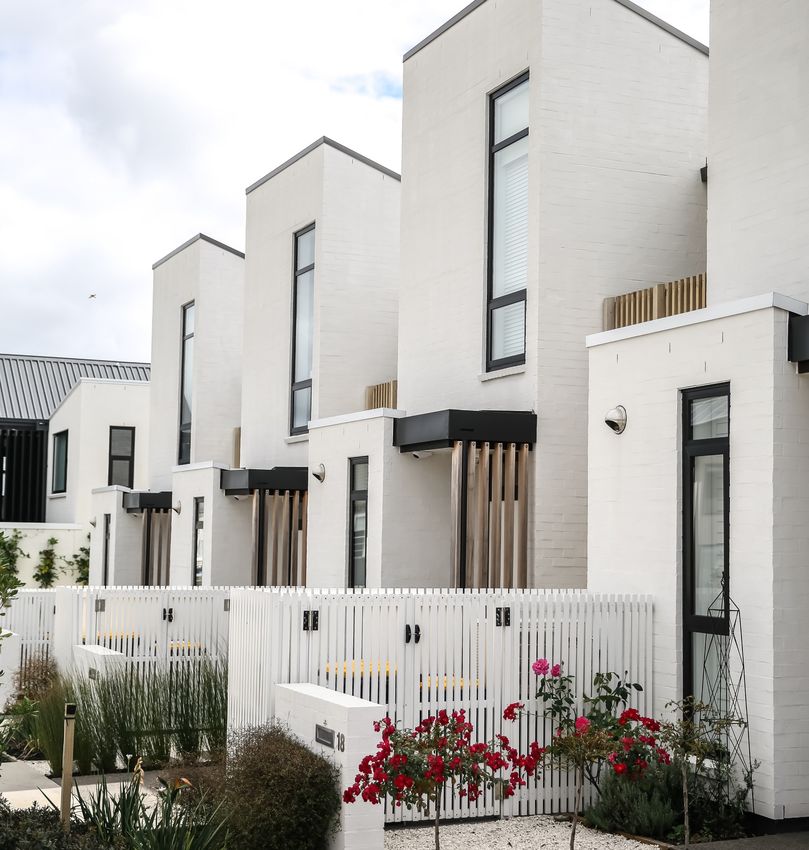
Examples of the MDH typologies are shown in Figure 1 to Figure 9. Figure 1 is a
common type of layout for a retirement village where small units are adjacent in single
6Study Report SR379 Medium-density housing demand and supply analysis
long rows of housing. Figure 2 consists of 8 units, described as studio apartments with
some shared kitchen facilities.
Figure 3 shows semi-detached houses. Figure 4 and Figure 5 are 2-storey terraced
housing with different arrangements for garaging, with rear facilities in the latter.
Figure 6 is 3-storey terraced housing with the common arrangement of the garage
taking most of the ground floor. These MDH typologies use timber framing for the
walls and floors and are horizontally attached using either a double stud wall or
concrete panels.
Figure 7, Figure 8 and Figure 9 are apartments with both vertical and horizontal
tenancies. Their main structural framing is concrete and steel, with concrete floors.
Figure 1. 1-storey flats.
Figure 2. 2-storey flats.
7Study Report SR379 Medium-density housing demand and supply analysis
Figure 3. Semi-detached terraced housing.
Figure 4. 2-storey terraced MDH with garages.
8Study Report SR379 Medium-density housing demand and supply analysis
Figure 5. 2-storey terraced or flats MDH (garages accessed at back).
Figure 6. 3-storey terraced MDH.
9Study Report SR379 Medium-density housing demand and supply analysis
Figure 7. 4-storey MDH apartments (concrete/steel construction).
Figure 8. 5-storey building – ground floor commercial, 4 levels of apartments above.
10Study Report SR379 Medium-density housing demand and supply analysis
Figure 9. 6 -storey MDH apartment building.
11Study Report SR379 Medium-density housing demand and supply analysis
2. MDH future supply forecasts
This section presents forecasts for new housing and MDH. They are based on the
National Construction Pipeline (NCP) Report (MBIE, BRANZ & Pacifecon, 2016). A small
upward adjustment in the new dwelling numbers was applied to the NCP forecasts to
allow for subsequent higher than expected migration numbers. This adjustment is
described further in Appendix A.2.
The NCP forecasts use household formation scenarios from Statistics New Zealand. A
medium to high scenario was used. To this was added demolition replacements and
demand for second homes (i.e. holiday homes, weekday apartments).
The forecasts are for number of new dwelling units for detached and multi-unit
numbers by regional council out to 2021. The NCP forecasts of multi-unit are broken
down into apartments, retirement villages and townhouses/flats/terraces – the
categories Statistics New Zealand uses, as described above.
Table 1 contains the forecasts extended out to 2025. The table shows approximately
30,000 dwelling units nationally at the end of 2016, continuing to 34,500 in the
following 3 years. Multi-units as a percentage increase through to 2025, reflecting
housing intensification in the cities.
Table 1. National building consent forecasts for new housing.
Building consents for residential units
Calendar year 2014 2015 2016 2017 2018 2019 2020 2021 2022 2023 2024 2025
actual BRANZ forecasts based on MBIE forecast
Number of units
Detached 18359 19038 21310 21904 22430 22909 22368 20246 19127 18642 17570 17100
Apartments 1721 2539 2307 2571 2848 3140 3305 3220 3270 3423 3462 3612
Retirement village units 1917 1899 1952 2120 2288 2457 2517 2386 2356 2397 2355 2387
Flats/townhse/terraces 2720 3656 4401 4905 5435 5994 6310 6148 6246 6538 6613 6902
24717 27132 29970 31500 33000 34500 34500 32000 31000 31000 30000 30000
Multi-units percentage share
26% 30% 29% 30% 32% 34% 35% 37% 38% 40% 41% 43%
Multi-units breakdown %
Apartments 27% 31% 27% 27% 27% 27% 27% 27% 28% 28% 28% 28%
Retirement village units 30% 23% 23% 22% 22% 21% 21% 20% 20% 19% 19% 19%
Flats/townhse/terraces 43% 45% 51% 51% 51% 52% 52% 52% 53% 53% 53% 54%
100% 100% 100% 100% 100% 100% 100% 100% 100% 100% 100% 100%
The NCP forecasts take account of the industry capacity to supply, which is assumed to
be capped at 13,000 dwelling units per year in Auckland. The logic of this cap is not
discussed in the NCP report but is based on several factors, as follows:
• The previous peak in Auckland supply was 12,000 units per annum in 2004, some
of which were office conversions. This level is taken as near the upper limit of
capacity for the region.
• Discussion with several builders of detached and low-rise housing indicated they
will struggle to expand significantly in the next 2–3 years due to skill shortages and
some material constraints. Apartment builders are also under resource constraints
in Auckland with the commercial building sector in an expansion phase (currently
running at about 15% growth annually). These two segments compete for
resources.
12Study Report SR379 Medium-density housing demand and supply analysis
• Industry training organisations are under some pressure to train more young
people for work in the industry. This takes time to achieve.
• Inward migration of industry skills continues, but it takes time for these workers to
adjust to local Building Code requirements. Councils in the main centres are finding
difficulty in obtaining trained inspectors, both locally and from overseas.
• Building firm owners are wary of boom-bust cycles, which have occurred in the
past. They prefer steady workloads extended over several years rather than boom
times for a 1–2 year period. Their preference is to not expand their business
significantly over a short period, even assuming extra resource is available.
For these reasons, the ability and wishes of the industry to respond to unmet demand
is limited, and actual supply of some new housing demand is deferred. The level of
unsatisfied demand is estimated at about 32,000 dwellings units nationally by mid-
2018. The forecasts allow for this backlog to be met over several years.
The forecasts in Table 1 average about 31,900 new dwelling units per year to 2025.
This includes about 26,000 units per year in underlying demographic demand after
mid-2018 plus 5,900 units per year in catch up.
Detached housing is projected to decline in favour of multi-units, apartments and
terraced housing. In Auckland, apartments up to 6 storeys are permitted on the fringe
of the 10 metro centres and within the 33 town centres. This is set out in the finalised
Unitary Plan (Auckland Council, 2016). The Unitary Plan is expected to encourage
growth in new apartments. Retirement village units are projected to level out, after an
upturn in recent years. The reasons for this are discussed in Appendix A.5.
Flats/terraced housing enjoy good growth, driven by better affordability than other
multi-unit types, due to lower construction costs.
MDH demand is a subset of the numbers in Table 1 and is shown in Table 2. Figures
are derived by applying the percentages shown in Table 2 to the category numbers in
Table 1.
Table 2. MDH forecasts.
Forecasts of MDH units by type
Calendar year 2014 2015 2016 2017 2018 2019 2020 2021 2022 2023 2024 2025
actual BRANZ forecasts
Apartments 998 1473 1338 1474 1614 1759 1829 1760 1766 1826 1823 1878
Retirement village units 1438 1424 1523 1670 1820 1973 2041 1954 1948 2000 1984 2029
Flats/townhse/terraces 2339 3144 3961 4442 4951 5495 5819 5704 5829 6139 6246 6556
4775 6041 6822 7586 8385 9227 9689 9418 9543 9965 10052 10463
Percentage of housing types that are MDH
Apartments 58% 58% 57% 57% 56% 55% 55% 54% 53% 53% 52%
Retirement village units 75% 78% 79% 80% 80% 81% 82% 83% 83% 84% 85%
Flats/townhse/terraces 86% 90% 91% 91% 92% 92% 93% 93% 94% 94% 95%
All dwelling units 22% 23% 24% 25% 27% 28% 29% 31% 32% 34% 35%
Planning in the three main centres encourages apartment units in the CBD and the
metro centres. About half the new units will be 6 storeys or fewer.
Retirement village complexes vary significantly from detached or semi-detached villas
to flats, terraced housing and apartments. Quite low-density villages, outside our MDH
definition, are common at present, particularly in semi-rural areas. However, more of
these villages are being built in the suburbs of the main cities, and the percentage of
these within the MDH definition is projected to rise.
13Study Report SR379 Medium-density housing demand and supply analysis
In the flats/townhouses/terraced housing group, currently about 90% are in the MDH
definition. The other 10% are detached townhouses, closely spaced. The proportion of
townhouses in this group is expected to gradually decrease through to 2025.
In total, the MDH group has significant growth over the next 9 years, averaging 5%
growth per year and up 53% on current construction starts by 2025, from 2016.
The regional forecasts for MDH consents are in Table 3, and the percentage shares are
in Appendix A.2. The three main centres have most of the MDH units (about 76%).
Table 3. MDH consents regional forecasts.
Forecasts for MDH consents
BRANZ forecasts
Calendar year 2016 2017 2018 2019 2020 2021 2022 2023 2024 2025
Auckland Region 3144 3541 3964 4416 4695 4619 4737 5005 5108 5379
Waikato/BoP regions 893 1007 1130 1261 1342 1323 1359 1438 1469 1549
Wellington Region 477 542 612 687 736 730 754 802 824 874
Canterbury Region 1704 1818 1924 2023 2026 1873 1801 1779 1692 1655
Other regions 604 678 757 840 891 874 893 941 958 1006
TOTAL 6822 7586 8385 9227 9689 9418 9543 9965 10052 10463
Currently, Auckland has 33% of new dwelling unit consents and is projected to have
43% of the national total by 2025. For new MDH units, Auckland currently has 46% of
the national total, and this is projected to increase to 51% by 2025 (Table 4).
Table 4. Auckland-only consents forecasts.
Auckland dwelling consents forecast
Calendar year 2016 2017 2018 2019 2020 2021 2022 2023 2024 2025
All dwelling units 10026 11057 11908 12788 13127 12491 12405 13120 13000 13000
Multiunits 4283 4786 5332 5913 6258 6130 6260 6798 6695 7022
MDH units 3144 3541 3964 4416 4695 4619 4737 5005 5108 5379
2.1 Types of MDH construction
This section provides a breakdown of MDH by horizontally and vertically attached units.
As described earlier, the attachment refers to separate occupancies. Horizontally
attached units often extend to 3 levels.
The reason for the distinction in this report between vertically and horizontally
attached occupancies is that this affects the type of structure. Horizontally attached
units are almost always constructed from light timber framing or light steel framing.
They may have either concrete panel or double stud walls between occupancies. The
methods of construction are similar to detached housing, and labour skills are readily
transferable between the two. Vertically attached units often have concrete and
structural steel framing with concrete floors for acoustic reasons, and this usually
occurs at 3 storeys and above. The method of construction, and the firms doing this
work, differ from traditional residential construction.
It is apparent from Table 5 that most new construction types are horizontally attached
units, and these will be mainly light timber framing and light steel framing up to 3
storeys. However, the vertically attached sector is forecast to grow by 38% over the
next 9 years.
14Study Report SR379 Medium-density housing demand and supply analysis
Table 5. MDH construction types.
MDH by type of construction
Calendar year 2014 2015 2016 2017 2018 2019 2020 2021 2022 2023 2024 2025
actual BRANZ forecasts
Vertically attached (1) 1501 1971 1871 2058 2251 2449 2543 2444 2448 2526 2517 2588
Horizontally attached (2) 3274 4070 4951 5527 6134 6777 7146 6974 7095 7439 7535 7875
4775 6041 6822 7586 8385 9227 9689 9418 9543 9965 10052 10463
Retirement village units are assumed to be spread as follows:
Vertically attached Horizontally attached Total
35% 65% 100%
(1) Vertically attached units are apartments plus a percentage of retirement village units as above.
They are usually attached horizontally, as well as vertically, to other occupancies.
(2) Horizontally attached units are flats/ terraced housing plus a percentage of retirement village units as above.
They have the same occupancy on all levels up to 3 storeys and do not have attachment to other units vertically.
2.2 Required labour to deliver future housing supply
The Ministry of Business, Innovation and Employment (MBIE) has produced forecasts
of the future demand for building industry labour (MBIE, 2016). Their forecasts are
based on the National Construction Pipeline Report (MBIE et al., 2016) forecasts of all
work activity. Since that report has demand forecasts restricted by the industry’s ability
to supply, the skill demand forecasts are probably on the low side.
The forecasts allow for the age structure of the current workforce and make
assumptions on retirement rates. The labour numbers in Table 6 are for all building
and civil work, not just MDH. Table 6 indicates quite modest growth rates in overall
demand for the skills listed. Carpenter demand growth rates are quite low and reflect
the dwelling activity forecasts, which are for a peak in work in 2018 and then a slight
decline. The other skills shown in the table are more intensively used in non-residential
work than residential, and the workload forecasts for those sectors are for continuing
growth to 2021.
Table 6. Demand for skills for all building work.
Demand for skills
MBIE forecasts
Number of persons
Auckland incr to Waikato incr to Wellngtn incr to Canterby incr to Rest incr to All NZ incr to
at 2015 2021 /BOP 2021 at 2015 2021 at 2015 2021 of NZ 2021 at 2015 2021
at 2015 at 2015
Designers 2222 551 1123 90 560 52 1315 -244 1606 155 6827 605
Carpenters 3787 1296 1871 37 1513 145 3255 -954 3810 61 14236 584
Plumbers 3252 1232 1491 109 1167 149 1708 -400 2335 192 9953 1282
Electricians 5780 1866 2569 196 1669 207 2524 -375 4154 385 16696 2279
Bldg labourers 3437 206 1644 27 970 9 2478 -86 2924 132 11454 289
% annual growth in demand to 2021
Designers 3.8% 1.3% 1.5% -3.4% 1.5% 1.4%
Carpenters 5.0% 0.3% 1.5% -5.6% 0.3% 0.7%
Plumbers 5.5% 1.2% 2.0% -4.4% 1.3% 2.0%
Electricians 4.8% 1.2% 2.0% -2.6% 1.5% 2.2%
Bldg labourers 4.2% 1.0% 1.6% -3.7% 1.3% 1.3%
Source: MBIE (2016).
At present, about 29% of new dwellings are multi-units. This is projected to increase
to 36% by 2021 (see Table 1), so the type of work within each skill group will alter
15Study Report SR379 Medium-density housing demand and supply analysis
slightly. The amount of MDH also grows quite strongly at 5% per annum, so it is
apparent labour will need to be diverted from other forms of buildings.
Workers will need to be better organised in their work, since they are likely to be doing
their jobs on a larger scale than for detached housing. There will be more fixed
deadlines and a need to coordinate better with other trades on the more confined sites
of MDH construction.
Section 4.2 discusses the future planning for skills.
2.3 Affordability and MDH types
There are a variety of factors influencing demand for new housing. These include
demographics, housing preferences, housing investment incentives and affordability.
Migration and household formation are discussed in Appendix A.2. Housing as an
investment is an obvious driver of demand but mainly has been directed at existing
housing. Affordability is a major factor in housing ownership, affecting household
formation rates and the type of housing likely to be built. This aspect is discussed
below.
A simple measure of affordability for owner-occupiers is the new dwelling price to
household income ratio. Traditionally, the affordable level is assumed to be around 3:1
for the average household, but a higher ratio may be affordable, depending on the
amount of deposit. An alternative measure of affordability is that mortgage repayments
should not exceed 40% of take-home household income. 1
Table 7 shows these two measures for new housing by region. Three dwelling types
are shown – detached houses, apartments and flats/terraced housing.
The price is based on average consent values with an adjustment for other costs (such
as land, consultants, fees and charges, financing costs and the developer’s profit). The
adjustment is a multiplication factor of 1.8 for new detached houses, 3.0 for new
apartment consent values and 2.0 for flats/terraced housing consent values. The case
studies in Appendix B for typical selling prices in $/m2 have been used to determine the
multiplication factors.
The first panel in Table 7 is for actual consent values in the June 2016 year. It shows
that, in all regions, all three housing types are unaffordable for the median household
at average dwelling prices, using the price-to-income ratio as a measure of
affordability.
The other measure in the top panel – percentage of after-tax income spent on
repayments – indicates that new flats and terraced housing are affordable in all
regions, while apartments are affordable only in Wellington.
The second panel uses the same-sized dwellings in all regions and the regional $/m2
rate for June 2016. This reduces the dwelling costs in Auckland and the rest of New
Zealand but increases them in the other two regions, when compared to the first
panel. The annual repayments as a percentage of income changes accordingly but is
not greatly different from the first panel. Flats and terraced housing are affordable in
all regions, and the other dwelling types are generally not affordable.
1
http://www.interest.co.nz/property/home-loan-affordability
16Study Report SR379 Medium-density housing demand and supply analysis
Table 7. Income to price ratios for new dwellings.
Household income to price ratios
Selling price ($000) (1) June 2016
Median HH Income 1.8 3.0 2.0 = factor up Price:Income ratio
at Jun16 (2) House Apartmt Flat/TH/Terrace House Apartmt Flat/Terrace
Auckland 89600 767 1188 454 8.6 13.3 5.1
Wellington 93200 618 319 344 6.6 3.4 3.7
Canterbury 85800 673 813 484 7.8 9.5 5.6
Rest of NZ 78000 626 515 392 8.0 6.6 5.0
Annual repayments (3) ($000) % of after tax household income (4)
Auckland 43.5 67.4 25.8 61% 94% 36%
Wellington 35.1 18.1 19.5 47% 24% 26%
Canterbury 38.2 46.1 27.5 56% 67% 40%
Rest of NZ 35.5 29.2 22.3 57% 47% 36%
Standardised selling price ($000) (5) Standard floor sizes are: sqm
House Apartmt Flat/TH/Terrace House Apartmt Flat/TH/Terrace
Auckland 689 964 409 209 100 110
Wellington 702 455 383
Canterbury 709 934 498
Rest of NZ 650 463 369
Annual repayments (3) ($000) % of household income
Auckland 39.1 54.7 23.2 55% 76% 32%
Wellington 39.9 25.8 21.7 53% 35% 29%
Canterbury 40.2 53.0 28.3 59% 77% 41%
Rest of NZ 36.9 26.3 20.9 59% 42% 34%
(1) Factor up average consent values by 1.5 or 3 or 2 to allow for other costs of the developer.
(2) From the www.interest.co.nz website, accessed on 16th August 2016.
(3) Assume a 20% deposit and 5% mortgage rate for 25 years.
(4) After tax income is 80% of gross.
(5) Standardised price uses the standard floor sizes (average of last 3 years in all regions), and June16 qtr
$ per sqm rate for each dwelling type and region.
A reduction in dwelling size affects affordability. For example, a 30% reduction in June
2016 average house sizes (to around 140 m2) is affordable in all regions. Halving the
size of the Auckland and Canterbury apartments (to about 50 m2) makes them
affordable. Affordability also changes with a change in the amount of deposit.
The second affordability measure (repayments as a percentage of income) is
considered a better measure for two reasons:
• Percentage of income spent on housing is a better measure, since it allows for
changes in mortgage repayments, which change with interest rates. In the current
period of low interest rates, the capital amount that is affordable has risen. The
measure also ensures a significant proportion of income is available for other living
costs.
• The price-to-income ratio benchmark of 3:1 was set in the 1970s and 1980s – a
period of significantly higher mortgage interest rates. With current low mortgage
rates, a higher price-to-income ratio is more appropriate as a measure.
Table 7 is a snapshot at mid-2016 of median incomes and average prices. There will be
a range of affordability outcomes for different types of households buying different
types of new MDH.
17Study Report SR379 Medium-density housing demand and supply analysis
Interest rates are expected to rise, but not until 2018, 2 affecting affordability but only
by a small amount, given current monetary policy and low inflation in the world
economy. However, at over 6% per year, building costs 3 are rising faster than
incomes. Since mid-2016, affordability would have declined.
2
http://www.rbnz.govt.nz/-
/media/ReserveBank/Files/Publications/Monetary%20policy%20statements/2017/mpsfeb17.pdf
3
http://www.stats.govt.nz/infoshare/ViewTable.aspx?pxID=d91a07a0-a13f-4983-9380-
81f28e98fd3c
18Study Report SR379 Medium-density housing demand and supply analysis
3. Current supply for multi-units and MDH
This section discusses stock numbers for MDH, recent trends in the supply of multi-
units and MDH and some cost data. Further details are provided of multi-unit type and
cost in Auckland, due to the concentration of new units there.
3.1 Stock numbers of multi-units and MDH
As stated earlier, multi-units are dwellings physically attached to at least one other
dwelling unit. Their total numbers are estimated at approximately 312,000 in 2016 (see
Table 8, and see Table 15 for the derivation of stock numbers). MDH is a subset of
multi-units. Unfortunately, Statistics New Zealand does not record them as a separate
category. Instead, BRANZ has estimated their number, deriving a total of 127,000 units
at present. Multi-units are about 17% and MDH about 7% of the total stock of
dwellings.
Table 8. Estimated stock numbers.
Multi-unit and MDH stock numbers
At September 2016
As % of
all stock
Estimated stock of multi-units at December 2016. 312,000 17%
Estimated stock of MDH at December 2016. 127,000 7%
Estimated total stock all dwellings 1,826,000
Multi-units as a percentage of total stock by region, at Census time, were higher in
Auckland and Wellington than the national average (see Figure 10). The shares are
estimated to have increased by 1–2% in each region since then.
Multi-unit as % of total stock of dwellings in the region
25%
Statistics NZ , 2013 Census
20%
15%
10%
5%
0%
Auckland Wellington Canterbury Rest NZ
Figure 10. Multi-unit stock by selected regions.
3.2 Numbers of new multi-units
The supply of multi-units has increased markedly in recent years, and Figure 11 shows
regional trends. The chart is of building consents, and as mentioned earlier, it is
assumed the drop-out rate is low, at about 1%. Media reports have recently described
quite high levels of cancellation of apartment projects in Auckland. However, most of
19You can also read