Lighting Africa Market Trends Report 2012 - Barefoot Power Pty Ltd

Page created by Virginia Olson
 
CONTINUE READING
Lighting Africa Market Trends Report 2012 - Barefoot Power Pty Ltd
Barefoot Power Pty Ltd

                                                     Barefoot Power Pty Ltd

 Lighting Africa Market
 Trends Report 2012
Overview of the Off-Grid Lighting Market in Africa
Lighting Africa Market Trends Report 2012 - Barefoot Power Pty Ltd
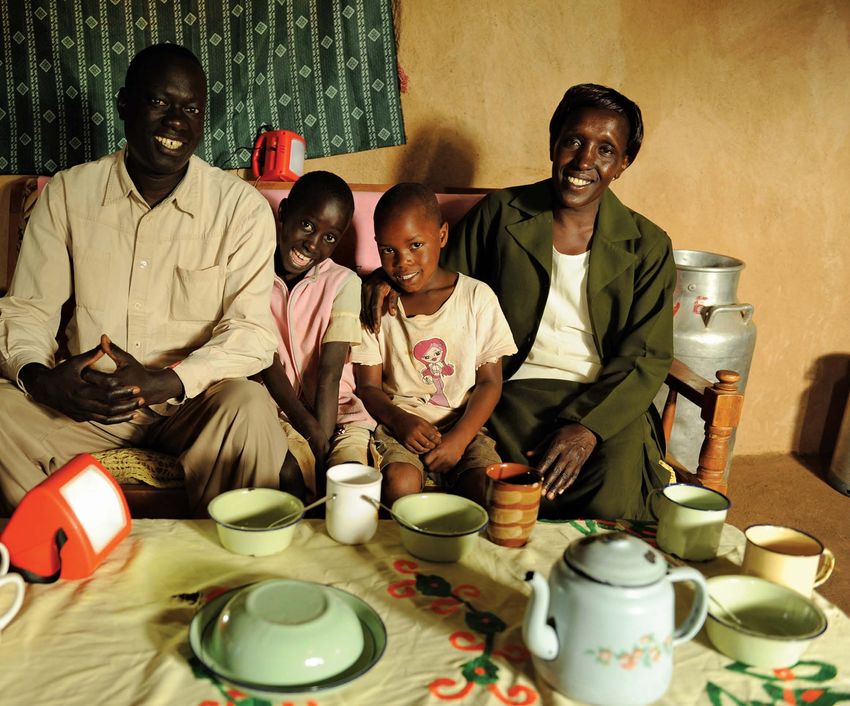
01            Lighting Africa Market                                                                                                           Lighting Africa Market     02
         April 2013       Trends Report                                                                                                                            Trends Report    April 2013

                                                                              Acknowledgements                            Content

                                                                             This report was commissioned by
                                                                                                                          List of figures													                                            4
                                                                             Lighting Africa, a joint initiative of IFC
                                                                            and the World Bank, and developed             List of abbreviations						 						 5
                                                                           in partnership with Dalberg Global
                                                                           Development Advisors.                          Background to Lighting Africa											 6

                                                                                                                          Scope														 7
                                                                           The report is an update to the original
                                                                          ‘Solar Lighting for the Base of the Pyramid:    Executive summary												 8
                                                                          Overview of an Emerging Market’ report
                                                                                                                          1.   Introduction												17
                                                                         published in 2010, which provided a
                                                                         snapshot of the off-grid lighting market,        2.   Product and performance										21
                                                                        industry-level data and analysis on key trends.
                                                                                                                          3.   Current market status											28
                                                                       The current report updates the market trends
                                                                       and developments since 2010. It relies on the           Demand													28
                                                                      inputs of a broad range of industry experts,
                                                                      manufacturers, distributors, scientists, market          Key market drivers											32
                                                                     researchers, and NGO leaders worldwide who                Supply													36
                                                                    contributed their views, time, and advice to the
                                                                    preparation of this document.                         4.   Product economics											                                      40

                                                                                                                               The PLS value chain											                                    40
                                                                   Lighting Africa would particularly like to thank all
                                                                  the Lighting Africa team members who provided                Economics of manufacturing										                              41
                                                                  market research input, research support, guidance,
                                                                                                                          5.   Market barriers												                                       54
                                                                 and feedback throughout the process. Lighting
                                                                 Africa would also like to extend thanks to the                Access to finance											                                      55
                                                                Dalberg consultants and researchers worldwide
                                                                who conducted the market survey interviews and                 Distribution												68
                                                               desk research and the Dalberg Global Development                Consumer awareness and marketing									73
                                                               Advisors for their analysis.
                                                                                                                               After-sales services											78
                                                              The report will be updated every two years.
                                                                                                                               Market spoilage 												80

                                                             We welcome your feedback and support in this effort               Policy 												                                               84
                                                             and encourage you to reach out to the Lighting Africa
                                                                                                                          6.   Market forecast 				   							                                    87
                                                            team with your questions and feedback through
A child holding a Greenlight Planet Sunking Pro™, Kenya.    www.lightingafrica.org.                                       7.   Conclusion 												92
© Andres Bifani/Lighting Africa/2012
                                                                                                                          8.   Appendix 												                                             94
                                                           © Lighting Africa, printed in June 2013.
Lighting Africa Market Trends Report 2012 - Barefoot Power Pty Ltd
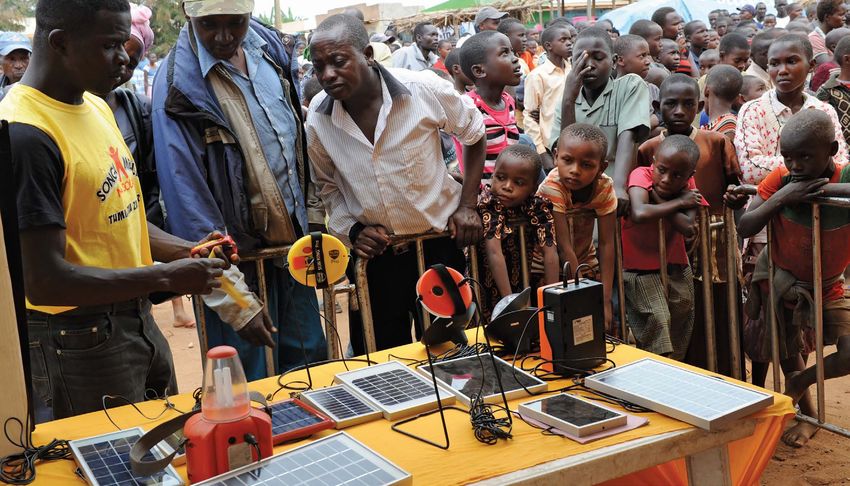
03        Lighting Africa Market                                                                                                                   Lighting Africa Market     04
April 2013   Trends Report                                                                                                                                    Trends Report    April 2013

                                                                             List of figures

                                                                             Figure 1: Select African off-grid lighting market indicators										17
                                      Reading with a solar lamp, Senegal.
                                                                             Figure 2: Un-electrified populations across the world											                                   18
                                      © Bruno Déméocq/Lighting Africa/2012   Figure 3: Evolution of PLS performance over time											21
                                                                             Figure 4: Evolution of performance per unit price of PLSs										                                23
                                                                             Figure 5: Comparison of average performance of PLSs within price bands over time							            24
                                                                             Figure 6: Ranked performance per unit price for PLSs											25
                                                                             Figure 7: Consumer-oriented design features in PLSs											26
                                                                             Figure 8: PLS sales in Africa over time													28
                                                                             Figure 9: Cumulative sales of Lighting Global quality-verified PLSs in Africa								              29
                                                                             Figure 10: Market penetration of PLSs													30
                                                                             Figure 11: Sales of Lighting Global quality-verified PLSs by price									                        32
                                                                             Figure 12: BoP lighting expenditure in Africa												                                          34
                                                                             Figure 13: Drivers of increased off-grid lighting expenditure in Africa									                   35
                                                                             Figure 14: Annual household expenditure on kerosene and mobile charging vs. expenditure on PLS				 35
                                                                             Figure 15: Entry of new players into the African solar lighting market									                    36
                                                                             Figure 16: PLS manufacturing and sales by geography										38
                                                                             Figure 17: Frequency of distribution model utilization across surveyed market players						        39
                                                                             Figure 18: Opportunities for cost reduction across the PLS value chain								                     40
                                                                             Figure 19: Retail price of a sample PLS in different African geographies								                   41
                                                                             Figure 20: PV price trends														                                                           43
                                                                             Figure 21: Estimated PLS market share by PV technology										                                   44
                                                                             Figure 22: Evolution of battery prices over time											                                        45
                                                                             Figure 23: Estimated PLS market share by battery technology										                              46
                                                                             Figure 24: Key advantages of LFP over traditional li-ion										                                 47
                                                                             Figure 25: Estimated PLS market share by lighting technology									                              48
                                                                             Figure 26: Evolution of LED Prices													                                                    48
                                                                             Figure 27: Decomposition and forecast of the median lantern component cost							                  50
                                                                             Figure 28: Breakdown of PLS manufacturing cost by major cost components								                    51
                                                                             Figure 29: Best research-cell efficiencies												                                             51
                                                                             Figure 30: Evolution of LED luminosity												52
                                                                             Figure 31: PLS performance and price in 2020											53
                                                                             Figure 32: Evolution of market barriers												                                                54
                                                                             Figure 33: Key differences between the PLS market and other consumer goods markets						           55
                                                                             Figure 34: Financing needs across the value chain											                                       56
                                                                             Figure 35: Time taken for distributors from manufacturer to sale									                          57
                                                                             Figure 36: Financing needs of distributors and wholesalers										58
                                                                             Figure 37: BoP financial landscape overview for Africa										                                   59
                                                                             Figure 38: Overview of potential solutions to resolve access to finance challenges							          60
                                                                             Figure 39: Lending models used by MFIs for PLSs											61
Lighting Africa Market Trends Report 2012 - Barefoot Power Pty Ltd
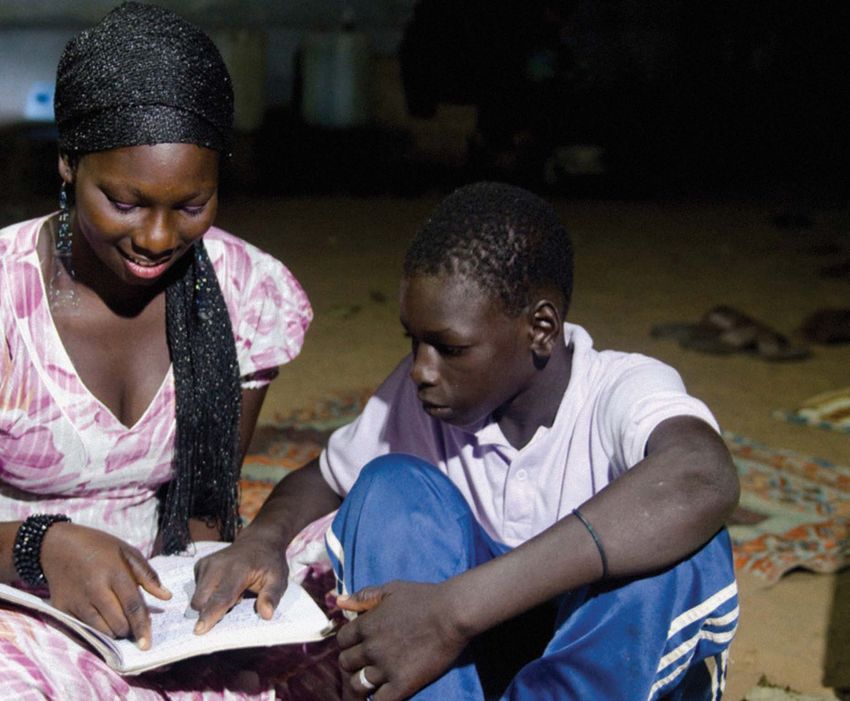
05           Lighting Africa Market                                                                                                                                                                                                       Lighting Africa Market     06
April 2013      Trends Report                                                                                                                                                                                                                        Trends Report    April 2013

                                                                                                                                                                                              Background
  Figure 40: Overview of a sample pay-as-you-go model of finance and distribution							                                64
  Figure 41: Illustration of payroll financing of PLSs for employees of corporation and/or large public institutions			 65                                                                   About Lighting Africa
  Figure 42: Illustration of a trade financing model											                                                         67                                                                     Lighting Africa, a joint IFC and World Bank program, seeks to accelerate the
  Figure 43: Carbon emissions by energy source for lighting										                                                   67                                                                    development of commercial off-grid lighting markets in Sub-Saharan Africa as part
  Figure 44: Overview of different distribution channels to reach BoP customers							                                  69                                                                    of the World Bank Group’s wider efforts to improve access to energy. Lighting Africa
  Figure 45: Prominent distribution strategies used by selected manufacturers								                                   72                                                                   is mobilizing the private sector to build sustainable markets that provide affordable,
  Figure 46: Evolution of sales by retail channel in Kenya										                                                    73                                                                  modern off-grid lighting to communities across Africa that are not on the electricity
  Figure 47: Overview of consumer awareness and marketing channels								                                              76                                                                 grid. The program and its partners have brought cleaner, safer, and better lighting to
  Figure 48: Evolution of warranties in the African market for Lighting Global quality-verified PLSs					               79                                                                 nearly 7 million people and are working to increase energy access, providing better
  Figure 49: Market share of quality-verified solar lighting products									                                          81                                                                lighting to 250 million people by 2030.
  Figure 50: Cumulative number of product which passed Lighting Global’s minimum quality standards				                  82
  Figure 51: Mapping of support for solar sectors in African geographies								                                        84                                                               Improved lighting provides significant socio-economic, health and environmental
  Figure 52: Evolution of MNC market share in Indian consumer durables market							                                    88                                                              benefits. Lighting Africa is a key element of the Global Lighting and Energy Access
  Figure 53: Sensitivity of end-users to upfront cost											89                                                                                                                      Partnership (Global LEAP), an initiative of the Clean Energy Ministerial.
  Figure 54: Evolution of annual sales of PLSs while considering replacements and incremental sales					                91
                                                                                                                                                                                       Lighting Africa is implemented in partnership with: The Africa Renewable Energy and
  Figure 55: Forecast of cumulative PLS sales in Africa over time									                                              91
                                                                                                                                                                                       Access Grants Program • The Climate and development Knowledge Network (CDKN) •
                                                                                                                                                                                      The Global Partnership on Output-Based Aid (GPOBA) • The Energy Sector Management
                                                                                                                                                                                      Assistance Program (ESMAP) • The Global Environment Facility (GEF) • Italy • Luxembourg
                                                                                                                                                                                     • The Netherlands • Norway • The Public-Private Infrastructure Advisory Facility (PPIAF) •
                                                                                                                                                                                     The Renewable Energy and Energy Efficiency Partnership (REEEP) • The United States.

                                                                                                                                                                                    For more information, visit www.lightingafrica.org

  List of abbreviations
                                                                                                                                Better lights for better lives. Kenya.             About Lighting Global
                                                                                                                                © Andres Bifani/Lighting Africa/2012               Lighting Global carries out activities of Lighting Africa and Lighting Asia that are global in
  a-Si       Amorphous Silicone
                                                                                                                                                                                  nature. As the region-specific activities have evolved, it has become clear that some of them
  BoP        Base of Pyramid (
Lighting Africa Market Trends Report 2012 - Barefoot Power Pty Ltd
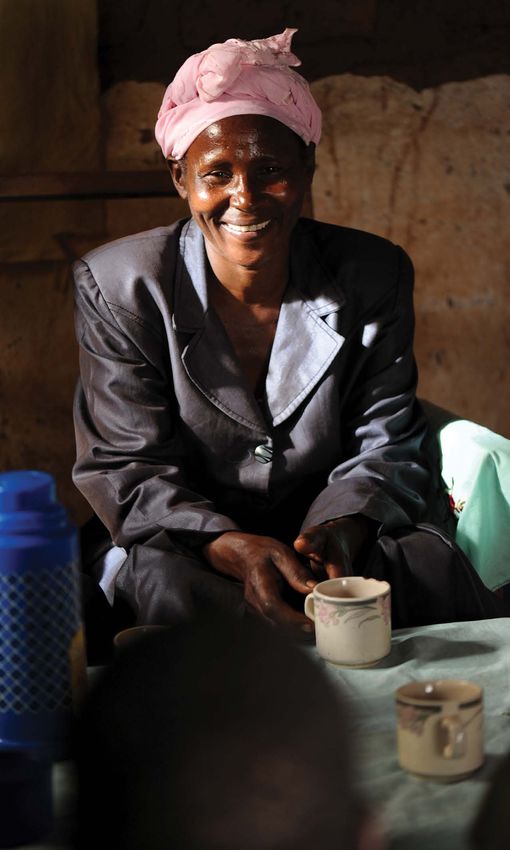
07                   Lighting Africa Market                                                                                                                                                                                                                                                                                                 Lighting Africa Market     08
      April 2013               Trends Report                                                                                                                                                                                                                                                                                                                  Trends Report    April 2013

                                                                                                                                                                                                               Executive summary
About IFC
IFC, a member of the World Bank Group, is the largest development institution focused on the private sector in developing countries. IFC
                                                                                                                                                                                                               In 2010, when Lighting Africa first released a comprehensive report on the African lighting industry, an exciting future was heralded for
creates opportunity for people to escape poverty and improve their lives—by providing financing to help businesses employ more people
                                                                                                                                                                                                               a product set to revolutionize clean, affordable lighting for low income households. Annual growth rates of more than 85% were predicted
and provide essential services, mobilizing capital from others, and delivering advisory and risk-management services to ensure sustainable
                                                                                                                                                                                                               under bullish circumstances, accompanied by rapid price drops and performance improvements, leading to a fast relegation of the traditional
development. In a time of global economic uncertainty, IFC’s new investments climbed to a record $20 billion in fiscal year 2012.
                                                                                                                                                                                                               kerosene lantern to minority status by 2030.
For more information, visit www.ifc.org
                                                                                                                                                                                                               Two years on, the market for quality lighting products has matured even more rapidly than predicted.

                                                                                                                                                                                                               •        Since 2009, the market in Africa has experienced dramatic growth—starting from approximately 300,000 lighting products in Africa
Scope                                                                                                                                                                                                                   in 2009 annual sales grew at 90-95% per year and reached approximately 4.4 million units by the end of 2012.

The off-grid lighting space is fast-growing and encompasses a wide spectrum of products and business models. However, for the purpose of
                                                                                                                                                                                                               •        Sales of Lighting Global quality-verified PLSs have grown by 300%. The high volume of sales of quality-verified PLSs suggests an
this report, we have chosen to focus on an important sub-section of the market that we term ‘pico-powered lighting systems’ (PLS).1
                                                                                                                                                                                                                        evolving consumer base that is becoming more experienced and aware. Self-reported sales data from quality-verified manufacturers
This constitutes a change in terminology from the 2010 report ‘Solar Lighting for the Base of the Pyramid: Overview of an Emerging Market’,                                                                             indicate that there were close to 1.4 million quality-verified PLSs in the African market by Q4 2012. According to our best estimates,
in which we referred to the market for solar portable lanterns or SPLs. The use of PLS terminology acknowledges the emergence and presence                                                                              this represents more than a quarter of the total number of lighting products4 in the market today.
of other non-solar energy sources (including hand cranks, pedal power etc.) in the off-grid lighting market in Africa.

We choose to define the PLS market on the basis of function, technology and quality—following from this definition, the scope of the report                                                                    Sales of Lighting Global quality-verified PLSs in Africa
fits within the factors described on the following page.                                                                                                                                                       Thousand PLSs; 2009-12
                                                                                                                                                                                                                                                                                                                                              1,387
•        Function                                                                                                                                                                                                                                                                       1,400

                                                                                                                                                                                                                                                                                        1,300
         Lighting systems range from being task-specific (e.g., torches/flashlights) to the more general ambient lighting functions. Some of these
                                                                                                                                                                                                                                                                                        1,200
         products may include added functions such as mobile phone charging, but light is typically the primary design driver.
                                                                                                                                                                                                                                                                                        1,100

•        Technology                                                                                                                                                                                                                                                                     1,100
                                                                                                                                                                                                                                                                                                                                              884
                                                                                                                                                                                                                                                                                          900
         The battery is rechargeable and, for a vast majority of devices, powered by a solar cell that is integrated or in a stand-alone panel.
                                                                                                                                                                                                                                                                                          800                             CAGR:~300%
         The light source is typically Light Emitting Diode (LED)-based, although a few products still use Compact Fluorescent Light (CFL)
                                                                                                                                                                                                                                                                                          700
         technology. The solar panel size is restricted to 10 watts and below, which differentiates these devices from the majority of Solar Home
                                                                                                                                                                                                                                                                                          600
         Systems. Dynamo (e.g., hand crank or pedal power) technology is also an interesting emerging option for powering PLSs.
                                                                                                                                                                                                                                                                                          500

•        Quality                                                                                                                                                                                                                                                                          400                                          336

                                                                                                                                                                                                                                                                                          300
         Products must meet a certain quality standard (e.g., sufficiently long life and truth in advertising). Currently, the most prominent
                                                                                                                                                                                                                                                                                          200                            146
         standards are defined by Lighting Global’s product quality assurance program and were originally designed to meet the needs of                                                                                                               Cumulative
                                                                                                                                                                                                                                                                                          100
         Africa’s un-electrified households.2 As of December 20123, 46 products had passed Lighting Global minimum quality standards, but as                                                                                                          Annual
                                                                                                                                                                                                                                                                                                        18
                                                                                                                                                                                                                                                                                            0
         products are submitted for testing on a voluntary basis, this does not mean that non-LA verified products are automatically low quality.
                                                                                                                                                                                                                                                                                                       2009               2010         2011   2012
         As the introduction of poor quality products in the market leads to market spoilage, our analysis distinguishes between the quality end
         of the market in terms of performance and durability, versus inexpensive (USD 1-5), typically dry cell battery-powered, non-solar LED
                                                                                                                                                                                                               Source: Lighting Africa sales data (Q4 2012 update); Dalberg analysis
         torches/flashlights that have experienced substantial sales over the past few years in Africa.

1Pico-powered lighting systems (PLS) do not include conventional Solar Home Systems (SHS) that are generally larger, with panel sizes typically exceeding 10 watts and device prices ranging from USD 50-100   4 Refers only to the types of pico-powered lighting systems that are specified in the report’s scope (Page 7).
 (as opposed to a median PLS price of USD 30). They also do not include pure battery powered lights that lack an integrated renewable power source.
2 See Lighting Global Quality Test Procedures for details on relevant quality standards. http://www.lightingafrica.org/files/LED_Lighting_TestProcedures_Draft_FISE_Aug09.pdf
3All information in this report is updated till December 2012. From this point forward in the report, ‘today’ refers to ‘end 2012’.
Lighting Africa Market Trends Report 2012 - Barefoot Power Pty Ltd
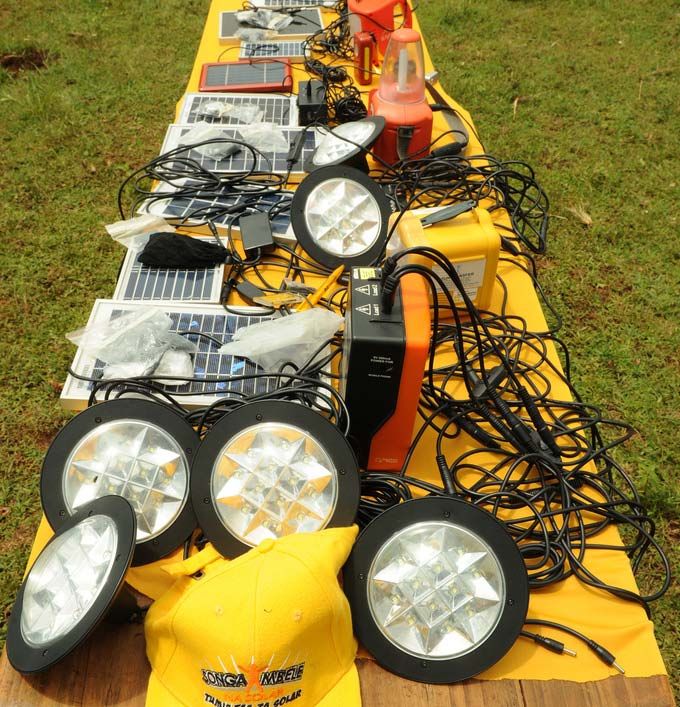
09                     Lighting Africa Market                                                                                                                                Lighting Africa Market       10
     April 2013                          Trends Report                                                                                                                                                 Trends Report     April 2013

•       Penetration of lighting products has increased, but conservative estimates indicate that it still remains around 4% in Africa. Thus, there
        is significant scope for rapid growth in the future.

•       Key demand side drivers identified two years ago remain relevant, and in some cases have become more important. These include
        (1) a population growth outpacing grid connection, implying an increasing off-grid population; (2) a fast-increasing mobile phone
        subscriber population that requires better and cheaper mobile phone charging options; (3) large and growing expenditure on non-
        renewable fuels for lighting (due in part to rising fuel costs), estimated to be approximately USD 13-17 billion in Africa in 2012.

BoP expenditure on lighting in Africa
Billion USD; 2012

                                                                                                                                                          Range of estimates

                                    18                                                                                                                        17.3

                                    16                                                                                 1.3

                                                                              1.3
                                    14

                                    12
        Expenditure (Billion USD)

                                    10

                                     8

                                                                                                                                                              13.2
                                     6
                                                     10.6

                                     4

                                     2

                                     0

                                             Off-grid households      On-grid households                               SMEs                                2012 (total)

1. Includes estimated expenditure on kerosene, batteries, candles and bio-fuel; the higher range of the estimate assumed higher kerosene usage among primary and secondary users, and
   higher secondary usage of battery-powered devices and candles.
2. Our estimate took into account population segments that paid a kerosene premium for buying the fuel in small quantities.
3. The average price of kerosene across Africa was estimated to be approximately USD 1.13 per liter.

Source: Primary data from the World Bank and the Asian Development Bank; Dalberg analysis.
                                                                                                                                                                                        The number of Lighting Global quality-verified PLSs
                                                                                                                                                                                        has increased.
                                                                                                                                                                                        © Andres Bifani/Lighting Africa/2012
Lighting Africa Market Trends Report 2012 - Barefoot Power Pty Ltd
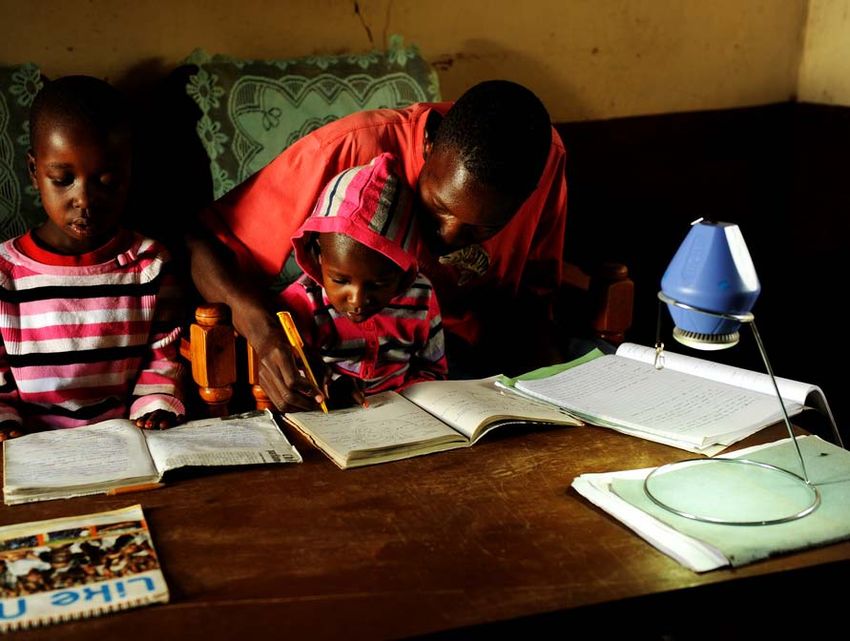
11                Lighting Africa Market                                                                                                                                                                                                                                            Lighting Africa Market     12
     April 2013            Trends Report                                                                                                                                                                                                                                                             Trends Report    April 2013

                                                                                                                                                 Comparison of average performance of PLSs within price bands over time
•       The PLS market has witnessed the entry of new players. The overall number of manufacturers selling PLSs in Africa has grown sharply      Percentage increase in performance between 2010 and 2012
        from 20 in 2008 to approximately 80 today, and, in tandem, the number of manufacturers of quality-verified PLSs has also increased—
                                                                                                                                                                                                                                                                         216%
        from six in 2010 to 25 currently.                                                                                                                                                                                                                    205%
                                                                                                                                                                                                                                             187%
•       The size and diversity of players have also changed. Not only have several multinationals signaled their serious and long-term

                                                                                                                                                                                                         Increase in performance from
        commitment, but also, existing players have transformed from small, social start ups to fully professional and maturing businesses.
•       Approximately two-thirds of the major manufacturers supplying lighting products to Africa have their factories and production units

                                                                                                                                                                                                                  2010 levels
        based in China and these have accounted for almost 90% of estimated cumulative sales up to 2012.
•       In the absence of any clear, winning distribution strategy, PLS suppliers have continued to experiment with different channels by
        focusing on customizing distribution to specific needs of customer segments within target geographies.
                                                                                                                                                                                                                                                                                    21%

                                                                                                                                                                                                                                                                                                 PLSs price bands
                                                                                                                                                                                                                                        USD 20-and below   USD 20-30   USD 30-50   USD 50+
Frequency of distribution model utilization across surveyed market players
                                                                                                                                                 1. We refer to an increase in the performance per unit price from the baseline of 2010.
Number of respondents; N = 20 manufacturers
                                                                                                                                                 Source: Dalberg analysis
                                                            15
                                                                                                                                                 •       The ten top-performing PLSs in the African market include two types of players: (1) established brands that have been operating in the
                                                                                                                                                         African market for at least two to three years and bring a reputation for quality and a history of high sales, and (2) brand new entrants
                                                                                                                                                         that have been able to bring the latest technologies into the market.

                                                                         9

                                                                                      8

                                                                                                  5
                                                                                                               5

                                                                                                                           3

                                                        Distributor Proprietary   MFI/NGO Institutional      Micro-     Rental
                                                                                           Partnership     franchise

1. Manufacturers reported employing more than one distribution model at the same time, therefore, the total across models does not add to N.
Source: Interviews with manufacturers and distributors; Dalberg analysis

PLSs offer much greater value to BoP customers than they did two years ago
•       The average battery life of a PLS has increased by 20% to approximately six hours in 2012. Similarly, average brightness has increased
        by 30% to approximately 100 lumens in 2012.
•       Average performance of a lantern – measured as a product of light output in lumens and the battery’s solar run time – has increased
                                                                                                                                                     Many PLSs include a mobile charging feature.
        by approximately 140% from 2010; the greatest increases in product performance are seen in mid-priced PLSs.                                  © Bruno Déméocq/Lighting Africa/2012.
Lighting Africa Market Trends Report 2012 - Barefoot Power Pty Ltd
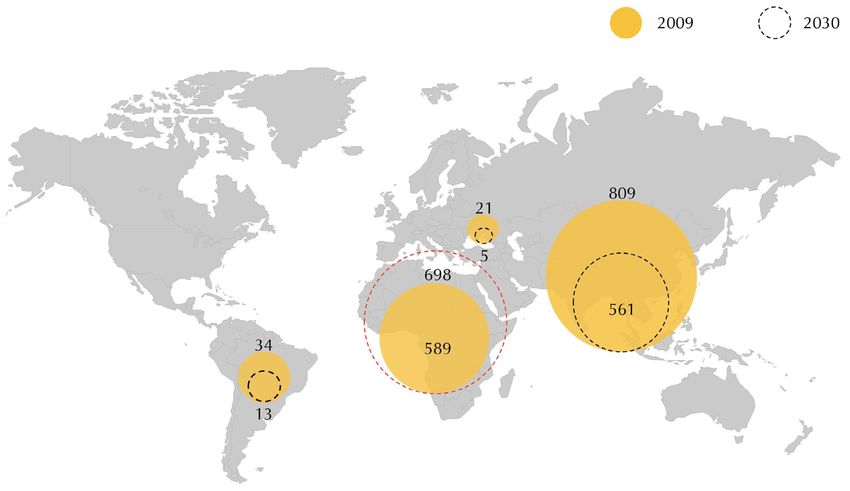
13                 Lighting Africa Market                                                                                                                                                                                                                                          Lighting Africa Market           14
     April 2013                Trends Report                                                                                                                                                                                                                                                           Trends Report          April 2013

                                                                                                                                                         Barriers identified by market players have remained generally stable over time. Access to finance, distribution and lack of consumer awareness
                                                                                                                                                         have consistently been the highest-rated challenges.
•          In addition, the product range has also grown to emphasize consumer-oriented features and design. PLS suppliers are incorporating
           several value-added features as part of their standard offering to consumers. Mobile phone charging, for example, has become
           ubiquitous among PLSs. Other well-received and demanded features include charging-effectiveness indicators, a grid-charging option,           Evolution of market barriers as identified by PLS manufacturers and distributors
           and a torch mode.                                                                                                                             Percentage of respondents; 2010-12*

                                                                                                                                                                            May 2010: Frequency of citing growth barriers                           June 2011 and September 2012: Criticality of market barriers
Decomposition and forecast of the median solar-based PLS component cost
                                                                                                                                                                            N = 531                                                                 Scale of 1 – 5; N = 37                 Scale 1 – 5; N2 = 34
USD; 2010-2020

           Total manufactured cost                                          % of total (2012)                  Component cost trends                                        Lack of A2F                                       27                                                   4.7                                  4.0

                                                                                                $6.12
                                                                                                                                                                            Distribution challenges                      17                                             3.7                                      3.0
                                                                                                        $6.12
    20                                                  PV                        29%                                      $6.12                  -64%
                                                                                                                                        $6.12                               Lack of
                                                                                                                                                                            consumer awareness                      14                                                         4.5                               2.9

                         ~64%                                                                                                                                               Poor product quality /
                                                                                                                                                                            market spoilage                     7                                                            4.0                           2.5
                 15
                                                                                                3.71
                                                                                                                                                                            Policy issues                   5                                                         3.3                                  2.4
                                                        LED                       11%                   3.71
                                                                                                                           3.71        3.71       -85%
                                                                                                                                                                            Lack of after-sales
                          11
                                                                                                                                                                            services                    3                                                             3.2                            1.4
                                     10

                                                                                                                                                                                Top three
                                                                                                $4.45   $4.45
                                                                                                                           $4.45       $4.45
                                                                                                                                                  -45%
                                                        Battery                   27%
                                                                                                                                                         Several interviewees cited more than one barrier, which is why numbers below do not add up to 53.
                                                                                                                                                         Interviewees represent 65-70% of the quality market

                                                                                                                                                         Source: Interviews with manufacturers and distributors; Dalberg analysis
                                                                                                $2.66   $2.66              $2.66
                                                                                                                                        $2.66
    2010       2012     2015(e)     2020 (e)                                                                                                      -34%
                                                        Charge Controller         16%

                                                                                                                                                         *the scales for 2010 and 2011/2012 are different, because the methodology used for collecting answers was different in 2010.

                                                                                                                                        $2.53
                                                                                                $2.53   $2.53              $2.53                  +48%   •       The overriding upstream finance challenge was working capital for distributors attempting to reach remote, off-grid markets. End-user
                                                        Housing, labor            18%                                                                            affordability was identified as the major downstream finance bottleneck.
                                                        and assembly
                                                                                                                                                         •       As the market matures and rural awareness and demand for PLSs increase, we expect distribution patterns and channels to mimic those
                                                                                                2010    2012              2015 (e)     2020 (e)
                                                                                                                                                                 of other consumer durables in the market such as TVs, fans and pressure cookers. For these products, the majority of rural sales occur
1. Performance holding constant.                                                                                                                                 at large towns and urban areas retail outlets.
Source: GTM research; Thin Film Industry Forum; IRENA; US Department of Energy; McKinsey Industry reports; Pike Research; Lux Analysis;                  •       Consumer awareness among the African BoP for PLSs has improved, but remains low, particularly within remote rural areas. Targeted
The Economist; Inter China Consulting Analysis; Interviews with manufacturers and technical experts; Dalberg analysis
                                                                                                                                                                 and effective consumer awareness campaigns, despite their positive impact on consumer willingness to pay, remain difficult to design
                                                                                                                                                                 and expensive to execute. However, as the market matures even further, marketing and advertising will become increasingly important
•          Driven by rapidly declining costs of major components (e.g. PV, LED and battery), the theoretical manufacturing cost (holding                         components of product and brand differentiation.
           performance constant) has reduced by almost 25% from 2010, and is expected to reduce by another ~33% by 2020. Our estimates
           suggest that the median lantern in 2020 will exhibit twice the battery life and up to five times the brightness of the median PLS in 2012.
Lighting Africa Market Trends Report 2012 - Barefoot Power Pty Ltd
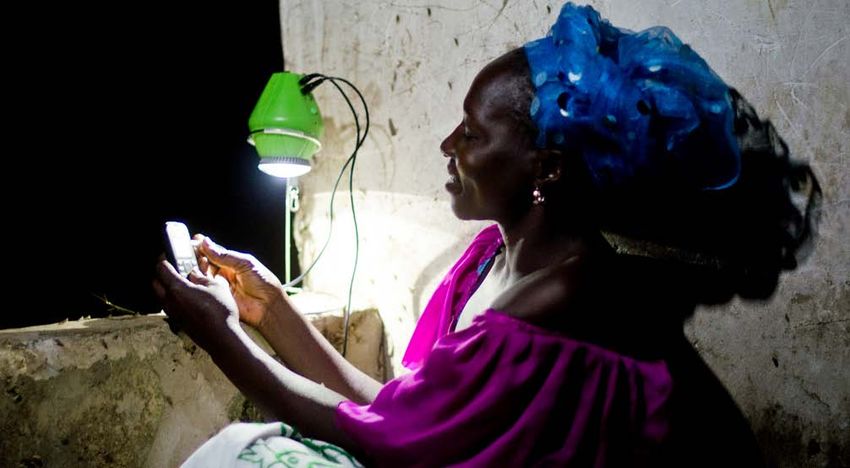
15                Lighting Africa Market                                                                                                                                                                                                                         Lighting Africa Market             16
     April 2013            Trends Report                                                                                                                                                                                                                                          Trends Report            April 2013

The market for PLSs in Africa remains on a healthy trajectory. Currently, even our most conservative forecasts predict high growth rates               In the presence of these four catalytic opportunities, the market could reach 5 million in total additional sales by 2015. This would
over the next two-three years. These forecasts are based on the core macro-drivers including lagging grid growth, expected increase in                 imply a market growth of approximately 85% between 2012 and 2015, with cumulative sales growing to approximately 28 million PLSs.
fuel-based lighting expenditures, growing need for mobile phone charging options, as well as an improving supply of quality products.
In addition, there are several emerging trends that can further accelerate this fast-growing market:                                                   Forecast of cumulative PLS sales in Africa over time
                                                                                                                                                       Million PLSs; 2012-15
•       The market is maturing and has proven itself economically viable, leading to greater interest from global electronic giants such as
        Schneider Electric, Philips and Energizer. Given their natural scale advantages and established distribution capabilities, a concerted
        effort by any one of these corporations could drive this market faster and higher.
•       We observe the emerging use of technology in ‘pay-as-you-go’ models to overcome the critical consumer-financing hurdle. PLS                                                               30
                                                                                                                                                                                                                 2012-15 CAGR
        companies have begun to incorporate GSM chips and mobile payments as a way of regulating the delivery of light on the basis of                                                                                                            Aggressive ~85%                                  28m
        micro-payments. This could address a much larger customer-base that is currently severely affordability-constrained.
•       We expect the emergence and increased presence of manufacturer-led brands, as opposed to the current market structure of pure
                                                                                                                                                                                                  25
        manufacturers who focus solely on executing orders to specifications from distributors and branded players. Our conversations with
                                                                                                                                                                                                                                                  Lighting Africa View ~75%                        23m
        these companies (a significant proportion of which are headquartered in China) indicate a strong inclination to establish a strategic,
        long-term presence in the African market over the next two to three years with their own branded product.
                                                                                                                                                                                                                                                  Base case ~65%                                   20m
•       Finally, as PLSs become more ubiquitous, manufacturers will see increasing demand from existing customers who have experienced
                                                                                                                                                                                                  20
        the benefits and are looking to replace, upgrade and extend their PLSs. This aspect of the market could help drive 30% of annual

                                                                                                                                                                Cumulative PLS sales (Millions)
        volumes beyond 2015.

Evolution of annual sales of PLSs while considering replacements and incremental sales                                                                                                            15

Thousand PLSs; 2012-15
                                                                                                                                    11,001
                                                          Incremental sales   Replacements       New customers
                                                                                                                                               723                                                10

                                                                                                                                               2,659

                                                                                                                                                                                                  5
                                                                                                                  6,197

                                                                                                                            283
                                                                                                                            978
                                                                                     3,523
                                                                                                0                                                                                                 0
                                                                                                424
                                                              2,036
                                                                                                3,099                       4,936              7,620                                                   2012(e)             2013(e)                       2014(e)                                    2015

                                                                                                                                                       Aggressive scenario assumes
                                                              2012                   2013 (e)                    2014 (e)           2015 (e)           (1) Entry of 2 MNCs;
                                                                                                                                                       (2) Entry of 2 additional manufacturer-led brands;
1. 75% of PLSs replaced every three years;.                                                                                                            (3) High growth of pay-as-you-go models;
2. 50% of households will purchase an additional PLS every four years.                                                                                 (4) and higher rates of replacement and incremental sales.

Source: Lighting Africa sales data; Dalberg analysis                                                                                                   Source: Lighting Africa  sales data; World bank data set on population; Dalberg analysis
Lighting Africa Market Trends Report 2012 - Barefoot Power Pty Ltd
17               Lighting Africa Market                                                                                                                                                                                                                                                                          Lighting Africa Market     18
  April 2013          Trends Report                                                                                                                                                                                                                                                                                           Trends Report    April 2013

1. Introduction
                                                                                                                                                    or approximately 140-150 million households (Figure 2). Africa will then have surpassed Asia to become the largest un-electrified market
                                                                                                                                                    worldwide. This means that, while the lighting need will be material all across the developing world, it will be greatest in Africa in the coming
In 2010, when Lighting Africa first released a comprehensive report on the lighting industry, an exciting future was heralded for a product
                                                                                                                                                    years.
set to revolutionize clean, affordable lighting for low income households. Annual growth rates of more than 85% were predicted under
bullish circumstances, accompanied by rapid price drops and performance improvements, leading to a fast relegation of the traditional
kerosene lantern to minority status by 2030.                                                                                                        Figure 2: Un-electrified populations across the world
                                                                                                                                                    Millions
Two years on, we can report a rapidly maturing market that has transformed and evolved quickly, easily outpacing all expectations.
Faster-than-predicted growth in sales – particularly for Lighting Global quality-verified products – has been accompanied by a sharp decline
in price relative to performance. In addition, the value to the end customer, with respect to PLS performance, has improved consistently
and substantially since 2010. Other transformational developments in the market have included the entry of a significant number of new
manufacturers and suppliers (including several large multinational companies) that drove increased competition and market coverage. The
figure below highlights the nature of the market’s evolution since 2007 by tracking a few key dimensions.

Figure 1: Select African off-grid lighting market indicators

                           Indicators                     2007…                      2010…                        2012

               Total PLSs sold in Africa
                                                          170k                    1.2 million               3.5 – 4 million
               (cumulative)

               Quality PLS sold (cumulative)              < 2k                       176k                    ~1.4 million

               African countries where quality
                                                            3                        5-10                         20
               PLSs are sold                                                                                                                        Source: Electricity Access Database (International Energy Agency); Dalberg analysis

               # of PLS manufacturers globally             10                         60+                        80+                                At the same time, new evidence on the negative health impact of using kerosene-based lighting products reiterates and further bolsters the
                                                                                                                                                    case for switching to cleaner alternatives like solar-based lighting products. A recent study by the Lawrence Berkeley National Laboratory
               # of quality-verified
                                                            0                          6                          25                                of California’s Lumina Project surveyed users of kerosene lighting across five Sub-Saharan Africa countries and found up to a fourth of the
               manufacturers
                                                                                                                                                    sampled population have health and safety concerns related to kerosene lighting.5 Insights from the study included:
               PLS price points                       USD 25–120                 USD 12–100                  USD 7–100
                                                                                                                                                    •        Kerosene combustion products are correlated with higher incidences of diseases like tuberculosis and cataract conditions. For example,
                                                                                                                                                             researchers found the odds of having tuberculosis in Nepal were more than nine times greater for women using kerosene than those
Source: Lighting Africa data; Dalberg analysis
                                                                                                                                                             using electric light.
                                                                                                                                                    •        Unintentional kerosene ingestion is the primary cause of child poisoning reported in most hospital studies. The consequences are
However, despite this impressive performance, the lighting imperative in Africa remains almost as immediate and urgent as it was two                         severe, including mortality rates ranging from 0% to 25% for those visiting hospitals. In South Africa alone, almost 80,000 children in
years ago. In some cases, the need has become even more pronounced. The primary need for off-grid lighting products, driven by poor grid                     3.6% of all households unintentionally ingest kerosene every year. Almost 60% of these children then develop chemically-induced
connectivity across Africa, remains critical and is not expected to improve drastically in the future. Africa’s grid expansion fails to keep pace            pneumonia.
with population growth. In fact, by 2030, Africa’s un-electrified population is projected to grow to almost 700 million people,
                                                                                                                                                    5 ‘Health impacts of fuel-based lighting,’ Evan Mills, Lawrence Berkeley National Laboratory, University of California (2012). http://light.lbl.gov/pubs/tr/lumina-tr10-summary.html
19             Lighting Africa Market                                                                                                                                                                       Lighting Africa Market             20
           April 2013        Trends Report                                                                                                                                                                                        Trends Report            April 2013

                                                      •        Fuel-based lighting is a significant cause of structural fires and severe burn injuries, with particularly high death rates (24% on average)
                                                               in cases where kerosene is adulterated with other fuels, resulting in explosions.

                                                      Kerosene lighting also generates black carbon particulates that contribute to global climate change. Prior estimates of the climate impact of
                                                      kerosene lighting that have focused exclusively on carbon dioxide emissions have understated the climate impact by a substantial margin.
                                                      When black carbon emissions are considered, the climate impact is five to 15 times larger (Lam, et al., 2012; Jacobson, et al., 2013)6.

                                                      Moreover, despite the rapid transformation experienced by the market, the penetration of these modern solar lighting devices is still low
                                                      across Africa. There remains significant scope and potential for continued, robust market growth and transformation. Important market
                                                      barriers such as access to finance for distributors and retailers, end-user affordability, low levels of consumer awareness, etc. continue
                                                      to impede faster market growth and scale. In addition, market structures – such as the Global Off-Grid Lighting Association (GOGLA),
                                                      among others – are still at a nascent stage and will rely on close collaboration with supporting donors, development organizations, non-
                                                      governmental organizations (NGOs), etc. for at least the next three to five years.

                                                      The following sections highlight the important market trends and developments, especially the evolution since 2010. Sections 2, 3 and 4
                                                      focus on detailing product and performance transformations, defining the state of the current market, and tracing the path of PLS production
                                                      economics. Section 5 discusses the key market barriers, the interventions used (successfully and unsuccessfully) thus far to tackle those
                                                      barriers, and the major lessons learned.

                                                      Finally, in section 6, the report shares its perspectives on the most important trends that are likely to influence market transformation going
                                                      forward, and potentially help unleash an even faster period of growth in the coming years.

Penetration of modern solar lighting devices
is still low in Africa. Here a Solux LED-105 lamp.
© Bruno Déméocq/Lighting Africa/2012

                                                      6 Jacobson, A.; Lam N.L.; Bond, T.C.; Hultman, N. (2013) ‘Black Carbon and Kerosene Lighting: An Opportunity for Rapid Action on Climate Change and Clean Energy for Development’,

                                                      The Brookings Institute, Global Views #41. http://www.brookings.edu/research/papers/2013/04/climate-change-clean-energy-development-hultman
                                                      Lam, N. L.; Chen, Y.; Weyant, C.; Venkataraman, C.; Sadavarte, P.; Johnson, M. A.; Smith, K. R.; Brem, B. T.; Arineitwe, J.; Ellis, J. E.; Bond, T. C., (2012) ‘Household Light Makes Global Heat:
                                                      High Black Carbon Emissions From Kerosene Wick Lamps’, Environmental Science & Technology , 46, (24), 13531- 13538.
21                   Lighting Africa Market                                                                                                                                                                                                                                                                                                       Lighting Africa Market              22
        April 2013                Trends Report                                                                                                                                                                                                                                                                                                                        Trends Report             April 2013

2. Product and performance

The PLS product set7 has substantially diversified since 2010 with current models exhibiting a significantly broader range of performance.
Figure 3 below outlines the evolution of the product set between 2010 and 2012 based on battery life, lumens and PLS price. Different
product categories include task/back up, performance, entry level in the market, and specialization. The segmentation criteria employed are
maintained from the 2010 report in order to facilitate an easy comparison of product performance over the last two years.

Figure 3: Evolution of PLS performance over time
Light output in lumens; typical battery life in hours; PLS price in USD

       Battery Life (Hours)
           14
                    Task/Backup                                                                                           High Performance Market
           13
                                                                                                                                                           Bubble size     = USD 170
           12

           11

           10
                                                                                                                                                               2010             2012
           9

           8

           7

           6

           5
                                                                                                                                                                                       Consumers have a wider choice of quality lighting
           4                                                                                                                                                                           products. Here the Trony TSL01 lamp.
                                                                                                                                                                                       © Andres Bifani/Lighting Africa/2012
           3

           2

           1
                    Entry Level                                                                                           Specialized
           0                                                                                                                                              Brightness (Lumens)
                                                                                                                                                                                       The quantity and diversity of PLS products present in the overall market have increased significantly since 2010. The PLS product set in 2012
                0                               50                             100		                         150		            200                   250
                                                                                                                                                                                       is, in general, differentiated with respect to price and performance, in order to cater to specialized needs of different customer segments.

1. Survey of 12 products in 2010 and 38 products in 2012 that were sold in the African PLS market, and for which price information was available.                                      Across all PLSs, performance levels have dramatically improved in the past two years. The average battery life of a PLS8 has increased
Source:  Lighting Africa data;  Internet research; Dalberg analysis                                                                                                                    by 20% to approximately six hours in 2012. Similarly, average brightness has increased by 30% to approximately 100 lumens in 2012.
                                                                                                                                                                                       Accordingly, a greater share of products now falls in the high performance segment9 —rising from less than 10% of the sample set in 2010
                                                                                                                                                                                       to about 35% in 2012.

7
    We only refer to Lighting Global quality-verified products for which pricing information is available.
                                                                                                                                                                                       8
                                                                                                                                                                                         Battery life, or the battery’s solar run time, is the number of hours a product can be used after a full day of solar charging. Note that hours of use are defined by the time it takes for the light
                                                                                                                                                                                          output to drop to 70% of its initial value.
                                                                                                                                                                                       9
                                                                                                                                                                                         As defined in ‘Solar Lighting for the Base of the Pyramid: Overview of an Emerging Market’, Lighting Africa (2010).
23                                                                   Lighting Africa Market                                                                                                                                                                                                                                                     Lighting Africa Market        24
        April 2013                                                                Trends Report                                                                                                                                                                                                                                                                      Trends Report       April 2013

                                                                                                                     Measuring PLS performance

                          PLS PERFORMANCE = LIGHT OUTPUT (LUMENS) X BATTERY LIFE (HOURS),                                                                                                        •       Second, the greatest increases in product performance are seen in mid-priced PLSs. Across the PLS product range, average performance
                      where battery life refers to the number of hours a lighting device can be used after one full day of charging.                                                                     levels have increased by approximately 140% from 2010, as shown below. All products below USD 50 largely drive this increase,
                                                                                                                                                                                                         more specifically, mid-priced PLSs in the USD 20-30 and USD 30-50 range, whose performance levels have more than quadrupled in
Source: Lighting Africa; Dalberg analysis.                                                                                                                                                               the past two years.

                                                                                                                                                                                                 Figure 5: Comparison of average performance of PLSs within price bands over time
A closer analysis of PLS performance reveals three notable trends:                                                                                                                               Percentage increase in performance since 2010
                                                                                                                                                                                                                                                                                                                                                                              216%

                                                                                                                                                                                                                                                                                           Increase inperformance from 2010 levels
•          First, clear outliers are emerging in terms of performance among products in a given price range (Figure 4 below).10 Although the                                                                                                                                                                                                               205%
                                                                                                                                                                                                                                                                                                                                          187%
           number of PLS products and brands in Africa have increased substantially in the past two years, the vast majority of these remain
           inaccessible to the average customer. Poor distribution, particularly at the last mile, means that the target customer faces limited choices
           at any particular point-of-sale. This is evidence that the market for African PLSs is not yet functioning in a fully competitive manner.
           Consumers do not yet have the awareness, capacity or opportunity to effectively distinguish among similarly priced products that
           perform at different levels. However, with greater maturity and competitiveness in the market, we expect these outliers to ultimately
           dominate sales of PLSs.
                                                                                                                                                                                                                                                                                                                                                                                         21%
           Analysis of preliminary sales data from Lighting Africa shows that, on average, higher-performance PLSs outsell lower-performance
                                                                                                                                                                                                 1. We refer to an increase in the performance per unit price from the baseline of 2010.
           PLSs. Again, however, the existence of a few significant outliers tends to indicate that customers’ options remain constrained and are
                                                                                                                                                                                                 Source: Dalberg analysis                                                                                                            USD 20 and below   USD 20-30        USD 30-50      USD 50+
           largely dependent on the ability of marketing and distribution channels to push PLSs of different prices and performance levels.
                                                                                                                                                                                                                                                                                                                                                         PLSs by price band

Figure 4: Evolution of performance per unit price of PLSs                                                                                                                                        While the value of PLSs to consumers has increased across all products since 2010, when products are compared by the metric of performance
PLS price in USD                                                                                                                                                                                 per unit price (lumen-hour/USD), products in the USD 20-50 range currently offer customers the greatest value for money.
                                                                                       4,000

                                                                                       3,500
                              Performance in lumen-hours (per day of solar charging)

            Outlier

                                                                                       3,000
            2010

                                                                                       2,500
            2012

                                                                                       2,000

                                                                                       1,500

                                                                                       1,000

                                                                                        500                                                                                                                                                                                                                                                      A display of some of the Lighting Global’s quality-verified
                                                                                                                                                                                                                                                                                                                                                 lamps, at a road show in Kenya.
                                                                                                                                                                                   Price (USD)
                                                                                                                                                                                                                                                                                                                                                 © Andres Bifani/Lighting Africa/2012
                                                                                          0
                                                                                               0           10   20     30    40    50    60      70   80   90   100   110   120   130     140

10
     The Dalberg PLS performance metric is a product of light output in lumens and battery’s solar run time.
25                  Lighting Africa Market                                                                                                                                                                                                                                                             Lighting Africa Market      26
     April 2013              Trends Report                                                                                                                                                                                                                                                                              Trends Report     April 2013

•       Third, a group of clear ‘winners’, or market leaders, is materializing. Examination of the nature and mix of the PLS performance curve                                                    innovative design elements meant to satisfy consumers’ specific needs and increase their overall economic benefit. The most popular
        reveals that the group of the ten top-performing PLSs in the African market primarily comprises two types of players: (1) established                                                     additional features include varying brightness levels, various mounting options, multiple charging abilities, pay-as-you-go options and
        brands that have operated in the African market for at least two to three years and bring a reputation for quality and a history of high                                                  mobile phone charging. As illustrated in Figure 7, a survey of quality-tested products reveals that this trend has continued to intensify and
        sales (2) new entrants to the market who have the desire to mimic growth experienced by established market leaders, combined with                                                         expand in the past two years. Now, PLS suppliers are incorporating several of the value-added features mentioned above as part of their
        the ability and capacity to leapfrog advances in manufacturing and (3) new entrants to the market with innovative technologies that by                                                    standard offering to consumers as well as incorporating new features. Mobile phone charging, for example, has become ubiquitous among
        far exceed those already in the market place.                                                                                                                                             PLSs—so much so that suppliers have received feedback that PLSs without mobile charging are viewed as sub-standard or poor quality
                                                                                                                                                                                                  products. The charging effectiveness indicator (which enables consumers to maximize PV charging) is a fairly recent but popular addition to
Figure 6: Ranked performance per unit price for PLSs                                                                                                                                              the PLS feature set and is already incorporated in more than a fifth of all quality-tested products.
Performance in lumen-hour/USD

                  Lumen - Hr/Price                                                                                                               Top 10                                           Figure 7: Consumer-oriented design features in PLSs
                  80
                  75                                                                                                                                    Leader
                                                                                                                                                                                                                                                                                                                   % of quality PLSs with feature
                  70                                                                                                                                  Leader                                       Feature                                   Rationale for feature
                                                                                                                                                                                                                                                                                                                         (2012 estimates)
                  65

                  60
                                                                                                                                                                                                   Mobile charging                           Saves time and money by charging mobile phones                                         55%
                  55

                  50
                  45                                                                                                                                                                                                                         Charges PLS battery using grid or alternative sources
                                                                                                                                                                                                   Grid / alternative charging                                                                                                      37%
                  40                                                                                                                                                                                                                         (crank, car…)
                                                                                                                                                          New Entrant
                  35                                                                                                                       Leader
                                                                                                                                                                                                                                             More efficient and customized use of light; prolongs
                  30                                                                                                                    Leader                                                     Multiple brightness levels                                                                                                       34%
                                                                                                                                                                                                                                             battery life
                  25                                                                                                                             New Entrant
                                                                                                                               Leader
                  20
                  10                                                                                                                                                                               Torch mode                                Focuses light for longer distances                                                     16%
                                                                                                                               New Entrant
                   5
                   0
                                                                                                                                                                        Solar Lighting Products                                              Increases ease of use, and improves PLS performance
                                                                                                                                                                                                   Charging effectiveness indicator                                                                                                 21%
                         0                 5             10               15               20                25              30                  35              40
                                                                                                                                                                                                                                             significantly

                                                                                                                                                                                                                                             Flexibility of use by mounting as a ceiling light, reading
                                                                                                                                                                                                   Wall mounting                                                                                                                    21%
                                                                                                                                                                                                                                             light, torch, etc
1. Survey of 12 products in 2010 and 38 products in 2012 that were sold in the African PLS market, and for which price information was available.
                                                                                                                                                                                                   Battery level indicator                   Prevents over-discharge and alerts user when charge
Source:  Lighting Africa data;  Internet research; Dalberg analysis                                                                                                                                                                                                                                                                 16%
                                                                                                                                                                                                                                             complete

                                                                                                                                                                                                  Source: Database of Lighting Global quality-verified PLSs in 2010 and 2012; Interviews and desk research; Dalberg analysis
In addition, the product range has also grown to emphasize consumer-oriented features and design. In 2010, we noted that PLSs were
beginning to be marketed as viable commercial products, whereas previously they were promoted by non-governmental organizations
(NGOs) and through corporate social responsibility (CSR) campaigns. This transition was accompanied by the emergence of features and
27            Lighting Africa Market                                                                                                                                             Lighting Africa Market     28
         April 2013       Trends Report                                                                                                                                                              Trends Report    April 2013

                                                   3. Current market status
                                                   Demand
                                                   The market for lighting products in Africa has witnessed approximately 90-95% growth in cumulative sales since 2009. The lighting product
                                                   market is relatively nascent, and as such, data is scant, making it difficult to make accurate growth projections. Our estimates are based on
                                                   approximate sales data reported during interviews with manufacturers and distributors, who represent more than 65-70% of the good quality
                                                   PLS market, as well as on historical sales data collected by Lighting Africa.

                                                   These sources indicate that since 2009, the market in Africa has experienced dramatic growth—starting from approximately 300,000 lighting
                                                   products in Africa in 2009, overall annual sales effectively doubled each year, causing the sale of approximately 4.4 million units by the
                                                   end of 2012. Given that thus far sales have been largely limited to households11, we believe that almost 20 million African people have now
                                                   gained access to safe and cost effective, off-grid lighting products.

                                                   Figure 8: PLS sales in Africa over time
                                                   Million PLSs; 2009-2012

                                                                                                                                                                                                    4.4
                                                                                                               4.5

                                                                                                               4.0

                                                                                                               3.5

                                                                                                                                                 CAGR:~300%
                                                                                                               3.0

                                                                                                               2.5
                                                                                                                                                                                                     2.0
                                                                                                               2.0

                                                                                                               1.5
                                                                                                                                                                             1.2
                                                                                                               1.0
                                                                                                                                                      0.6
                                                                                        Cumulative             0.5            0.3
                                                                                        Annual
                                                                                                               0.0
                                                                                                                               2009                 2010                     2011                  2012

                                                   1. Numbers do not account for the availability of primarily battery-powered torches in the USD 1-5 price range. Based on Lighting Africa consumer surveys these
                                                      are available to at least 10-15% of African households; a substantial share of these products now utilize LED technologies.

                                                   Source: Lighting Africa data; Dalberg analysis
A Kenyan family using a d.light S-250 at home.
© Andres Bifani/Lighting Africa/2012

                                                   11 Interviews with market experts.
29                   Lighting Africa Market                                                                                                                                                                                                                                            Lighting Africa Market     30
      April 2013               Trends Report                                                                                                                                                                                                                                                             Trends Report    April 2013

Interviewed manufacturers unanimously reported a substantial rise in visibility and demand for lighting products in Africa since 2010. Most                        It is noteworthy that several distributors reported up to three months of stock out per year, due to a combination of financial and logistical
manufacturers of lighting products that have passed Lighting Global’s minimum quality standards reported annual company sales growth                               challenges such as long lead times. This limited growth in the African PLS market. Assuming sufficient latent demand in the PLS market,
in the range of 100-300%. Their own estimates on the overall PLS market growth (products that passed Lighting Global quality standards as                          it is likely that sales could have grown at an even more impressive pace than reported above. For example, while annual sales of Lighting
well as those that did not) were between 70-100% in annual sales per year.                                                                                         Global-verified PLSs touched 880,000 by the end of 2012, we estimate that the continuous availability of stocks could have raised that to
                                                                                                                                                                   approximately 1.2-1.3 million units.
We expect even more accelerated growth rates in the next two-three years driven by repeat sales (either to replace or supplement existing
lighting units) to existing customers, and back-up lighting sales to on-grid customers that have thus far remained low.                                            Despite rapid sales growth, overall market penetration remains low across Africa. Current penetration of PLSs in Africa’s 115-120 million
                                                                                                                                                                   off-grid households is estimated to be between 3.5-4% (by end-2012), assuming the vast majority of lighting products have been sold to
                                                                                                                                                                   households. Of course, as noted above, even this 4% of the market remains unsaturated, and represents a significant future opportunity for
Figure 9: Cumulative sales of Lighting Global quality-verified PLSs in Africa
                                                                                                                                                                   repeat sales.
Thousand PLSs; 2009-12
                                                                                                                                                           1,387
                                                                                    1,400                                                                          The penetration numbers imply that almost 100-110 million off-grid households in Africa are still dependent on traditional alternatives like
                                                                                    1,300                                                                          kerosene lamps, candles and batteries as their primary lighting source. Thus, the off-grid lighting opportunity in Africa is vast, and the PLS
                                                                                    1,200                                                                          market is expected to remain very attractive over the next five to ten years.
                                                                                    1,100

                                                                                    1,100
                                                                                                                                                           884     Figure 10: Market penetration of PLSs
                                                                                      900                                                                          Percentage of total off-grid and under electrified market; 2009-12                                                   4.0%
                                                                                      800                            CAGR:~300%

                                                                                      700

                                                                                      600

                                                                                      500

                                                                                      400                                              336
                                                                                                                                                                                                                                                                      216%
                                                                                      300

                                                                                      200                           146                                                                                                                             205%
                                                     Cumulative
                                                                                      100           18
                                                     Annual                                                                                                                                                                      187%
                                                                                         0
                                                                                                  2009               2010              2011                2012

                                                                                                                                                                                                                                 2009              2010               2011               2012

Source: Lighting Africa sales data (Q4 2012 update); Dalberg analysis
                                                                                                                                                                   1. Analysis assumes a base of 110-120 million off -grid households (2008-2015); Assumes one PLS per household.
                                                                                                                                                                   2. Penetration numbers do not account for the availability of primarily battery-powered torches in the USD 1-5 price range.
                                                                                                                                                                   3. Penetration is representative of ‘best-case-scenario’, and does not take into account replacement or incremental sales.
Sales of quality-verified PLSs have grown by 300%. PLSs in the African market can be segmented into two broad categories: PLSs that have
passed Lighting Global’s minimum quality standards and those that have not12. The high sales volume of quality-verified PLSs is emerging                           Source: Lighting Africa  sales data; World bank population and grid connectivity data; Dalberg analysis
evidence of an evolving consumer base that is becoming more experienced and preferential of quality products. Self-reported sales data
from quality-verified manufacturers indicates that there were close to 1.4 million quality-verified PLSs in the African market by Q4 2012,
                                                                                                                                                                   Penetration of PLSs across African geographies is uneven. The extent to which PLSs are available in African countries is not solely driven by
with cumulative sales crossing the 1 million mark in Q3-Q4 2012. According to our best estimates, this represented more than a quarter of
                                                                                                                                                                   market need or potential. Instead, it appears that the ease of doing business within a country is also an important market driver. For example,
the total number of lighting products13 in the market today.
                                                                                                                                                                   more mature markets, like Kenya and Tanzania, have greater rural connectivity and policy environments that recognize the imperative for
                                                                                                                                                                   off-grid lighting. However, countries such as Nigeria, Ethiopia, and Cameroon represent new markets that have low consumer awareness of
                                                                                                                                                                   lighting products and a challenging regulatory environment—especially in regard to taxes, tariffs and entrepreneurialism.

12 Quality-verified PLSs are those products that have met Lighting Global’s recommended performance targets and/or passed its minimum quality standards.
13 Refers only to the types of pico-powered lighting systems that are specified in the scope section of this report.
31        Lighting Africa Market                                                                                                                                                                                                                                      Lighting Africa Market                     32
April 2013   Trends Report                                                                                                                                                                                                                                                       Trends Report                  April 2013

                                                                                                     Figure 11: Sales of Lighting Global quality-verified PLSs by price
                                                                                                     Percentage of cumulative PLS sales (2009 – 2012)

                                                                                                                                      22                          1.4 million
                                                                                                                                                                                                          Figure 11 shows that quality-verified products that are priced at USD 50
                                                                                                                                                                                                          or below have sold the most over time, accounting for almost 90% of all
                                                                                                            USD 0-20                 32%                             33%                                  cumulative sales up to 2012. Higher-priced PLSs, in the USD 50 and above
                                                                                                                                                                                                          range, comprise only 12% of total sales. This underscores BoP consumers’
                                                                                                                                                                                                          price sensitivity. However, they do climb up the energy ladder and buy higher-
                                                                                                                                                                                                          priced PLSs as they gain confidence in the technology, use their savings and
                                                                                                            USD 20-50                23%                             55%
                                                                                                                                                                                                          tap into financing. It should be noted that sales of small, battery-powered
                                                                                                                                                                                                          LED/CFL devices in the USD 1-5 price range have not been included in our
                                                                                                                                                                                                          analysis. Anecdotal evidence and estimates by market experts suggest that
                                                                                                                                                                                                          cumulative sales of these types of products, which have existed in the market
                                                                                                                                                                                                          for close to three decades, run into the multi-million units.

                                                                                                             USD 50+                 45%                             12%
                                                                                                                                                                                                          Source: Lighting Africa sales data for Kenya (2009-2012);
                                                                                                                           Number of products                        Sales                                Dalberg interviews and analysis

                                                                                                     Key market drivers
                                                                                                     The key market driving trends identified in 2010 have generally held true, and in some cases intensified. These are discussed below.

                                                                                                     •        Lagging grid growth: Across Africa, grid access continues to lag behind population growth rates, implying a growing off-grid population
                                                                                                              over time, and hence, a growing need for off-grid lighting solutions.

                                                                                                     •        Mobile charging: With an estimated 735 million mobile phone subscribers in Africa in mid-2012, including at least 175 million not
                                                                                                              connected to the grid, the need for off-grid charging solutions is growing. As noted in 2010, the increase in mobile subscribers has
                                                                                                              continued to supersede grid growth in Africa with the number of off-grid mobile phone subscribers expected to reach 400 million by
                                                                                                              2015. These customers face serious challenges, travelling several kilometers (often on foot) up to three times a week in order to charge
                                                                                                              their phones for a fee (usually USD 0.50-USD 3). Therefore, this segment of the African population represents a significant opportunity
                                                                                                              for market growth, for PLSs offering mobile phone charging facilities.

                                                                                                     •        Large and growing expenditure on lighting: Our estimates, shown in Figure 12, indicate that the African BoP spent between USD
                                                                                                              13.2-17.3 billion annually on non-renewable, fuel-based lighting (including expenditures on kerosene, batteries, and candles)14
                                                                                                              in 2012. Off-grid households account for USD 10.5-14 billion, or about 80%, of the total lighting expenditure, with spending by
                                                                                                              under-electrified households and SMEs accounting for the remaining 20%. Kerosene remains the most important lighting fuel for off-
                                                                                                              grid and under-electrified households and SMEs in Africa and accounts for approximately 55% of the total BoP lighting expenditure.
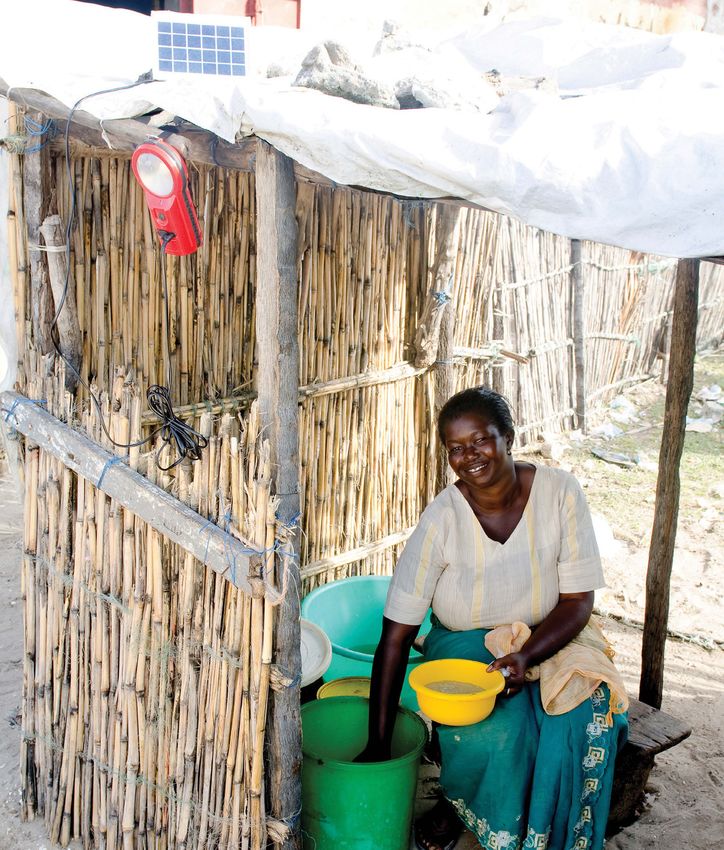
                                      Better lighting makes household chores easier. Here, a woman
                                      using a solar lamp and making tea, Dakar, Senegal.
                                      © Bruno Déméocq/Lighting Africa/2012

                                                                                                     14 In a recently released study from the United Nations Environmental Program (UNEP), African consumers are estimated to spend between USD 12-17 billion per year on fuel-based lighting (www.undp.org). Clearly, UNEP’s

                                                                                                     estimates are well-aligned with the estimates presented in this report at the regional level. However, it must be noted that country-level estimates could differ significantly, given different methodologies and access to different
                                                                                                     sets of data.
33           Lighting Africa Market                                                                                                                                                                                                                                                                      Lighting Africa Market                  34
April 2013      Trends Report                                                                                                                                                                                                                                                                                       Trends Report                April 2013

                                                                           Grid access lags behind population growth, resulting in a growing
                                                                                                                                               Figure 12: BoP lighting expenditure in Africa
                                                                           off-grid population over time. Here a woman using a Marathoner                                                                                                                                                                                            Range of estimates
                                                                           lamp, Senegal.                                                      Billion USD; 2012
                                                                           © Bruno Déméocq/Lighting Africa/2012.
                                                                                                                                                                                         18                                                                                                                                              17.3

                                                                                                                                                                                         16                                                                                                 1.3

                                                                                                                                                                                                                                             1.3
                                                                                                                                                                                         14

                                                                                                                                                                                         12

                                                                                                                                                             Expenditure (Billion USD)
                                                                                                                                                                                         10

                                                                                                                                                                                          8

                                                                                                                                                                                                                                                                                                                                         13.2
                                                                                                                                                                                          6
                                                                                                                                                                                                      10.6

                                                                                                                                                                                          4

                                                                                                                                                                                          2

                                                                                                                                                                                          0

                                                                                                                                                                                              Off-grid households                   On-grid households                                      SMEs                                     2012 (total)

                                                                                                                                               1. Includes estimated expenditure on kerosene, batteries, candles and bio-fuel; the higher range of the estimate assumed higher kerosene usage among primary and secondary users, and
                                                                                                                                                  higher secondary usage of battery-powered devices and candles.
                                                                                                                                               2. Our estimate took into account population segments that paid a kerosene premium for buying the fuel in small quantities.
                                                                                                                                               3. The average price of kerosene across Africa was estimated to be approximately USD 1.13 per liter.

                                                                                                                                               Source: Primary data from the World Bank and the Asian Development Bank; Dalberg analysis.

                                                                                                                                               The importance of kerosene as a fuel source for lighting, especially in East Africa has two implications for future BoP lighting expenditure.
                                                                                                                                               First, emerging data from field studies conducted in five African countries15 indicate that people buying kerosene in small quantities (primarily
                                                                                                                                               in rural areas) have to pay, on average, a premium of approximately 46% relative to their urban counterparts who tend to buy in larger
                                                                                                                                               quantities.16 Therefore, households dependent on kerosene-based lighting in rural areas will continue to be doubly disadvantaged since
                                                                                                                                               they generally earn less than urban residents but end up paying significantly more for their lighting needs. Second, based on historical price
                                                                                                                                               trends, we expect the price of kerosene to continue rising in the next three to five years at a nominal rate of 12% or an inflation-adjusted
                                                                                                                                               rate of 3-5% annually, further driving up overall BoP lighting expenditure in the continent. Clearly, this will bolster the economic case for
                                                                                                                                               switching to cleaner, more modern alternatives such as solar lights, and eventually increase the adoption of these solutions, which are at
  Unfortunately, it is difficult to make a like-for-like comparison between the current level of BoP lighting expenditure and previous
                                                                                                                                               once more cost effective and better-performing.
  years’ estimates (such as our 2010 estimate), primarily because the data sets underlying these estimates are not entirely aligned, as data
  sources are inevitably changed or updated. However, nominally, BoP lighting expenditure has increased by approximately USD 3-7
  billion between 2009 and end of 2012, driven primarily by a still-growing off-grid population and an almost across-the-board increase
  in real kerosene prices throughout Africa.
                                                                                                                                               15 ‘The True Cost of Kerosene’, Lighting Africa (2012)
                                                                                                                                               16 The ‘average’ premium reported in the above mentioned Lighting Africa report was 35%. We used the size of the un-electrified population in each of the surveyed countries
                                                                                                                                                 to come up with a weighted-average premium for our estimates, which was 46%.
35                Lighting Africa Market                                                                                                                                                                                                                                                                      Lighting Africa Market     36
     April 2013            Trends Report                                                                                                                                                                                                                                                                                       Trends Report    April 2013

Figure 13: Drivers of increased off-grid lighting expenditure in Africa
                                                                                                              Kerosene premium paid by small-
                                                                                                                                                                                                   Supply
Kerosene prices in select African countries
                                                                                                              quantity buyers in rural areas
                                                                                                                                                                                                   The PLS market continues to attract new players rapidly. The overall number of manufacturers selling PLSs in Africa has grown sharply from
                                                                                                                                                                                                   20 in 2008 to approximately 80 today. In tandem, the number of manufacturers of quality-verified PLSs has also increased from six in 2010
                                                                                                                                                                                                   to 25 currently.
                                                                                                                                                                                                                                                                                                                                                  60 - 80

                                                                                                                                                                                                   Figure 15: Entry of new players into the African solar lighting market
                                                                                                                                                                                                   Number of players; 2010-12

                                                                                                                                                                                                                                                                                                                                    10 - 20

                                                                                                                                                                                                                                                                                    All manufacturers (2008-12)
                                                                                                                                                                                                                                                                                                                                    2008           2012

1. Average inflation rate in Africa in this period has been 6-8%; real kerosene prices have been rising by approximately 3-4% annually across Africa.
Source: World Bank kerosene price data; Country-specific media reports; ‘The True Cost of Kerosene’ Lighting Africa (2012); Dalberg research and analysis                                                                                                                        1. Quality-verified manufacturers and suppliers are those
                                                                                                                                                                                                                                                                                                                                                    25
                                                                                                                                                                                                                                                                                    that have passed Lighting Global’s minimum quality
                                                                                                                                                                                                                                                                                    standards.
At current prices, households dependent on non-renewable, fuel-based lighting can spend between 70 and 110 USD annually, or approximately                                                                                                                                        Source: Interviews with market players and
between 2 and 5% of their annual household income on their lighting needs; more than 90% of this goes toward ongoing expenditures on                                                                                                                                             experts; Lighting Africa quality-verified list of
                                                                                                                                                                                                                                                                                 performance; Lighting Africa data; Dalberg
fuels like kerosene and disposable batteries for torches. In addition, if we take into account a related and increasingly more common BoP
                                                                                                                                                                                                                                                                                 research.
expenditure – charging mobile phones – our estimates suggest that the average off-grid household will spend another USD 15 annually.
Cumulatively, this brings total household expenditure on lighting and charging to approximately USD 85 per year. As shown in Figure 14,
the use of PLSs for lighting as well as for mobile charging could produce, on average, household savings of approximately USD 65 per year.                                                                                                                                                                                             6

A greater consumer understanding of the significant economic savings available by the use of PLSs will, in turn, further demand for these
products.                                                                                                                                                                                                                                                                 Quality-verified manufacturers (2010-12)
                                                                                                                                                            85                                                                                                                                                                      2010           2012

                                                                                                                         70               15

Figure 14: Annual household expenditure on kerosene                                                                                                                          USD 65 saved per                                                                           Existing players in this market – typically companies that were in the start-
                                                                                                                                                                             year from lighting
and mobile charging vs. expenditure on PLS                                                                                                                                   and mobile charging                                                                        up phase two years ago – have evolved into larger, sophisticated and more
USD per year                                                                                                                                                                                                                                                           complex businesses. These companies have increasingly formalized their
                                                                                                                                                                                                                                                                      business processes, hired professional management teams and established
1. Kerosene assumptions: six hours of usage of kerosene lamp per day;                                  68
   average kerosene price of USD 1.13/liter.                                                                                                                                                                                                                          a long-term strategic presence in Africa. Among these players, more than six
2. Mobile charging assumptions: estimates the charging patterns for the                                                                                                                                                                                              companies have consolidated their presence by setting up regional offices
   average off -grid user (with at least some access to electricity).                                                                                                       20
3. PLS assumptions: median entry-level PLS is USD 20, assuming a
                                                                                                                                                                                                                                                                    in countries like Kenya, Ghana, Uganda, Tanzania and Ethiopia.
   straight line depreciation in 3 years.

Source: GVEP; Internet research; Lighting Africa data on
kerosene prices in Africa; expert interviews;                                  Upfront cost of
                                                                               kerosene lamp
                                                                                                 Annual operating
                                                                                                 cost of kerosene
                                                                                                                    Annual cost of
                                                                                                                       lighting
                                                                                                                                     Annual phone
                                                                                                                                     charging cost
                                                                                                                                                     Total expenditure
                                                                                                                                                       on lighting /
                                                                                                                                                                         Cost of PLS                                                         Multinational companies such as TOTAL have recently entered the market and forged
Dalberg Analysis.                                                                                      lamp                                              charging                                                                            partnerships with existing players. Here, d.light products for sale in a TOTAL shop in Dakar,
                                                                                                                                                                                                                                             Senegal. © Bruno Déméocq/Lighting Africa/2012.
You can also read