2014 impacted on Cane Production - in the South African Sugar Industy - BFAP
←
→
Page content transcription
If your browser does not render page correctly, please read the page content below
Understanding the Factors that have Impacted on Cane Production in the South African Sugar Industry

Understanding the Factors that have
   impacted on Cane Production
  in the South African Sugar Industy
                                          2014
Understanding the Factors that have Impacted on Cane Production in the South African Sugar Industry

 Understanding the Factors that have
 impacted on Cane Production in the
        South African Sugar
              Industry
             Identifying Potential Business
            Options for Future Development

                                                2014
Understanding the Factors that have Impacted on Cane Production in the South African Sugar Industry

Preamble

S  A CANEGROWERS contracted the Bureau for Food and Agricultural Policy (BFAP) at the University of Pretoria to
   conduct a study on the key drivers that have influenced and led to the current state of the South African sugar
industry and to propose some business options to stimulate cane production.

This document constitutes the project report and is divided into two sections / phases:

Phase I
Understanding the Factors that have Impacted on Cane Production in the
South African Sugar Industry

Phase II
Identifying Potential Business Options for Future Development

September, 2014

    Disclaimer

    The views expressed in this report reflect those of the BFAP authors and not necessarily that of SA CANEGROW-
    ERS. While every care has been taken in preparing this document, no representation, warranty, or undertaking
    (expressed or implied) is given and no responsibility or liability is accepted by BFAP as to the accuracy or complete-
    ness of the information contained herein. In addition, BFAP accepts no responsibility or liability for any damages
    of whatsoever nature which any person may suffer as a result of any decision or action taken on the basis of the
    information contained in this report.

                                                              –4–
Understanding the Factors that have Impacted on Cane Production in the South African Sugar Industry

                                           PHASE 1
        Understanding the Factors that have
        Impacted on Cane Production in the
           South African Sugar Industry

                                                          –5–
Understanding the Factors that have Impacted on Cane Production in the South African Sugar Industry

Table of contents

1            Introduction . . . . . . . . . . . . . . . . . . . . . . . . . . . . . . . . . . . . . . . . . . . . . . . . . . . . . . . . . . . . . . . . . . . . . . . . . . . . . . . . . . . . . . . . . . . . . . . . 10
2            Methodology . . . . . . . . . . . . . . . . . . . . . . . . . . . . . . . . . . . . . . . . . . . . . . . . . . . . . . . . . . . . . . . . . . . . . . . . . . . . . . . . . . . . . . . . . . . . . . . 11
3            Cane production . . . . . . . . . . . . . . . . . . . . . . . . . . . . . . . . . . . . . . . . . . . . . . . . . . . . . . . . . . . . . . . . . . . . . . . . . . . . . . . . . . . . . . . . . . . . 12
3.1          Area under cane . . . . . . . . . . . . . . . . . . . . . . . . . . . . . . . . . . . . . . . . . . . . . . . . . . . . . . . . . . . . . . . . . . . . . . . . . . . . . . . . . . . . . . . . . . . . 14
3.2          Yield . . . . . . . . . . . . . . . . . . . . . . . . . . . . . . . . . . . . . . . . . . . . . . . . . . . . . . . . . . . . . . . . . . . . . . . . . . . . . . . . . . . . . . . . . . . . . . . . . . . . . . . . 20
4            Factors affecting area and yield . . . . . . . . . . . . . . . . . . . . . . . . . . . . . . . . . . . . . . . . . . . . . . . . . . . . . . . . . . . . . . . . . . . . . . . . . . . . . . 24
4.1          Large-scale grower indicated factors affecting cane area and yield . . . . . . . . . . . . . . . . . . . . . . . . . . . . . . . . . . . . . . . . . . . 24
4.1.1        North Coast – Darnall, Gledhow and Maidstone . . . . . . . . . . . . . . . . . . . . . . . . . . . . . . . . . . . . . . . . . . . . . . . . . . . . . . . . . . . . . 24
4.1.2        South Coast – Sezela and Umzimkulu . . . . . . . . . . . . . . . . . . . . . . . . . . . . . . . . . . . . . . . . . . . . . . . . . . . . . . . . . . . . . . . . . . . . . . . 24
4.1.3        Zululand and Tugela – Umfolozi, Felixton and Amatikulu . . . . . . . . . . . . . . . . . . . . . . . . . . . . . . . . . . . . . . . . . . . . . . . . . . . . 24
4.1.4        Midlands – Noodsberg and Eston . . . . . . . . . . . . . . . . . . . . . . . . . . . . . . . . . . . . . . . . . . . . . . . . . . . . . . . . . . . . . . . . . . . . . . . . . . . 25
4.1.5        Northern Irrigated –Malelane, Komatipoort and Pongola . . . . . . . . . . . . . . . . . . . . . . . . . . . . . . . . . . . . . . . . . . . . . . . . . . . . 25
4.1.6        Identification of main factors . . . . . . . . . . . . . . . . . . . . . . . . . . . . . . . . . . . . . . . . . . . . . . . . . . . . . . . . . . . . . . . . . . . . . . . . . . . . . . . . 25
5            Economic factors. . . . . . . . . . . . . . . . . . . . . . . . . . . . . . . . . . . . . . . . . . . . . . . . . . . . . . . . . . . . . . . . . . . . . . . . . . . . . . . . . . . . . . . . . . . . 27
5.1          Input costs . . . . . . . . . . . . . . . . . . . . . . . . . . . . . . . . . . . . . . . . . . . . . . . . . . . . . . . . . . . . . . . . . . . . . . . . . . . . . . . . . . . . . . . . . . . . . . . . . . 27
5.1.1        Farm staff and labour. . . . . . . . . . . . . . . . . . . . . . . . . . . . . . . . . . . . . . . . . . . . . . . . . . . . . . . . . . . . . . . . . . . . . . . . . . . . . . . . . . . . . . . . 29
5.1.2        Fertiliser. . . . . . . . . . . . . . . . . . . . . . . . . . . . . . . . . . . . . . . . . . . . . . . . . . . . . . . . . . . . . . . . . . . . . . . . . . . . . . . . . . . . . . . . . . . . . . . . . . . . . 29
5.1.3        Fuel, lubricants and mechanisation maintenance and transport . . . . . . . . . . . . . . . . . . . . . . . . . . . . . . . . . . . . . . . . . . . . . 31
5.2          RV payment system . . . . . . . . . . . . . . . . . . . . . . . . . . . . . . . . . . . . . . . . . . . . . . . . . . . . . . . . . . . . . . . . . . . . . . . . . . . . . . . . . . . . . . . . . 32
5.2.1        RV payment system’s impact on allocation of proceeds to farmers . . . . . . . . . . . . . . . . . . . . . . . . . . . . . . . . . . . . . . . . . . . 32
5.2.2        RV’s impact on sugar production . . . . . . . . . . . . . . . . . . . . . . . . . . . . . . . . . . . . . . . . . . . . . . . . . . . . . . . . . . . . . . . . . . . . . . . . . . . . 42
5.2.3        Felixton’s Brix minus pol issue . . . . . . . . . . . . . . . . . . . . . . . . . . . . . . . . . . . . . . . . . . . . . . . . . . . . . . . . . . . . . . . . . . . . . . . . . . . . . . . 46
5.3          Profitability. . . . . . . . . . . . . . . . . . . . . . . . . . . . . . . . . . . . . . . . . . . . . . . . . . . . . . . . . . . . . . . . . . . . . . . . . . . . . . . . . . . . . . . . . . . . . . . . . . 47
5.4          Economic factors – conclusion . . . . . . . . . . . . . . . . . . . . . . . . . . . . . . . . . . . . . . . . . . . . . . . . . . . . . . . . . . . . . . . . . . . . . . . . . . . . . . 49
6            Sustainability. . . . . . . . . . . . . . . . . . . . . . . . . . . . . . . . . . . . . . . . . . . . . . . . . . . . . . . . . . . . . . . . . . . . . . . . . . . . . . . . . . . . . . . . . . . . . . . . 50
6.1          Main agronomic factors limiting sustainability . . . . . . . . . . . . . . . . . . . . . . . . . . . . . . . . . . . . . . . . . . . . . . . . . . . . . . . . . . . . . . . 50
6.2          Analysing each factor in the context of Sustainability . . . . . . . . . . . . . . . . . . . . . . . . . . . . . . . . . . . . . . . . . . . . . . . . . . . . . . . . 50
6.2.1        The decline in organic carbon levels in the soils . . . . . . . . . . . . . . . . . . . . . . . . . . . . . . . . . . . . . . . . . . . . . . . . . . . . . . . . . . . . . 51
6.2.2        Increasing soil acidity on sugarcane fields . . . . . . . . . . . . . . . . . . . . . . . . . . . . . . . . . . . . . . . . . . . . . . . . . . . . . . . . . . . . . . . . . . . 51
6.2.3        The depletion of certain essential plant nutrients . . . . . . . . . . . . . . . . . . . . . . . . . . . . . . . . . . . . . . . . . . . . . . . . . . . . . . . . . . . . 51
6.2.4        Compaction of soils due to heavy machinery . . . . . . . . . . . . . . . . . . . . . . . . . . . . . . . . . . . . . . . . . . . . . . . . . . . . . . . . . . . . . . . . 52
6.2.5        Increasing insect pressure – Eldana, Thrips and Nematodes . . . . . . . . . . . . . . . . . . . . . . . . . . . . . . . . . . . . . . . . . . . . . . . . . . 52
6.2.6        Farming for RV . . . . . . . . . . . . . . . . . . . . . . . . . . . . . . . . . . . . . . . . . . . . . . . . . . . . . . . . . . . . . . . . . . . . . . . . . . . . . . . . . . . . . . . . . . . . . . 53
6.3          Sustainability factors – conclusion . . . . . . . . . . . . . . . . . . . . . . . . . . . . . . . . . . . . . . . . . . . . . . . . . . . . . . . . . . . . . . . . . . . . . . . . . . . 53
7            Socio-political factors . . . . . . . . . . . . . . . . . . . . . . . . . . . . . . . . . . . . . . . . . . . . . . . . . . . . . . . . . . . . . . . . . . . . . . . . . . . . . . . . . . . . . . . 54
7.1          Land reform . . . . . . . . . . . . . . . . . . . . . . . . . . . . . . . . . . . . . . . . . . . . . . . . . . . . . . . . . . . . . . . . . . . . . . . . . . . . . . . . . . . . . . . . . . . . . . . . . 54
7.2          Grower – miller relationship . . . . . . . . . . . . . . . . . . . . . . . . . . . . . . . . . . . . . . . . . . . . . . . . . . . . . . . . . . . . . . . . . . . . . . . . . . . . . . . . . 54

                                                                                                        –6–
Understanding the Factors that have Impacted on Cane Production in the South African Sugar Industry

7.3                Urban Development . . . . . . . . . . . . . . . . . . . . . . . . . . . . . . . . . . . . . . . . . . . . . . . . . . . . . . . . . . . . . . . . . . . . . . . . . . . . . . . . . . . . . . . . 54
7.4                Socio-political factors – conclusion . . . . . . . . . . . . . . . . . . . . . . . . . . . . . . . . . . . . . . . . . . . . . . . . . . . . . . . . . . . . . . . . . . . . . . . . . . 55
8                  Summary and Conclusion . . . . . . . . . . . . . . . . . . . . . . . . . . . . . . . . . . . . . . . . . . . . . . . . . . . . . . . . . . . . . . . . . . . . . . . . . . . . . . . . . . . 55

Tables
Table 1:           Change in area under cane according to grower types for the 16 year period 1996/97
                   to 2012/13 . . . . . . . . . . . . . . . . . . . . . . . . . . . . . . . . . . . . . . . . . . . . . . . . . . . . . . . . . . . . . . . . . . . . . . . . . . . . . . . . . . . . . . . . . . . . . . . . . . 17
Table 2:           Simulated and actual yield change per year for large-scale growers and small-scale growers
                   for 2001 to 2010 (%) . . . . . . . . . . . . . . . . . . . . . . . . . . . . . . . . . . . . . . . . . . . . . . . . . . . . . . . . . . . . . . . . . . . . . . . . . . . . . . . . . . . . . . . . . 23
Table 3:           Sugar cane inputs – share of total input expenditure comparison for 1985/86 and 2011/12 . . . . . . . . . . . . . . . . . . 27
Table 4:           Annual percentage expenditure change . . . . . . . . . . . . . . . . . . . . . . . . . . . . . . . . . . . . . . . . . . . . . . . . . . . . . . . . . . . . . . . . . . . . 28
Table 5:           RV vs sucrose payment system - impact for each mill area (in million Rands for the
                   specific season) . . . . . . . . . . . . . . . . . . . . . . . . . . . . . . . . . . . . . . . . . . . . . . . . . . . . . . . . . . . . . . . . . . . . . . . . . . . . . . . . . . . . . . . . . . . . . 37
Table 6:           RV compensation payments (R/ton of cane) . . . . . . . . . . . . . . . . . . . . . . . . . . . . . . . . . . . . . . . . . . . . . . . . . . . . . . . . . . . . . . . . . 38
Table 7:           Share of divisible pool comparison under RV and sucrose payment systems, for
                   different production scenarios . . . . . . . . . . . . . . . . . . . . . . . . . . . . . . . . . . . . . . . . . . . . . . . . . . . . . . . . . . . . . . . . . . . . . . . . . . . . . . 41

Figures
Figure 1:          Total SA tons cane harvested (not including SASRI research farms) . . . . . . . . . . . . . . . . . . . . . . . . . . . . . . . . . . . . . . . . . . . 12
Figure 2:          Production trends in milling areas where production has increased or remained
                   relatively stable (tons cane). . . . . . . . . . . . . . . . . . . . . . . . . . . . . . . . . . . . . . . . . . . . . . . . . . . . . . . . . . . . . . . . . . . . . . . . . . . . . . . . . . 13
Figure 3:          Production trends in milling areas where production has decreased (tons cane) . . . . . . . . . . . . . . . . . . . . . . . . . . . . . 13
Figure 4:          Comparison of RV tons harvested for coastal versus inland and irrigation regions (RV tons) . . . . . . . . . . . . . . . . . . . 13
Figure 5:          Area under cane for miller-cum-planters, large-scale growers and small-scale growers
                   (hectares) . . . . . . . . . . . . . . . . . . . . . . . . . . . . . . . . . . . . . . . . . . . . . . . . . . . . . . . . . . . . . . . . . . . . . . . . . . . . . . . . . . . . . . . . . . . . . . . . . . . 14
Figure 6 a-o:      Mill region specific area under cane according to grower type 1996/97 to 2012/13 (ha) . . . . . . . . . . . . . . . . . . . . . . 15
Figure 7:          Registered small-scale growers and number who delivered, 1972-2010 . . . . . . . . . . . . . . . . . . . . . . . . . . . . . . . . . . . . . . 17
Figure 8:          Large-scale farmer area under cane according to production regions (ha). . . . . . . . . . . . . . . . . . . . . . . . . . . . . . . . . . . . 18
Figure 9:          Number of large-scale growers accrording to the different production regions. . . . . . . . . . . . . . . . . . . . . . . . . . . . . . . 19
Figure 10:         Total area under cane change for different milling regions (ha). . . . . . . . . . . . . . . . . . . . . . . . . . . . . . . . . . . . . . . . . . . . . . . 20
Figure 11:         Area change comparing coastal and inland cane production regions (ha). . . . . . . . . . . . . . . . . . . . . . . . . . . . . . . . . . . . 20
Figure 12:         Rainfall indications (June-May) for mill areas in main production regions (measured in mm). . . . . . . . . . . . . . . . . . 21
Figure 13 a-m: Cane yield in tons of cane per harvested area and RV tons per harvested area. . . . . . . . . . . . . . . . . . . . . . . . . . . . . . . . 21
Figure 14:         Real input expenditure trends per hectare for industry (R/ha) . . . . . . . . . . . . . . . . . . . . . . . . . . . . . . . . . . . . . . . . . . . . . . . . 27
Figure 15:         Comparison of standardised real total fixed and variable cost per hectare and per ton . . . . . . . . . . . . . . . . . . . . . . . 28
Figure 16:         Real total cost index for Coastal, Midlands and Northern Irrigated regions . . . . . . . . . . . . . . . . . . . . . . . . . . . . . . . . . . . . 29
Figure 17:         Real farm staff expenditure per hectare for the three main production regions (R/ha) . . . . . . . . . . . . . . . . . . . . . . . . 29
Figure 18:         Real farm staff expenditure per ton of cane produced for the three main production
                   regions (R/ton) . . . . . . . . . . . . . . . . . . . . . . . . . . . . . . . . . . . . . . . . . . . . . . . . . . . . . . . . . . . . . . . . . . . . . . . . . . . . . . . . . . . . . . . . . . . . . . 30
Figure 19:         Real fertiliser expenditure per hectare (R/ha and 2000 index value) . . . . . . . . . . . . . . . . . . . . . . . . . . . . . . . . . . . . . . . . . . 30
Figure 20:         Real fertiliser expenditure indexes for production regions (2000) . . . . . . . . . . . . . . . . . . . . . . . . . . . . . . . . . . . . . . . . . . . . . 31
Figure 21:         Real fertiliser expenditure per ton cane produced (R/ton) . . . . . . . . . . . . . . . . . . . . . . . . . . . . . . . . . . . . . . . . . . . . . . . . . . . . 31

                                                                                                            –7–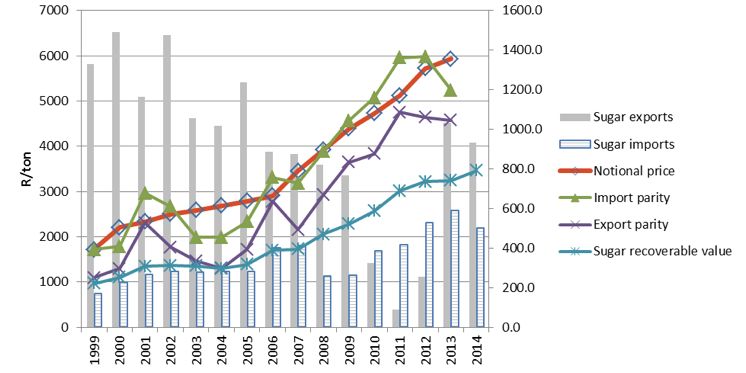
Understanding the Factors that have Impacted on Cane Production in the South African Sugar Industry

Figure 22:           Real fuel and lubrication, mechanical maintenance and real cane transport
                     expenditure per hectare compared to the real fuel index (2000) . . . . . . . . . . . . . . . . . . . . . . . . . . . . . . . . . . . . . . . . . . . . . 32
Figure 23:           Nominal and real RV price per ton of cane (R/ton) . . . . . . . . . . . . . . . . . . . . . . . . . . . . . . . . . . . . . . . . . . . . . . . . . . . . . . . . . . . 33
Figure 24:           RV percentages for different production regions 1987 to 2011 . . . . . . . . . . . . . . . . . . . . . . . . . . . . . . . . . . . . . . . . . . . . . . . 33
Figure 25 a-m: RV% compared to the RV tons per hectare harvested for the different production regions . . . . . . . . . . . . . . . . . . . 34
Figure 26 a-j:       Net impact of the RV payment system compared to the sucrose payment system,
                     after farming for RV compensation is taken into consideration . . . . . . . . . . . . . . . . . . . . . . . . . . . . . . . . . . . . . . . . . . . . . . . 39
Figure 27:           Real revenue per hectare for different production regions (R/ha) . . . . . . . . . . . . . . . . . . . . . . . . . . . . . . . . . . . . . . . . . . . . . 41
Figure 28 a-f: Comparison of RV% with sugar extraction per RV ton . . . . . . . . . . . . . . . . . . . . . . . . . . . . . . . . . . . . . . . . . . . . . . . . . . . . . . . . 42
Figure 29:           Comparison of industry cane tons harvested and mills’ extraction ‘efficiency’ . . . . . . . . . . . . . . . . . . . . . . . . . . . . . . . . . 45
Figure 30:           Industry sucrose loss percentage – sucrose content in final molasses, bagasse,
                     filter cake and undetermined losses . . . . . . . . . . . . . . . . . . . . . . . . . . . . . . . . . . . . . . . . . . . . . . . . . . . . . . . . . . . . . . . . . . . . . . . . . 46
Figure 31:           Industry profitability per hectare (R/ha) . . . . . . . . . . . . . . . . . . . . . . . . . . . . . . . . . . . . . . . . . . . . . . . . . . . . . . . . . . . . . . . . . . . . . . 47
Figure 32:           Coastal milling regions profitability per hectare (average for Amatikulu, Felixton,
                     Darnall, Maidstone, Gledhow, Sezela and Umzimkulu) . . . . . . . . . . . . . . . . . . . . . . . . . . . . . . . . . . . . . . . . . . . . . . . . . . . . . . . 48
Figure 33:           Midlands profitability per hectare (average of Noodsberg, Eston and UCL) . . . . . . . . . . . . . . . . . . . . . . . . . . . . . . . . . . . 48
Figure 34:           Northern Irrigated regions profitability per hectare (CANEGROWERS’s’ calculations) . . . . . . . . . . . . . . . . . . . . . . . . . . 49
Figure 35:           Percentage area trashed. . . . . . . . . . . . . . . . . . . . . . . . . . . . . . . . . . . . . . . . . . . . . . . . . . . . . . . . . . . . . . . . . . . . . . . . . . . . . . . . . . . . . 53

                                                                                                       –8–
Understanding the Factors that have Impacted on Cane Production in the South African Sugar Industry

Phase I: Executive Summary

T
        HIS REPORT CONSTITUTES the phase one report,                      The RV payment system that was implemented for the
        shedding light on the factors that have impacted on           first time for the 2000/01 season, had an impact on farmer
        cane production in the South African sugar industry.          revenue by altering the allocated proportions of the divisible
    Cane production has decreased significantly since 2000/01         pool, largely to the benefit of Midlands and Northern Irrigation
driven by both a decrease in area under cane and cane yield.          farmers who produce higher quality cane than their Coastal
A 51% or just over 47 000 hectare decline in small-scale              counterparts. The direct net financial impact of the payment
grower area under cane was the main driver of area decrease.          system, after ‘farming for RV compensation’ was taken into
A considerable decrease in miller-cum-planter cane area was           consideration was shown not to be a substantial driver of
largely mirrored by an increase in large-scale grower area            decreased profitability when compared to increasing input
under cane. This expansion however mainly took place in               costs, depressed RV price 2001/02-2005/06 and adverse
the Midlands and Mpumalanga while the Coastal area under              weather conditions. These calculations were however done
cane decreased substantially. Cane yield decreased more               using aggregate mill region data and it is likely that the pool
than what can be explained by bad weather, especially in the          share (and revenue) of underperforming farmers (bottom
South Coast, North Coast and Zululand production regions.             25%) and the majority of small scale growers decreased
In the nine years 2001-2010 South Coast large scale growers           substantially, while better performing farmers within ‘losing
yield decreased by more than 11%, on the North Coast large            areas’ benefitted from the RV system.
scale growers yield dropped by nearly 20% and in Zululand by              A key premise for the introduction of the RV payment
nearly 16%. Zululand small scale growers yield decreased by           system was that increased cane quality would lead to
nearly 38% for the same period while North Coast small scale          increased sugar income. Farmers in most areas reacted to the
growers yield dropped by 23.6%.                                       cane quality incentive (low quality penalty) and produced and
    The area and yield declines were explained at the hand of         delivered higher RV% cane. The mills however did not produce
economic, sustainability and socio-political factors as indicated     more sugar from the higher quality cane and sugar extraction
by large scale growers and as far as possible supported by            efficiency has in fact decreased considerably, at a great cost
CANEGROWERS data.                                                     to growers and millers, but especially to growers. While there
    The profitability of cane farming has decreased significantly     is a clear link between cane tonnage harvested and delivered
for dryland farmers since the early 2000s and especially for          (throughput) and sucrose extraction rates, mill efficiency in the
Coastal farmers. Midlands farmers’ net farm income percentage         Irrigation and Midlands areas, where production has increased
for the period 2000/01 to 2011/12 has decreased by 26% while          or remained relatively stable, has also decreased.
Coastal farmers’ percentage has dropped by 54%. Increasing                The uncertainty brought by land claims resulted in, initial
input prices played a substantial role in the dwindling               as well as longer term, disinvestment in soil health and ratoon
profitability with the real average industry expenditure per          replacement, with the effect that farmers’ yield potential
hectare of cane increasing by 33%, driven mainly by increased         decreased. Increasing input prices, combined with a depressed
fertiliser, labour and fuel prices. Though the RV price did not       real RV prices (2000-2005), less than ideal rainfall conditions
increase from 2002/03 to 2005/06, it did increase by more             and waning yields resulted in inability of farmers to implement
than 50% from 2005/06 to 2011/12 but grower reaction to the           Best Management Practises (and SUSfarm guidelines) and
price increase was limited by drier than normal conditions for        rectify their ‘unhealthy’ production systems.
a number of seasons.

                                                                    –9–
Understanding the Factors that have Impacted on Cane Production in the South African Sugar Industry

Introduction

T
        HE SOUTH AFRICAN sugar industry is more than 150               negatively on the financial position of sugarcane farmers.
        years old and is important not only for its contribution to        In addition to the less than ideal sugar cane production
        GDP (2009-2012 sugar cane was the largest agricultural         milieu, some role-players in the sugar sector are questioning
commodity produced in South Africa by volume, and the 7th              the validity and equity of the industry agreed cane pricing
largest by value and represented 17.4% of the total annual             mechanism. Over the years the sugar industry has implemented
value of field crop production (FAOSTAT, 2014; DAFF 2011)), but        a number of different cane pricing mechanisms. The initial cane
also as a contributor to direct employment in both sugarcane           weight system was replaced by the sucrose content payment
production and processing as well as indirect employment in            mechanism in 1926. Even though this system was in place for
the support industries (chemical, transport, etc). According to a      a substantial period it was deemed to be less than ideal, mainly
NAMC report by Conningarth (2013) the sugar industry directly          due to the fact that the value of the cane could not be directly
employs approximately 113 000 workers, which constitutes               linked to the value of the sugar eventually attained from it.
0.9% of total employment in SA but importantly 5.1% of total           In 2000 the sucrose system was replaced by the recoverable
employment in KwaZulu-Natal and Mpumalanga. The same                   value (RV) pricing system that also incorporates non-sucrose
study estimated that nearly 600 000 people in mainly the rural         impurities and fibre into the pricing formula. Whether the RV
areas of KwaZulu-Natal and Mpumalanga are dependent on                 payment system directly contributed to the decrease of cane
workers employed in the sugar industry. BFAP estimates the             production in South Africa is not clear.
direct sugar workforce a bit lower, closer to 80 000 workers,          To this end, SA CANEGROWERS contracted the Bureau for
but the role of the sugar industry as a provider of livelihood         Food and Agricultural Policy (BFAP) at the University of Pretoria
for the rural poor cannot be overemphasised. The industry has          to conduct a study on the key drivers that have influenced
also long been a significant contributor to foreign exchange           and led to the current state of the industry and to propose
earnings, with net exports of all sugar products between               a business model to stimulate cane production by primary
$200m and $300m since 2000.                                            producers within the Sugar Industry Agreement and new
    However, over the past decade, sugarcane tons harvested            Sugar Act environment.
decreased from 23.8 million in 2000/01 to 16.7 million tons                This document constitutes the phase one report, shedding
in 2011/12; i.e. a drop of 7.06 million tons or 29.7% in eleven        light on the factors that have impacted on cane production
years. This decline in production has raised a number of               in the South African sugar industry. Following the next brief
questions regarding the general wellbeing and future of                section on methodology, light will be shed on how the area
sugarcane farming in South Africa. Apart from rising input and         under cane and cane yield have changed over the last 25 years
transportation costs, industry experts argue that a number of          with a special focus on the last 12 years (2000/01 to 2011/12).
external influences such as urbanisation in the coastal regions,       The main factors impacting on cane production will then be
land claims, unsuccessful land reform projects and high                presented and discussed.
fertiliser prices have all contributed to this declining trend.
In the past decade, seasonal droughts have also impacted

                                                                  – 10 –
Understanding the Factors that have Impacted on Cane Production in the South African Sugar Industry
Methodology
T
HIS STUDY HAS two main objectives, namely to statements. Rigorous quality control of the data based on
identify the factors that have contributed to current 19 exclusion criteria ensures that the data is accurate and
trends in sugarcane production over the last decade representative of the different mill regions.
(2000/01 to 2011/012) and to determine the extent to which In order to identify the issues that impacted on cane
these factors have influenced the decline. It was proposed production, area under cane and cane yield, group discussions
that the objective could be met by answering two underlying were held with large-scale growers in all the different milling
questions: regions with the exception of UCL Company Limited in the
Midlands. Most farmer discussion meetings were held 22-
1. How has the area under cane changed (in each mill area) 30 July 2013 (Umzimkulu on 22 August) and a total of 90
and what are the determinants of this change? farmers attended the discussion meetings. The BFAP research
2. For land that has remained in cane production, what has group also met with SASRI and SMRI representatives and
happened to actual yields relative to potential yields, and CANEGROWERS’ Chairman, and consulted at length and on
what are the determinants of such changes? various occasions with CANEGROWERS’ Director of Industrial
Affairs and Manager of Economic Research.
It was proposed that the two underlying questions could be Through the different meetings, discussions and
answered by following a supply chain approach - analysing consultations the focus fell on the economic, sustainability
and consulting with stakeholders in the South African and socio-political factors that have impacted on sugarcane
sugar sector at various levels/nodes in the chain. Following production over the last 25 years but especially over the
consultation with CANEGROWERS and perusal of their data last twelve years 2000/01 – 2011/12. The aim of the various
base, it was decided that the study methodology would discussions was to identify the main factors impacting on cane
depart slightly from the formal supply-chain analysis that was production, as viewed by producers and other role players,
initially proposed. Though the approach used still incorporates with the objective of testing and supporting these views at
most of the supply chain methodology focus points, with the the hand of CANEGROWERS and BFAP data.
availability of detailed and comprehensive time series data for This study did not specifically focus on small-scale growers’
producers in all the mill regions, it was decided that the study production trends and the reasons behind any changes. A
would be done from a producer point of view. This makes number of studies, including Bates Consulting (2005), Armitage
sense as the cane producer is the node in the supply chain that et al., (2009), SOI (2008) and FIRCOP (2011) have studied the
connects the other role players and CANEGROWERS’ diverse “substantial complexities” faced by small scale growers (as seen
time series data sets made primary data collection from other in CANEGROWERS, 2012). Though this study will shed light on
nodes unnecessary. how the small scale growers cane area has changed, it will not
In addition to industry production and yield data, the endeavour to study smallholder specific issues. It has been
study made use of CANEGROWERS’ large-scale grower cost suggested by numerous large-scale growers that the issues
survey data. This data is obtained from large-scale growers that impact on cane area and cane yield for large scale growers
who either utilize the CaneFarms Bookkeeping Service also affect small scale growers, and in many cases in a more
offered by CANEGROWERS by completing annual cost severe manner.
survey questionnaires, or who submit their annual financial
– 11 –Understanding the Factors that have Impacted on Cane Production in the South African Sugar Industry
Cane Production
T
HE TOTAL NATIONAL tonnage of sugarcane harvested regions where cane production has decreased considerably
in the period 2000/01 to 2011/12 has decreased are the coastal regions and regions where a large share of the
considerably and at a rather constant and alarming mills’ cane is planted at a relatively low altitude. Increases and
rate of more than 500 000 tons per season (Figure 1). Of relative stability in cane production were attained in mainly
concern is especially the period since 2005 when the cane the Northern Irrigated and the Midland areas.
tonnage delivered deceased despite a considerable increase It has been suggested that one of the indirect objectives of
in the nominal Recoverable Value (RV) price paid for delivered the RV payment system was to decrease the tons of sugarcane
sugarcane as well as a smaller but constant increase in the real delivered relative to the tons of sucrose recovered, and a
RV price. decrease in cane tonnage would thus seem to be in line with
By considering each milling region’s tonnage cane harvested expectations. However, Figure 4 shows that RV tons delivered
(Figures 2 and 3), it is clear that not all the production regions for the Northern Irrigated and Midlands mills as well as the
have followed the declining production trend suggested by Coastal mills have decreased, by 8 463 tons per annum on
the aggregate industry harvest figures. Figure 2 indicates average for the inland mills, and by nearly 55 000 RV tons less
production trends in regions where harvested and delivered per season for the Coastal mills over the eleven year period.
cane tons have increased or remained relatively stable while The total quantity of sugarcane produced, harvested and
Figure 3 depicts harvest trends in the mill regions where the delivered to the mills depends on the size of the area of land
tons cane harvested have decreased over the period 2000/01 under cane and the production of cane per unit of land, i.e.
- 2011/12. yield. The next two sections will highlight the changes in area
By comparing the increasing and decreasing cane under cane and cane yield.
production mill regions it is quite apparent that the milling
Figure 1: Total SA tons cane harvested (not including SASRI research farms)
Note: In this report tons refer to metric tons, i.e. tonnes
– 12 –Understanding the Factors that have Impacted on Cane Production in the South African Sugar Industry
Figure 2: Production trends in milling areas where production has increased or remained relatively stable (tons cane)
Figure 3: Production trends in milling areas where production has decreased (tons cane)
Figure 4: Comparison of RV tons harvested for coastal versus inland and irrigation regions (RV tons)
– 13 –Understanding the Factors that have Impacted on Cane Production in the South African Sugar Industry
3.1 Area under cane on the area changes. These factors will be discussed in sections
After increasing by 5% from 1996/97 to 2001/02, the total 4 - 7 of this report along with the factors that impacted on
area under sugarcane (not including SASRI research farm yield.
cane) decreased by 14.9% over the 10 years up to 2011/12 Figures 6 a-o present the area under cane for the different
and increased (for the first time in a decade) by 1.2% for the mill areas in the different production regions. A summary of
2012/13 season. The area decline from 2001/02 to 2005/06 was the change in area under cane for each mill area between
relatively minor but in the five seasons 2006/07 to 2011/12, the 1996/97 to 2012/13 is presented in Table 1.
area under cane dropped by 12.4% or 52 163 ha. While MCP area under cane has decreased considerably,
From Figure 5 it is clear that the South African sugarcane area most of this land initially was, or still is planted to cane, just
has decreased considerably. This decline was generally not the under new ownership. It is clear from a number of the mill
result of large-scale growers shedding cane hectares. Between area graphs (Malelane, Darnall, Eston and Sezela in particular)
1996/97 and 2011/12, large-scale growers increased their cane that milling company cane land has been transferred to large-
plantings by 16.9%. Though most of the growth in area under scale growers or is leased to them. In addition, in many cases
cane took place over the four seasons 1996/97 to 2000/01 the milling companies have sold farms to government under
(16.5%), it would seem as if aggregate large-scale growers land the land restitution and redistribution programmes as well
devoted to cane production remained relatively stable for the as to previously disadvantaged farmers and mill employees
next 12 years. as freehold land. According to Madhanpall (2013), milling
For miller-cum-planters (MCP) and small-scale growers the companies have sold an estimated 18 789 ha to 170 black
opposite is true. Between 1996/97 and 2012/13 MCP cane farmers over the last number of years. These farmers and farms,
area decreased by 36 538 ha or 54.1% and small-scale growers based on their land area under cane, are classified as large-
area under cane decreased by 47 113 ha or 50.6%. However, scale growers and these cane hectares thus basically moved
considering the contrasting mill region specific trends of from the MCP category to the large-scale growers category.
Figures 2 and 3, it is very likely that Figure 5’s aggregate national It is however clear from Table 1 that in Mpumalanga and the
area under cane indications for millers (MCP) and large (LSG) Midlands large-scale growers’ area under cane expanded
and small-scale growers (SSG) hide substantial differences considerably more than by the size of the land sold by the
between the regions. For this reason, the area under cane millers. On the North Coast however the opposite is true, with
for each mill area is considered and discussed according to the MCP’s area under cane decreasing by more than 20 000 ha
grower type. The actual changes in area under cane will be while the large-scale growers’ area only increased by 737 ha.
presented without aiming to explain the factors that impacted
Figure 5: Area under cane for miller-cum-planters, large-scale growers and small-scale growers (hectares)
– 14 –Understanding the Factors that have Impacted on Cane Production in the South African Sugar Industry
Mpumalanga
a) Malelane b) Komatipoort
Zululand
c) Pongola d) Umfolozi
e) Felixton
Tugela
f) Amatikulu g) Entumeni
– 15 –Understanding the Factors that have Impacted on Cane Production in the South African Sugar Industry
North Coast
h) Darnall i) Maidstone
j) Gledhow k) Glendale
South Coast
l) Sezela m) Umzimkulu
Midlands
n) Noodsberg o) Eston
Figure 6 a-o: Mill region specific area under cane according to grower type 1996/97 to 2012/13 (ha)
– 16 –Understanding the Factors that have Impacted on Cane Production in the South African Sugar Industry
Table 1: Change in area under cane according to grower types for the 16 year period 1996/97 to 2012/13
MCP change in Small-scale Large-scale Total change in Milling region
area under cane growers change in growers change in area under cane change in area
area under cane area under cane under cane
Malelane -4698 1127 7757 4186 Mpumalanga
Komatipoort 1761 3674 6767 12202 16388
Pongola 0 -1496 2990 1494
Zululand
Umfolozi 0 -1981 889 -1092
-7131
Felixton -237 -2735 -4561 -7533
Amatikulu 0 -6370 1691 -4679 Tugela
Entumeni 0 -6169 -5929 -12098 -16777
Glendale -1288 -8540 -1340 -11168
Darnall -5394 280 -2295 -7409 North Coast
Gledhow -6293 -458 10810 4059 -36265
Maidstone -7352 -7957 -6438 -21747
Eston -2068 -2628 13942 9246
Midlands
Union Coop -72 -3111 3735 552
9365
Noodsberg -2772 -1668 4007 -433
Sezela -8105 -5646 10220 -3531 South Coast
Umzimkulu -20 -3435 1767 -1688 -5219
Total -36538 -47113 44012 -39639 -39639
Small-scale grower area under cane has only increased in planted to cane is mirrored by the number of smallholders
the Mpumalanga irrigation areas over the period 1996/97 farmers involved in cane production. The number of
to 2012/13 and especially Komatipoort has seen a relatively smallholder cane farmers reached a maximum around 1996/97
stable increase. The jump in small-scale growers’ area under and the number of registered cane growers decreased from
cane for the Amatikulu and Gledhow mills in 2004/05 (see Mill an estimated 57 000 farmers to fewer than 30 000 in 2010/11.
graphs above) was the result of the closure of the Entumeni Farmers who actually delivered cane (which is probably a
and Glendale mills following the 2003/04 season. If the area closer indication of productive small-scale growers) basically
increases in Mpumalanga are excluded from calculation, small- halved during the same period from around 30 000 to fewer
scale growers area under cane declined by 51 914 hectares with than 14 000 farmers and from 2004/05 to 2009/10 small-scale
79% of this decline taking place in the Coastal production areas. farmers left the sugar industry at a rate of 2 000 growers per
Figure 7 shows that the decrease in small-scale grower area annum (CANEGROWERS, 2012).
Figure 7: Registered small-scale growers and number who delivered, 1972-2010
Source (CANEGROWERS, 2012)
– 17 –Understanding the Factors that have Impacted on Cane Production in the South African Sugar Industry
In total, large-scale growers’ area under cane increased large-scale growers area under cane has increased remarkably
by 44 012 hectares or 17.6% during the period 1996/97 to and where this region’s contribution to total national cane area
2012/13. The irrigated cane area in Mpumalanga increased was more or less on par with that of the North Coast in 1996/97,
considerably with the Malelane area expanding by 7 757 the Midlands planted 26 140 hectares more than North
ha and Komatipoort with 6 767 ha (87 and 70 percent Coast growers in 2012/13. South Coast (mainly Sezela) and
respectively based on 1996/97 plantings). The area under Mpumalanga also expanded while the North Coast, Zululand
cane in the Midlands also increased with Eston expanding and Tugela regions’ area under cane remained relatively stable
by 13 942 ha and Union Coop and Noodsberg by 3 735 and or decreased slightly. It is however clear from Table 1 that the
4 007 ha respectively. On the South Coast, Sezela plantings production area averages hide the change in cane area of
increased by 10 220 ha and Umzimkulu’s by 1 767 ha. The individual mills.
closing of Glendale (North Coast) and Entumeni (Tugela) mills Similar to small-scale growers, the number of large-scale
following the 2003/04 season, resulted in more cane delivered growers who delivered cane has decreased. Between 1996/97
(and area recorded) to Gledhow and Amatikulu respectively. and 2011/12 the number of large-scale growers dropped by
Gledhow’s area under cane again increased considerably after 366 or 22%. However, with Darnall moving to the North Coast
2008/09, but this is due to a number of Maidstone and Darnall region from the Tugela region in 2003/04, a comparison of
farmers delivering to the ‘new’ Gledhow mill which was partly the number of large scale growers in 2001/02 and 2011/12 is
bought by growers (25.1% grower ownership). This ‘move’ by somewhat misleading. Nevertheless, a comparison between
farmers subsequently resulted in a drop in area under cane 2003/04 and 2011/12 does reveal the trend . Over these eight
for the Maidstone and Darnall mills. Felixton is the only mill years 362 large-scale growers stopped farming sugarcane. Of
region where large-scale growers’ area under cane decreased this total, 66% came from the North Coast (26%), Zululand
considerably and where the drop is not clearly linked to closure (21%) and the Midlands (19%). It is hypothesised that a
of a mill or a large number of farmers delivering cane to a substantial amount of land on the North Coast and Zululand
different mill. Felixton’s large-scale growers area under cane has been sold to government under the land restitution and
increased with MCP land sell off in 1998 and the area remained redistribution programme, so a number of farmers sold to one
relatively stable until 2006/07 after which it decreased by 9 894 owner (the State). It is also possible that financially stronger
ha in 5 years up to 2011/12. It is thought that some Felixton farmers are buying up cane farms to cope with decreasing
cane went to the Umfolozi, Amatikulu and Gledhow mills, but margins and to expand production.
the increase in cane in these areas are too small to account By combining the area changes of MCP, small-scale growers
for the substantial decline in Felixton. Large-scale growers in and large-scale growers, it is possible to see the net effect for
the Felixton area indicated that the diversion from Felixton is each mill area:
linked to the mill’s untoward ‘Brix minus pol’ factor. This issue • In Mpumalanga, the area under cane for all three types of
will be discussed in more detail in Section 5.2. growers increased for Komatipoort, while Malelane showed
Though ‘moving’ of farmers between mills can complicate an increase in area for both small-scale growers and large-
comparisons and the choice of comparing seasons influence scale growers.
findings, the large-scale growers’ area under cane trends for • In Zululand, Pongola’s total area under cane increased
the different milling regions are clear from Figure 8. Midlands due to large-scale growers’ area expansion and despite
Figure 8: Large-scale farmer area under cane according to production regions (ha)
– 18 –Understanding the Factors that have Impacted on Cane Production in the South African Sugar Industry
Figure 9: Number of large-scale growers accrording to the different production regions
a 1 496 hectare decrease in small-scale growers’ cane. In • The total Midlands area under cane increased by 9 365 ha
the Umfolozi mill region, small-scale growers cane area due to a 21 684 ha increase by large-scale growers and a
decreased by nearly 2 000 ha while large-scale growers 7 407 ha drop by small-scale growers and 4 912 by MCP.
area increased by 889 ha. In Felixton all three grower Eston large-scale growers’ cane area increased by 9 246 ha,
groups decreased cane plantings with a total of 7 533 partly enabled by a 2 068 ha sell-off by MCP.
hectares going out of cane production. • In the South Coast production region, the total cane area
• In the Tugela production region the area under cane decreased by 5 219 ha as a result of the small-scale growers
decreased significantly. With the closing of the Entumeni area decreasing by 9 081 ha and the large-scale growers
mill following the 2003/04 season, most of the cane was area increasing by 11 987 - largely due to a 10 220 ha
registered under Amatikulu, but both small-scale growers’ increase of large-scale growers cane in Sezela, enabled by
and large-scale growers’ area decreased. In total small-scale a 8 105 ha sell-off of MCP cane land.
growers cane area decreased by more than 12 500 ha and When grouping the production decreasing, stable and
the large-scale growers by more than 4 200 ha with the increasing mill regions together (as was done for Figures 2, 3 and
total Tugela cane area decreasing by 16 777 ha. 4), it is clear that MCP and small-scale growers area under cane
• Though the closing of the Glendale mill following the decreases were more severe in the Coastal production regions
2003/04 season and the ‘moving’ of Darnall and Maidstone where milling companies owned more land and where most
farmers to Gledhow complicate area inferences, it is clear of the small-scale growers are situated. In total, Coastal area
that the North Coast area lost a large share of its cane land. under cane in Felixton, Amatikulu, Entumeni, Glendale, Darnall,
In total large-scale growers cane area increased by 737 Gledhow, Maidstone, Sezela and Umzimkulu decreased by 65
ha but MCP cane decreased by 20 327 ha and small-scale 794 ha while inland and irrigation cane produced in Malelane,
growers cane by 16 675 with North Coast mills losing more Komatipoort, Umfolozi, Pongola, Noodsberg, Eston and Union
than 36 000 ha of cane. Coop increased by 26 155 ha from 1996/97 to 2012/13.
– 19 –Understanding the Factors that have Impacted on Cane Production in the South African Sugar Industry
Figure 10: Total area under cane change for different milling regions (ha)
Figure 11: Area change comparing coastal and inland cane production regions (ha)
The total area under cane decreased by 39 639 ha from yields and that low yielding small-scale growers cane area has
1996/97 to 2012/13 but more recently by 57 163 ha from decreased, an increase in average yield would not have been
2000/01 to 2012/13. Given that the total cane production has unexpected. However, as the production – area under cane
decreased by nearly 28% or 6 675 619 tons from 23 876 164 disparity suggests cane yields did in fact decline.
tons of cane in 2000/01 to 17 200 545 in 2012/13 it would
seem as if the cane production decline is not only linked to 3.2 Yield
an area decrease but that a yield decrease also played a role,
i.e. cane production have decreased considerably more than In South Africa, and for most of the sugarcane production
what the area decrease accounts for. If one assumes that a sector, the main limiting factor to yield is rain. Depending on
large share of large-scale growers’ cane area that has gone out the climatic conditions and length of cropping season, sugar
of production, has been marginal land with relatively lower cane in South Africa requires between 1100 and 1500 mm
– 20 –Understanding the Factors that have Impacted on Cane Production in the South African Sugar Industry
Figure 12: Rainfall indications (June-May) for mill areas in main production regions (measured in mm)
Mpumalanga
a) Malelane b) Komatipoort
Zululand
c) Pongola d) Umfolozi
– 21 –Understanding the Factors that have Impacted on Cane Production in the South African Sugar Industry
Tugela
i) Felixton j) Amatikulu
North Coast
g) Darnall h) Maidstone
k) Gledhow
South Coast
j) Sezela k) Umzimkulu
– 22 –Understanding the Factors that have Impacted on Cane Production in the South African Sugar Industry
Midlands
l) Noodsberg m) Eston
Figure 13 a-m: Cane yield in tons of cane per harvested area and RV tons per harvested area
of rainfall for near-optimal yield. It is clear from the 1995/96 growers’ production per hectare decreasing by 2.19% per year
– 2011/12 rainfall indications for selected mill regions, here and small-scale growers cane yield by 2.62%. In Zululand less
representing the different production areas, that precipitation than ideal weather conditions resulted in a simulated lower
levels for 2003/04-2005/06 and again 2008/09-2010/11 were yield of 0.89% per year, but small-scale growers’ yield decreased
far from ideal (Figure 12). According to rainfall data obtained by 4.22% per year and large-scale growers yield by 1.73%.
from an Umzimkulu farmer, nine out of the thirteen seasons Overall, large-scale growers’ cane yield decreased by
2000-2012 had rainfall lower than the long term average and 1.07% per year and small-scale growers yield by 2.48%. These
in 6 seasons less than 700mm were recorded for the June-May are average figures and it can be expected that there are
period. substantial variation within mill regions with some farmers’
Making use of CANEGROWERS’ production and area under yields decreasing considerably more or actually increasing, but
cane data, mill region specific rainfall data and the SASRI it is quite apparent that yields decreased considerably more in
Canesim model, and assuming best ratoon, fallowing and Coastal regions. In the nine years 2001-2010 South Coast large-
soil nutrition practises, Jones (2013) showed that during the scale growers’ yield decreased by more than 11%; on the North
2000/01-2009/10 period actual cane yields decreased even Coast ’ yield dropped by nearly 20% and in Zululand by nearly
though the simulation model indicates that the climatic yield 16%. Zululand small-scale growers yield decreased by nearly
potential has increased in some areas. Actual yield decreases 38% for the same period while North Coast yield dropped by
were significant and of a magnitude greater than can be 23.6% for smallholders.
explained by weather variations, especially in the North Coast, An issue that might have played a role in the decreasing
South Coast and Zululand production regions. Figures 13 a-m trend in aggregate large-scale growers yields is the fact that
graphically present the yield trends in cane tons and RV tons a substantial number of former MCP land has been sold to
per area harvested for the period 2000/01 to 2011/12. previously disadvantaged farmers and these now form part of
Despite the Canesim model suggesting that, based on the large-scale growers group. Some of these farms may not
climatic conditions and assumed best practises, cane yield be managed optimally (for various reasons), resulting in lower
would increase by 0.99% per annum on the South Coast, large- cane yields with a negative impact on the average large-scale
scale growers’ yield decreased by 1.24% per annum and small- grower group yield. However, in a survey of approximately 80
scale growers’ yield by 0.39% per annum. Midlands yield was large scale growers, Jones (2013) found that the most farmers
predicted to increase by 1.48% per year but decreased by 0.60% (94%) believed that yields are decreasing on their own farms
for large-scale growers and 0.30% for small-scale growers. and this was also found by the BFAP team in farmer group
North Coast farmers’ yield decreased the most with large-scale discussions.
Table 2: Simulated and actual yield change per year for large-scale growers and small-scale growers for 2001 to 2010 (%)
Region Simulated yield change Actual large-scale growers Actual small-scale growers
per year yield change per year yield change per year
South Coast 0.99 -1.24 -0.39
Midlands 1.48 -0.60 -0.30
North Coast -0.06 -2.19 -2.62
Zululand -0.84 -1.73 -4.22
Northern Irrigated -0.89 -0.17 -3.21
All regions 0.04 -1.07 -2.48
Source: Adapted from Jones (2013)
– 23 –Understanding the Factors that have Impacted on Cane Production in the South African Sugar Industry
4 Factors affecting area and yield Immature cane has more non-sucrose sugars and as a
The main objective of the meetings with large-scale growers in result coastal farmers are penalised under the RV payment
July/Aug was to identify the issues that impacted on cane area system and receive a lower income for their cane. If they
and yield over the period 2000/01 to 2011/12. In order to elicit were able to get rid of Eldana, they can produce high RV
some pre-meeting deliberation and guide the discussions an 14 month cane and spend less on insecticides, resulting in
informal questionnaire was circulated to farmers beforehand. higher profits.
Typical to the focus group discussion method of consultation, • Large-scale growers feel that the considerable drop in
some of the feedback and issues indicated by farmers might small-scale grower numbers and cane area is to a large
be considered as subjective and anecdotal. Some of these degree due to the RV payment system. It is very difficult for
issues however speak to the general state of production and small-scale growers, who are dependent on profit driven
mind of growers and deserve mention. The issues identified by contractors, to supply ’clean and fresh’ cane, and as a result
farmers are presented in the next section and the main issues small-scale growers receive less income for their cane.
are then discussed in detail and substantiated and analysed • In the 70s about 30% of Darnall farmers burnt and 70%
based on CANEGROWERS, BFAP and other credible data. trashed their cane. Now, due to high labour cost, Eldana
and the fact that they are penalised for fibre content, about
4.1 Large-scale grower indicated factors affecting cane 90% burn their cane before harvesting. The same is true
area and yield for Gledhow and Maidstone farmers. Because they are no
Most farmers indicated that profitability, which is a factor of longer trashing, the organic material in the soil is minimal,
yield, drives the change in area under cane, as area under cane causing nutrition and compacting problems. They know
depends on the grower’s replanting decision. Interestingly, trashing has longer term benefits but cannot afford to trash
though farmers in different mill regions generally indicated due to high labour cost and the fibre content issue under
the same issues, the factors that were indicated as most the RV payment system.
important, differed. This section will present farmers’ feedback • Due to increasing input costs, farmers are not able to invest
on the factors affecting the area under cane and cane yield in soil health, nutrition (fertiliser and lime) and seed cane.
and includes some candid farmer insights on cane production • The North Coast has pockets of good soil, but consists
and the sugar industry. The section concludes with a summary mostly of marginal soils and steep hills. Marginal soil
of the main factors to be comprehensively assessed in the requires more inputs to attain a reasonable yield under the
subsequent sections of this report. RV system. Under low rainfall conditions and high input
prices the Coastal regions are the first to struggle.
4.1.1 North Coast – Darnall, Gledhow and Maidstone • A number of farmers have ‘stopped farming’ due to land
Factors impacting on cane area: claims, i.e. stopped investing in the health of their soil and
• Cane produced in the Darnall and Maidstone areas has in cane replanting, resulting in yield declines.
reality not decreased much – the observed decrease is due • They indicated that the SUSfarm (best practise) guidelines
to a number of farmers now delivering to the partly grower published by SASRI are a far cry from what they currently
owned Gledhow mill. do and what they can afford to do.
• Some cane land is now planted to macadamias, but • The Gledhow farmers are positive about their miller
generally coastal farmers have few crop alternatives. relationship as they have insight into the financials of the
• Though there are a couple of cane growers who mill. Darnall and Maidstone farmers are not that happy but
have property development plans, most of the urban since the farmer exodus to Gledhow their mills seem more
development in the region (encroaching on cane land) is willing to negotiate.
driven by Tongaat Hulett.
• With decreasing margins, struggling farmers should be 4.1.2 South Coast – Sezela and Umzimkulu
bought out by better performing farmers but even marginal Factors impacting on cane area:
land on the coast is very expensive due to development • Sezela has about 70% of cane on the coast on a 12
possibilities. month cycle while 30% of cane is inland on a 20 month
• Due to the land restitution and redistribution programme, cycle. Umzimkulu has about 30% cane on the coast and
productive government-bought land is removed from the 70% inland (hinterland). Umzimkulu inland farmers are
market (decreasing supply), resulting in high prices for remarkably more positive about cane farming than coastal
even marginal land. farmers.
• Expansion for both areas is mainly inland but is limited by
Factors impacting on cane yield: other more profitable crops such as macadamias, timber
• Farmers felt that new cane varieties are bred for RV and not and bananas. The main expansion limitation is distance
for cane tons per hectare. from the mill, i.e. transport cost.
• RV focused varieties have less legs – can only be ratooned a • Coastal cane growers have limited options due to sloping
couple of years before yield drops. lands.
• Due to Eldana, coastal farmers are forced to cut immature • Urban development and the low profitability level of cane
cane at 12 months instead of mature cane at 14 months. production limits cane expansion on the coast.
– 24 –Understanding the Factors that have Impacted on Cane Production in the South African Sugar Industry
• More cane area will go out of production on the coast as it • Low rainfall has played a massive role the last 10 years. With
is too expensive to plant and harvest on the steep slopes a dry season, the yield is low and farmers cannot afford to
due to the labour component. invest in soil health. Next season is dry again, and then the
• Farming units are getting bigger (number of farmers fewer). grower has the problem of low rainfall and depleted and
acidic soils.
Factors impacting on cane yield: • They are not positive about their relationship with the mills.
• Under the RV payment system farmers need to age their
cane in order to increase sucrose content and minimise 4.1.3 Zululand and Tugela – Umfolozi, Felixton and
non-sucrose sugars, but due to Eldana they are forced Amatikulu
to harvest immature cane. They have tried a number of
methods to control Eldana, but with little success and have For this region, Felixton and Amatikulu farmers generally had
to apply chemicals quite extensively. Eldana is a problem similar responses while Umfolozi farmer indications were
especially in the older cane fields where there has been different.
nothing but cane for a number of seasons.
• The SUSfarm guidelines recommend trashing at harvesting Umfolozi
but the RV system penalises farmers for trashing via the Factors impacting on cane area:
fibre content penalty. • The Umfolozi Flats had very little decline in area, only some
• They know they need to trash but cannot afford the labour hilly farms were bought up by timber companies and
and lower RV% - they need to find a solution. Trashing is no converted to forestry.
silver bullet, but it is a good start.
• They cannot financially afford to adopt SUSfarm practises, Factors impacting on cane yield:
but also know that they cannot afford not to. They feel that • By replanting 10% they manage to keep yields high.
the mills should reward best management practises – they • Growers own 75% of the mill and get 25% of the value of
need mill support to implement SUSfarm practises to the molasses and are positive about their relationship with the mill
longer term benefit of farmers and mills. • These farmers are also much more positive about cane
• They feel that they should stop planting marginal lands to farming than South Coast, North Coast and Felixton and
cane but cannot afford to produce less cane. Amatikulu farmers.
• They need to break the cycle of mono-cropping and leave
more land fallow, but cannot afford to. Felixton and Amatikulu
• They feel SASRI’s focus the last number of years was on Factors impacting on cane area:
producing sugar and not on producing cane. • For these farmers the main issue is decreased profitability
• Newer cane varieties do well but do not last. caused by the RV payment system.
• They recognise that the Bell loader has had a massive impact • One big grower’s deliveries at Felixton inflates the mill’s
on compacting cane fields and ratoon root damage, resulting cane area figures – they are actually doing considerably
in yield loss. Some farmers are moving away from Bell loaders. worse.
• Land claims play a big role in this area and influence how • Nearly 70% of all SA small-scale growers are in Felixton,
and if farmers implement SUSfarm recommendations as Amatikulu and Umfolozi - the RV payment systems’ negative
well as farmers’ replanting decisions. Most of the claims in impact on small-scale growers has been massive.
the Sezela area have already been settled. In Umzimkulu • They feel the RV price has not kept up with the increase in
about 50% of farms are under claim and this has definitely input prices resulting in decreasing profitability.
influenced farmers’ investment decisions. • Felixton farmers have a major concern regarding their mill’s
• Farmers seem to know how to “fix” their soils but it is a high Brix-pol factor resulting in them being penalised under
longer term project and they cannot afford to invest into the RV payment system for what they believe is a milling
something they will not have the benefit of. At this stage process problem. Farmers with delivery options have left
the farmers with claims on their land can only plan 2 years the Felixton mill as the Brix-pol issue results in farmers’ cane
in advance. being undervalued. The Brix-pol issue was not a problem
• Land claims are a very big issue and the negative sentiment for growers under the sucrose payment system.
has been worsened by the droughts of the last 10 years.
• These farmers feel that there is no trust in the industry. They Factors impacting on cane yield:
are tired of fighting with government, the mill, Eldana and • A number of issues including age of ratoon, Eldana, soil
droughts and this influences their reinvestment decisions. health, labour cost and ‘lack of legs’ of the new varieties
• Farmers feel that they are not getting their fair share of played a role, but they feel that all of these were caused
molasses value. and exacerbated by the RV payment system.
• They indicate that SASRI has not been supplying the • They feel the RV payment system had a number of
correct lime and gypsum recommendations and as a result ‘unintended consequences’ that negatively impacted on
they have big soil acidity problems. The recommendations their production systems.
have been revised but it will take time and money to fix the • They cannot afford to implement SUSfarm best farming
problem. practices.
– 25 –You can also read