Navigating a Challenging Recovery - Philippines Economic Update JUNE 2021 EDITION - World Bank Document
←
→
Page content transcription
If your browser does not render page correctly, please read the page content below

Public Disclosure Authorized
Public Disclosure Authorized

                               Philippines Economic Update
Public Disclosure Authorized

                               JUNE 2021 EDITION
                               Navigating a
                               Challenging Recovery
Public Disclosure Authorized

                                                             PHILIPPINES ECONOMIC UPDATE JUNE 2021 EDITION   1
PHILIPPINES ECONOMIC UPDATE JUNE 2021 EDITION I
Preface

The Philippines Economic Update (PEU) summarizes key economic and social developments, important policy changes,
and the evolution of external conditions over the past six months. It also presents findings from recent World Bank analyses,
situating them in the context of the country’s long-term development trends and assessing their implications for the country’s
medium-term economic outlook. The update covers issues ranging from macroeconomic management and financial-market
dynamics to the complex challenges of poverty reduction and social development. It is intended to serve the needs of a wide
audience, including policymakers, business leaders, private firms and investors, and analysts and professionals engaged in the
social and economic development of the Philippines.

The PEU is a biannual publication of the World Bank’s Macroeconomics, Trade, and Investment (MTI) Global Practice (GP),
prepared in partnership with the Finance, Competitiveness and Innovation (FCI); Poverty and Equity; Social Protection and Jobs
(SPJ); and Governance Global Practices. Lars Christian Moller (Practice Manager for the MTI GP), Souleymane Coulibaly (Lead
Economist and Program Leader), and Rong Qian (Senior Economist) guided the preparation of this edition. The team consisted
of Kevin Chua (Senior Economist), Kevin Cruz (Economist), Karen Lazaro (Research Analyst), Eduard Santos and Ludigil Garces
(Consultants) from the MTI GP, Isaku Endo (Senior Financial Sector Specialist) and Heejin Lee (Private Sector Specialist) from the
FCI GP, Nadia Belghith (Senior Economist) and Sharon Piza (Economist) from the Poverty & Equity GP, Yoonyoung Cho (Senior
Economist), Ruth Rodriguez (Social Protection Specialist), and Arianna Zapanta (Consultant) from the SPJ GP, and Ronald Mutasa
(Program Leader), Ramana Gandham (Consultant), Ekaterina Vashakmadze (Senior Economist), and Ergys Islamaj (Senior
Economist). Kevin Cruz, Karen Lazaro, Cha Crisostomo (Consultant), and Eduard Santos prepared the Special Focus Note
on the Local Public Service Delivery in the Context of the Mandanas Ruling with inputs from Ahya Ihsan (Senior Economist),
Blane Lewis (Consultant), Eli Weiss (Senior Agriculture Economist), and Lewis Hawke (Lead Public Sector Specialist), and under
the guidance of Rong Qian, Madhu Raghunath (Sector Leader), and Lewis Hawke. The report was edited by Oscar Parlback
(Consultant), and the graphic designer was Pol Villanueva (Consultant). Peer reviewers were Yue Man Lee (Senior Economist),
Chadi Bou Habib (Lead Economist), and Kai Kaiser (Senior Economist). Logistics and publication support were provided by
Elysse Miranda (Team Assistant) and Kristiana Rosario (Team Assistant). The Manila External Communications Team, consisting
of Clarissa David (Senior Communications Officer) and David Llorito (Communications Officer), prepared the media release and
web-based multimedia presentation, and Stephanie Margallo provided team assistance.

The team would like to thank Ndiame Diop (Country Director for Brunei, Malaysia, Philippines, and Thailand) for his advice and
support. The report benefited from the recommendations and feedback of various stakeholders in the World Bank as well as
from the government, the business community, labor associations, academic institutions, and civil society. The team is grateful
for their contributions and perspectives. The findings, interpretations, and conclusions expressed in the PEU are those of the
authors and do not necessarily reflect the views of the World Bank’s executive board or any national government.

If you wish to be included in the email distribution list for the PEU and related publications, please contact Elysse
Miranda (emiranda2@worldbank.org). For questions and comments regarding the content of this publication, please
contact Mr. Kevin Chua (kchua1@worldbank.org). Questions from the media should be addressed to David Llorito
(dllorito@worldbank.org).

For more information about the World Bank and its activities in the Philippines, please visit www.worldbank.org/ph.

                                                                                      PHILIPPINES ECONOMIC UPDATE JUNE 2021 EDITION   II
Table of Contents
Preface                                                                                                       II
Table of Contents												                                                                                III
List of figures                                                                                             IV
List of tables                                                                                                V
List of boxes                                                                                                 V
Abbreviations and acronyms                                                                                  VI
Executive Summary                                                                                           VII
Part I.         Recent Economic and Policy Developments                                                       1
1.1        Economic Growth: Cost of Containment                                                               2
1.2        The Exchange Rate and the External Sector: Stable Peso Amid Recovery                               6
1.3        Inflation and Monetary Policy: Accommodative Policy Amid Rising Inflation                        10
1.4        Fiscal Policy: Balancing Support and Sustainability                                              14
1.5        Employment and Poverty: Rise of Low-Paying Jobs Despite Labor Market Rebound                     15
Part II.        Outlook and Risks                                                                           17
2.1        Growth Outlook                                                                                   18
2.2        Poverty and Shared Prosperity                                                                    27
2.3        Risks and Policy Challenges                                                                      28
Part III.       Understanding the Fiscal Impact of the Mandanas Ruling                                      30
3.1        Revisiting Decentralization in the Philippines                                                   31
3.2        Unfulfilled Promise of Decentralization                                                          34
3.3        The Mandanas Ruling: Policy Challenges and Initial Response                                      37
3.4        Potential Fiscal Impact of the Mandanas Ruling                                                   38
3.5        Policy Recommendations                                                                           45
Annex 1:        Methodology in Estimating Post-Mandanas Budget Execution Rates                              50
References                                                                                                  51

                                                            PHILIPPINES ECONOMIC UPDATE JUNE 2021 EDITION    III
List of figures

Figure 1. The Economy contracted for the fifth consecutive quarter.							                                                   2
Figure 2. The contraction was broad-based.										                                                                         2
Figure 3. The global economy contracted 4.3 percent in 2020.								                                                         4
Figure 4. The global trade in goods has returned to December 2019 levels.
Figure 5. From mostly sharp contractions throughout 2020, both imports and exports of goods indicate recovery in early 2021 7
Figure 6. The contraction in FDI was less pronounced in the Philippines than in many other regional peers in 2020.		7
Figure 7. Across key sectors, the FDI regulatory framework is more restrictive in the Philippines than in regional peers.    8
Figure 8. The financial system appears to have adequate capital buffers.						                                              11
Figure 9. NPLs remain manageable but asset quality needs close monitoring.					                                             11
Figure 10. Firms experiencing financial constraints (% firms).							                                                       12
Figure 11. Absolute Change in Nominal Credit Growth in Select EAP countries January 2020 Latest available
           month (percentage points).                                                                                      12
Figure 12. Inflation breached the BSP’s target range in the first three months of 2021.				                                13
Figure 13. The past-due loans ratio and the share of non-performing loans rose.					                                        13
Figure 14. The fiscal deficit reached a record high in 2020 amid a sharp rise in public spending.			                        14
Figure 15. The debt-to-GDP ratio rose to its highest level since 2006.							                                               14
Figure 16. Labor Force Participation Rate, January 2018–March 2021.							                                                  15
Figure 17. Unemployment and Underemployment Rates, January 2018–March 2021.					                                            15
Figure 18. Economic growth is expected to recover in the medium term.							                                                18
Figure 19. Consumer sentiments remained in negative territory in early 2021.						                                          18
Figure 20. Regional comparison of vaccine doses administered per 100 people.						                                         20
Figure 21. Cumulative vaccine doses administered per 100 people.							                                                    20
Figure 22. While the global economy is expected to grow by 4.0 percent in 2021, …					                                     23
Figure 23. … there are downside risks to the projections.								                                                          23
Figure 24. The Philippines may benefit from an increase in exports to the US and other advanced economies.			              26
Figure 25. Faster global growth could lead to an increase in overseas remittance inflows.					                             26
Figure 26. Actual and projected $3.20-a-day povery rates (%)								                                                       27
Figure 27. Despite devolution, public spending remains heavily centralized in the Philippines…				                          31
Figure 28. …even for heavily devolved sectors such as health and economic services.					                                    31
Figure 29. The Mandanas Ruling will lead to a sharp increase in Internal Revenue Allotment allocations…			33
Figure 30. … which is projected to increase the share of Internal Revenue Allotment in 2022.				                           33
Figure 31. Spending on general public services represents the largest share of local government budgets.			35
Figure 32. Poorer local governments need to allocate a larger share of their budgets to general services.			35
Figure 33. Following devolution, there has been a mismatch between local governments’ ability to generate own
            revenues and their expenditure responsibilities.                                                               35
Figure 34. Local governments in the Philippines rely on intergovernmental transfers to bridge the fiscal gap,
            similar to other countries.                                                                                    35
Figure35. City governments are less dependent on the Internal Revenue Allotment than their provincial and
            municipal counterparts.                                                                                        35
Figure 36. Poorer local governments are almost solely reliant on the Internal Revenue Allotment to finance spending.       35
Figure 37. The size of the budget is one of the key drivers of budget execution among local government units.		            38
Figure 38. The execution of capital outlays is far lower than that of recurrent spending.					                             39
Figure 39. A higher share of the capital outlays is associated with lower budget execution rates (ER) regardless of sector…39
Figure 40. …a trend also observed across local government levels.							                                                   39
Figure 41. Change in budget, capital outlay share, and execution rates under Case 1					                                    41
Figure 42. Change in budget, capital outlay share, and execution rates under Case 2					                                    41
Figure 43. Budget execution is expected to fall post-Mandanas Ruling, as the share of capital outlays rise.			42
Figure 44. Existing vertical imbalances among local government units are likely to widen with the implementation
           of the Mandanas Ruling.										 43
Figure 45. Internal Revenue Allotments are expected to represent an even larger share of local government

                                                                                 PHILIPPINES ECONOMIC UPDATE JUNE 2021 EDITION   IV
units’ total revenues following the Mandanas Ruling. 						                                                          44
Figure 46. The horizontal gap between the spending per capita of rich and poor local governments
           is expected to persist post-Mandanas.								                                                                         44

List of tables

Table 1. Balance of Payments, 2016–2020                                                                                           7
Table 2. Foreign Equity Limits on FDI among ASEAN Countries.                                                                      8
Table 3. Economic Indicators for the Baseline Projections.                                                                       22
Table 4. Real Growth Projections.                                                                                                24
Table A1. Estimating elasticities of total budget on total revenue using ordinary least squares regression		                     50
Table A2. Estimating elasticities of total budget execution rate on capital outlay budget share using
          ordinary least squares regression 									                                                                            50

List of boxes

Box 1. Recent Global Developments                                                                                                  4
Box 2. Foreign Direct Investment Restrictiveness in the Philippines                                                                8
Box 3. Recent Developments in the Financial System                                                                                11
Box 4. The Impacts of COVID-19 Vaccination on the Economy Match its Impacts on Public Health                                     20
Box 5. Global Economic Outlook                                                                                                   23
Box 6. Spillover to the Philippines from the U.S. Fiscal Stimulus                                                                25
Box 7. The 1991 Local Government Code.                                                                                           32
Box 8. Case Studies of Select local government units focusing on key drivers of budget execution                                 40
Box 9. Local Infrastructure Project Implementation Challenges                                                                    43
Box 10. The Philippine Rural Development Program: A model for Capacity Building                                                  47
Box 11. Impact of the Government Responses to the Mandanas Ruling in BARMM                                                       48

                                                                                 PHILIPPINES ECONOMIC UPDATE JUNE 2021 EDITION    V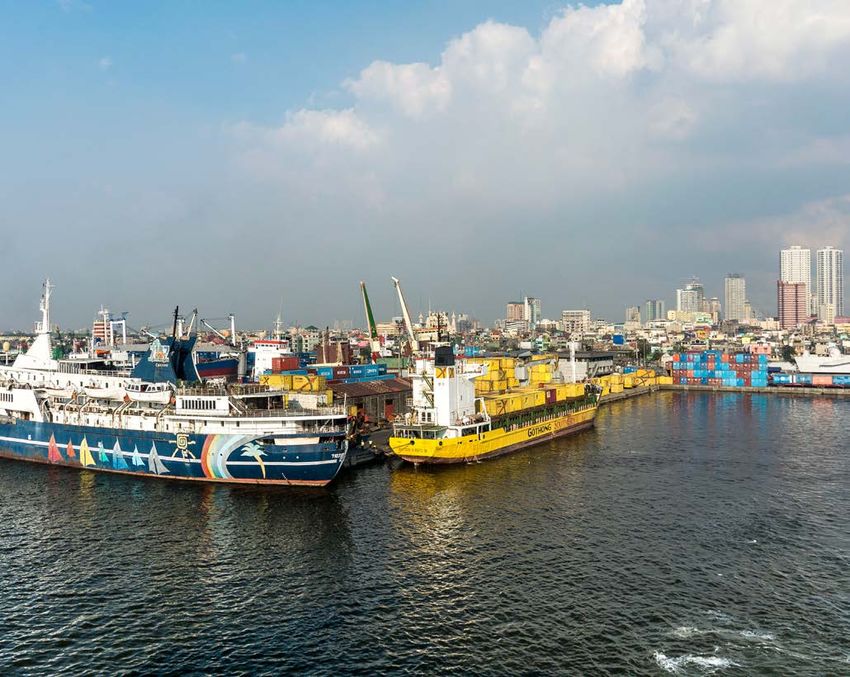
Abbreviations and acronyms

ACT			     Access to COVID-19 Tools         FPI			   Foreign portfolio investments
ASEAN 		   Association of Southeast         FSI   		Financial soundness
Asian 		Nations                             			indicators
ASF			     African swine fever              FSSA			  Financial system stability
BARMM 		Bangsamoro Autonomous               			assessment
			        Region in Muslim Mindanao        GDP   		 Gross domestic product
BLGF			    Bureau of Local Government       GOP			   Government of the
			Finance                                  			Philippines
BOP			     Balance of payments              GPS			   General public services
BPO			     Business process outsourcing     IIF			   Institute of International
BSP			     Bangko Sentral ng Pilipinas      			Finance
CAR    		  Capital adequacy ratio           IMF			   International Monetary Fund
CDPs			    Community development plans      IRA			   Internal revenue allotment
CEPI			    Coalition for Epidemic           LFPR  		 Labor force participation rate
			Preparedness Innovations                 LFS			   Labor force survey
CIT			     Corporate income tax             LGC			   Local government code
CLUP			    Comprehensive land use plan      LGUs			  Local government units
COA    		  Commission on Audit              MOOE 		  Maintenance and other
COs			Capital outlays                       			operating expenses
COVAX 		   COVID-19 Vaccines Global 		      NDVP			  National deployment and
			Access                                   			vaccination plan
COVID-19		 Coronavirus disease 2019         NEDA 		  National Economic and
CREATE 		  Corporate Recovery and Tax       			Development Authority
			        Incentives for Enterprises Act   NG			National government
DA			      Department of Agriculture        NGAs			National government
DBM    		  Department of Budget and 		      			agencies
			Management                               NHA   		 National Housing Authority
DILG   		  Department of the Interior 		    NPL			Non-performing loans
			and Local Government                     OECD 		  Organisation for Economic
DOF			     Department of Finance            		       Cooperation and
DOH    		  Department of Health              			Development
DPWH			    Departments of Public Works      OFWs 		  Overseas Filipino workers
			and Highways                             PCIP			Provincial commodity
DTP    		  Devolution transition plans      			investment plans
EAP			     East Asia and the Pacific        PMI			   Purchasing Managers’ Index
ECQ    		Enhanced community                 PRDP			  Philippine Rural Development
			quarantine                               			Project
EMDEs 		   Emerging market and              PS			Personnel services
			developing economies                     PSA			   Philippine Statistics Authority
EO			Executive order                        RTLA			  Retail Trade Liberalization Act
ERs			     Budget execution rates           U.S.			United States
FDI			     Foreign direct investment        UNCTAD   United Nations Conference
FIA			     Foreign Investment Act           			      on Trade and Development
FINL			Foreign investment                   WHO			   World Health Organization
			negative list

                                                      PHILIPPINES ECONOMIC UPDATE JUNE 2021 EDITION   VI
Executive Summary

Recent Developments

The resurgence of COVID-19 cases and reimposition                   The central bank continues to be accommodative despite
of more stringent quarantine measures held back the                 inflation breaching the target range. The Bangko Sentral
early signs of an economic rebound. The downside                    ng Pilipinas (BSP) maintained its key policy rate at 2.0
risk of a resurgence of infection, identified in the PEU            percent throughout the first four months of 2021 to support
December 2020 edition, has unfortunately materialized.              the economic recovery. This is despite headline inflation
The number of daily cases increased from an average of              averaging 4.5 percent in the first four months, breaching
1,400 in December 2020 to nearly 10,000 in April 2021. The          the 2-4 percent inflation target range. Elevated food prices
surging cases prompted the authorities to reimpose stricter         were caused by harvest losses due to typhoons in end-
quarantine measures in Metro Manila and nearby provinces            2020, and lower pork supply due to a disease outbreak.
for more than one-and-a-half months between April and               Stable core inflation and supply-driven price pressure
May. Since then, daily cases have gone down gradually               solidified the view that the uptick in inflation is transitory.
and critical care occupancy rates have eased. However,              In addition to keeping the key policy rate steady, the BSP
the quarantine and movement restrictions have hampered              has previously engaged in open market operations, and
people’s mobility, adversely affecting domestic activity.           continued the implementation of regulatory measures to
                                                                    minimize the economic fallout of the pandemic, suchas the
The economy contracted by 4.2 percent year-on-year in               zero percent risk weight for the guaranteed loans of micro,
the first quarter of 2021 amid prolonged implementation             small, and medium-sized enterprises,and the fee waivers for
of containment measures. The country registered the                 fund transfer transactions through the BSP’s payment and
worst growth performance among peers in the region                  settlement system.
such as Thailand (-2.6 percent), Indonesia (-0.7 percent),
Malaysia (-0.5 percent), and Vietnam (4.5 percent). The             Despite signs of a labor market recovery in the first
growth contraction was fueled by weak domestic demand,              quarter of 2021, the quality of jobs is of concern. The labor
driven by the combination of containment measures, weak             force participation rate reached 65.0 percent in March 2021,
confidence, and rising inflation. Meanwhile, tepid external         surpassing the pre-pandemic level of 61.7 percent in January
demand was driven by the sharp contraction in services              2020 and peaking to its highest level since January 2018.
exports amid lingering restrictions and weak demand                 Notwithstanding the increasing number of workers in the
for international tourism while goods exports recovered.            labor force, the unemployment rate decreased to 7.1 percent
The public sector was the main driver of growth with an             in March 2021 after remaining steady at 8.7-8.8 percent in
expansionary budget.                                                the past five months. Among the employed, however, there
                                                                    was an increase in the share of self-employed and non-paid
The authorities are supporting the economic recovery                workers, while the share of part-time workers remained
by accelerating public spending. Stimulus spending and              significantly higher than the pre-pandemic level. Likewise,
infrastructure investment drove public spending from 19.1           the underemployment rate remained at around 16-18 percent
percent of GDP in the first quarter of 2020 to 23.4 percent         in the first quarter of 2021, higher than the pre-pandemic
of GDP in the same period in 2021. The spending is in               level.
line with the continuing implementation of the pandemic
response measures under the “Bayanihan to Recover as                Outlook and Risks
One” Law (Bayanihan 2) which was extended to June 30,
2021. The higher spending comes at a time when public               The growth prospects hinge on the country’s ability
revenues fell from 17.2 percent of GDP in the first quarter of      to manage the COVID-19 health crisis. The medium-
2020 to 16.0 percent of GDP in the same period in 2021.             term growth trajectory depends on effective pandemic
This resulted in an increase in the fiscal deficit to 7.4 percent   containment, delivery of mass vaccination, and further
of GDP in the first quarter of 2021 from 1.9 percent of GDP         loosening of mobility restrictions. The sudden surge in
a year ago. The widening deficit was accompanied by an              COVID-19 cases in March-April 2021 showed the difficult
increase in the public debt ratio from 54.5 percent of GDP          challenge at hand. While mass vaccination began in March,
by end-2020 to 60.4 percent of GDP as of end-March 2021.            global vaccine supply constraints and vaccine hesitancy

                                                                                      PHILIPPINES ECONOMIC UPDATE JUNE 2021 EDITION   VII
among Filipinos may delay widespread local inoculation.           Filipinos to get vaccinated.
Following the government’s vaccination plans, the growth
projection assumes that vaccination will accelerate in            The effective delivery of social protection programs will
the second half of 2021 with the arrival of more vaccine          help to reduce the extent to which the crisis adversely
supplies.. Consequently, domestic demand is expected to           affects long-term human capital accumulation. COVID-19
gradually pick up this year, before accelerating in 2022.         pandemic-related shocks, including hunger incidences, have
                                                                  manifested in higher levels of child malnutrition, especially
The economy is projected to expand at 4.7 percent in              among the poor. It is important to reduce the extent of these
2021, before accelerating to 5.9 percent in 2022 and              losses, and mitigate the shocks from resulting in a persistent
6.0 percent in 2023. The recovery is anchored on an               impact on wellbeing and future economic opportunities.
anticipated global rebound, including in the country’s            Social programs, including cash transfers, can help alleviate
key trading partners. This will translate into higher export      food and subsistence conditions. However, moving swiftly
demand and better prospect of remittances. Domestically, as       to provide transfers and support to poor households will
vaccination efforts progress and the rate of infection slows,     require an improvement in the government’s delivery and
consumer and business confidence will gradually improve           implementation capacity. National and local government
and normalize. The administration’s continued commitment          authorities need to coordinate their efforts to ensure timely
to delivering infrastructure projects will contribute to public   and efficient deployment of public programs.
investment growth. However, market uncertainty and weaker
lending activities may temper private investment. Following       Mobilizing private sector participation in public
the deep contraction in 2020, a base effect will also             infrastructure projects will be important as the
contribute to increased growth in 2021, while the national        government faces limited fiscal space in the short term.
election is projected to boost economic activity in 2022 as it    The public financing needs will remain elevated as public
has done in previous election cycles.                             revenues are tempered by the weak economy while public
                                                                  expenditures increase to address the pandemic. The
Growth prospects are subject to significant downside              limited fiscal space will compel the authorities to pursue
risks. A resurgence of infection due to the entry of new          fiscal consolidation in the medium term. The government’s
virus variants is the most significant risk, which may yet        infrastructure investment agenda will strongly benefit from
overwhelm the healthcare system. Scaling up testing,              greater private sector participation through a renewed focus
tracing, isolation, and treatment measures, along with the        on public-private partnership, for which the country has
rollout of the vaccination program are key to the public          successful experience. Part of the formula s relaxing foreign
health response. However, tight global production supply          direct investment (FDI) restrictions. Regulations related to
and vaccine nationalism risk delaying the arrival of vaccines.    foreign investments remain restrictive in the Philippines.
Failure to effectively contain the virus or implement the         The Philippines faces even tighter competition, as some
mass vaccination program may extend mobility restrictions,        regional peers also recently implemented various incentives
which could lead to further job and income losses, disrupt        to attract investors. The passage of three investment reform
businesses, and delay economic recovery. There are also           bills: Public Service Act, Retail Trade Liberalization Act, and
external risks including the risk of a slower-than-expected       the Foreign Investment Act, will help improve the country’s
global recovery, disruptions in international logistics and       competitiveness in the region.
global value chains, and trade protectionism.
                                                                  Special Focus: Subnational Finance
The key health policy response remains the management
of the virus spread, complemented with the roll out of            The authorities need to prudently manage institutional
the vaccination program. Public health protocols such as          changes including the implementation of the Mandanas
mask wearing and physical distancing remain the first line of     Ruling in 2022. The Mandanas Ruling will raise Internal
defense to manage the spread of the virus specially as case       Revenue Allotment transfers to LGUs by 55 percent in
numbers remain elevated. Testing, tracing, isolation and case     2022, reaching Php1.08 trillion (4.8 percent of GDP) from 3.5
management have to be scaled up, along with expedient roll        percent of GDP in 2021. The substantial increase in transfers
out of vaccines. The vaccination program requires stringent       has prompted the national government to rethink its
planning, effective implementation, and more importantly,         approach towards decentralization, which remains below its
seamless coordination between the national government, local      potential for effective service delivery. The implementation
government units (LGUs), and the private sector. As vaccine       of the Ruling comes at a time of limited fiscal space.
hesitancy remains high, the authorities may consider dialogue-    Moreover, the Philippines’ experience in decentralization has
based or incentives-based interventions to encourage more         demonstrated significant gaps in the effectiveness of local

                                                                                      PHILIPPINES ECONOMIC UPDATE JUNE 2021 EDITION   VIII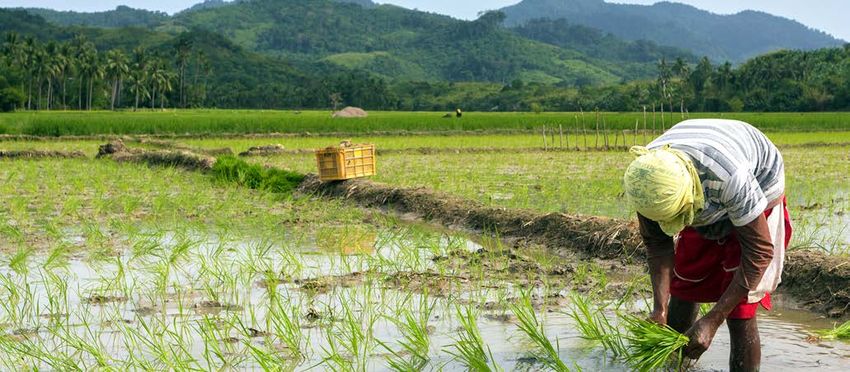
public service delivery.                                         and quantity of service delivery. Lastly, the mechanisms
                                                                 for holding local chief executives accountable for
Effective service delivery has been constrained by four          performance are weak and frequently ineffective.
structural challenges that have negatively affected the
incentives and capacity of local governments to fulfill          Overcoming the structural challenges while managing
their primary role as basic service providers. First, LGUs       the transition towards increased decentralization
collect insufficient revenues and this contributes to a          require the following: (i) address horizontal inequity
mismatch given service delivery responsibilities. Second, the    through strong fiscal equalization; (ii) provide capacity
intergovernmental fiscal transfer system creates horizontal      building support to LGUs; and (iii) create an environment
fiscal imbalances and inequality across local governments.       of increased demand for transparency and accountability.
Third, overlapping service delivery responsibilities across      In the short-term, addressing the implementation
different levels of government diffuse accountability. Fourth,   challenges due to the Mandanas Ruling requires
LGUs continue to depend on national government for the           immediate clarification on the re-devolved functions, and
delivery of devolved public services due to the lack of          communicating these clearly to national government
technical capacity.                                              agencies and LGUs. In the medium-term, the national
                                                                 government must provide strong fiscal equalization
In addition to these structural weaknesses, the                  by continuing to support LGUs that lack capacity and
government faces several policy challenges in                    resources. The national government and implementing
implementing the Mandanas Ruling. To maintain                    agencies could strengthen local government capacity
fiscal sustainability, the increase in inter-governmental        on providing an enabling environment for LGUs that
fiscal transfers need to be compensated by additional            assigns responsibilities according to available capacity
revenue or expenditure reducing measures. As a result,           and ensures a highly participatory process involving
the national government plans to transfer devolved               learning by doing. In the long-term, revisiting the Local
functions currently assumed by the national government           Government Code is needed to address systemic
back to local government units equivalent to 1 percent           issues on own-source revenue generation, address
of GDP during the implementation of the Ruling.                  the horizontal fiscal imbalances created by the current
However, coordination challenges between the national            Internal Revenue Allotment formula, and clear assignment
government and LGUs could jeopardize the quality                 of service delivery responsibilities.

                                                                                                        Photo: Michael D Edwards

                                                                                   PHILIPPINES ECONOMIC UPDATE JUNE 2021 EDITION   IX
Part I
Recent Economic and
Policy Developments
The recent surge in COVID-19 cases and
the return to strict containment measures
in Metro Manila and nearby provinces have
derailed the early signs of an economic
rebound. Rising inflation, driven by higher
food prices, has also emerged as a key
challenge in early 2021. While there
have been improvements in job creation
and labor force participation in recent
months, underemployment and the share
of part-time workers have risen. The
authorities have continued to support the
economy by expanding public spending,
led by stimulus and other support measures
as well as infrastructure spending, while
maintaining an accommodative monetary
policy stance.
Photo: ultramansk
PHILIPPINES ECONOMIC UPDATE JUNE 2021 EDITION 11.1 Economic Growth: Cost of Containment
The Philippines registered a contraction for the fifth consecutive quarter in Q1 2021, the
longest recession since the 1985 debt crisis. The contraction was driven by the continued
slump in private domestic demand amid rising inflation, income losses, and continued
implementation of containment measures.
The resurgence of new COVID-19 cases has derailed The economy contracted by 4.2 percent in the first
the early signs of the country’s economic rebound in quarter of 2021 amid prolonged implementation of
2021. The gradual reduction in new COVID-19 cases from containment measures and a deterioration in domestic
the initial peak of 4,477 per day in mid-August to around demand conditions. The country registered the worst
1,100 in January 2021, led to a relaxation of restrictions growth performance among peers in the region in Q1 2021
on the economy. This improvement paved the way for a such as Thailand (-2.6 percent), Indonesia (-0.7 percent),
rebound in mobility and economic activity in early 2021. Malaysia (-0.5 percent), and Vietnam (4.5 percent growth).
As lockdown restrictions were relaxed, employment and The pandemic continues to impact the economy through
earnings generally improved though not enough to offset both external and domestic channels. Through the external
the earlier declines. Moreover, the Philippines benefited channel, services exports contracted sharply owing to
from an improved external environment, as goods trade lingering restrictions and weak demand for international
expanded amid an improving global environment. High tourism and travel while goods exports recovered. Through
frequency data in the first three months of 2021 suggested the domestic channel, the Philippines continues to
a recovery in economic activity was on its early stages. implement containment measures, which further tightened
However, the surge in COVID-19 cases beginning in March, towards the end of the first quarter amid a surge in cases to
and rising inflation derailed the recovery momentum as a peak of about 15,000 in early April. The public sector was
economic growth fell short of market expectations. the main driver of activity, benefitting from an expansionary
budget which aims to support economic recovery.
Figure 1. The Economy contracted for the fifth consecutive Figure 2. The contraction was broad-based.
quarter.
10
15
8
10
6
5 4
0 2
Percentage point
Percentage point
0
-5
-2
-10
-4
-15 -6
-20 -8
-25 -10 Agriculture
-12 Manufacturing
-30
-14
Other industries
Q1 Q2 Q3 Q4 Q1 Q2 Q3 Q4 Q1 Q2 Q3 Q4 Q1
Services
2018 2019 2020 2021 -16 GDP growth
-18
Net exports
-20
Investments Q1 Q2 Q3 Q4 Q1 Q2 Q3 Q4 Q1 Q2 Q3 Q4 Q1
Government Consumption 2018 2019 2020 2021
Household Final Consumption Expenditure
GDP Growth
Source: Philippine Statistics Authority (PSA). Note: Other industries are mining and quarrying, construction, electricity, gas,
and water.
Source: PSA.
1 All growth numbers are year-on-year unless otherwise stated.
PHILIPPINES ECONOMIC UPDATE JUNE 2021 EDITION 2Private domestic demand continued to drive the growth On the production side, strict containment measures and
contraction. Private consumption contracted by 4.8 percent weak demand led to the decline in industry and services
in the first quarter of 2021 driven by movement restrictions output. Soft demand and production disruptions resulted in
that suppressed consumption, and declining incomes the contraction of industry output by 4.7 percent in the first
amid poor employment outcomes and rising inflation. The quarter of 2021. The decline in output was led by the large
consumption of non-essential goods and services and those contraction in the private construction sector, likely driven
impacted by mobility restrictions continued to experience the by delays and postponement of construction projects2.
sharpest contractions. Meanwhile, investment activity was Improved global trade led to a slight uptick in manufacturing
dampened by elevated levels of uncertainty, a deterioration output (0.5 precent), the first expansion since the fourth
in business confidence, loss of revenue and incomes, quarter of 2019. Meanwhile, the services sector contracted
and limited access to finance. Investment contracted by by 4.4 percent, impacted by mobility restrictions, falling
18.3 percent, in which, investments in private construction incomes, and a change in consumer behavior. However,
and durable equipment fell by nearly 30 percent. sectors such as health, information, communication,
and finance registered positive growth, benefitting from
Despite a recovery in goods exports, services trade increased reliance on their services. In particular, both the
remained depressed owing to lingering restrictions in communication and finance sectors benefitted from the shift
travel and tourism. Exports fell by 9.0 percent in the first of many activities online, adapting to ‘new normal’ conditions.
quarter of 2021, driven by the 21.0 percent contraction in
services exports. Travel restrictions weighed heavily on Agricultural output fell for the second consecutive
travel and transport exports services, which contracted by quarter, driven by the contraction in livestock and poultry
97.7 percent and 34.1 percent, respectively, in the first quarter supply. The agriculture sector contracted by 1.2 percent,
of 2021. However, merchandise exports expanded by 2.4 primarily due to a significant contraction in livestock (-23.2
percent in the first quarter of 2021, benefitting from the percent) and poultry (-7.4 percent) output.3 In particular, the
recovery in global economic activity (Box 1). In particular, the sharp decline in livestock output was driven by the ongoing
goods trade has shown signs of recovery since late 2020 outbreak of the African Swine Fever which has affected
as the country benefitted from a recovery in global demand around one-third of the country’s hog population. Meanwhile,
for its exports, particularly in electronic products. Meanwhile, crop production recovered in the first quarter of 2021, as
imports declined by 8.3 percent, driven by the sharp crop output grew by 3.5 percent. Crop output benefitted
contraction in services imports (-33.2 percent), most notably from relatively fair conditions in the first quarter of 2021, in
in travel and transportation, amid ongoing travel restrictions contrast to the previous quarter, as output suffered from
and weak demand for international tourism. Meanwhile, damages due to several strong typhoons.
merchandise imports contracted marginally by 1.6 percent.
Photo: Stephane Bidouze
2 Approved construction projects fell by nearly 40 percent in 2020, based on approved building permits collected by the PSA.
3 These sectors account for roughly a fifth of total agricultural output.
PHILIPPINES ECONOMIC UPDATE JUNE 2021 EDITION 3Box 1. Recent Global Developments.
Following a heavy contraction in 2020, the global homogeneous across countries, with China and advanced
economy recovered in the first few months of 2021. economies largely leading the rebound. Furthermore, the
The global economy contracted 4.3 percent in 2020, rapid recovery in trade has led to a sharp increase in freight
with advanced economies and emerging markets and prices amid congestions at shipping ports, which, together
developing economies (EMDEs) contracting by 5.4 percent with supply chain disruptions, contributed to moderating
and 2.6 percent, respectively (Figure 3). Nonetheless, the momentum. Finally, trade in services remains subdued,
China’s economy was already recovering in the second half with tourist arrivals remaining way below their January 2020
of 2020 and was a notable exception among EMDEs, which levels.
collectively experienced an economic contraction more
severe than previously forecasted. Recent high-frequency Financial markets expect an economic recovery as the
data, such as the purchasing managers index (PMI), point spread between short- and long-term interest rates
toward a broad recovery. The global PMI rose to 54.8 in widen, although EMDEs face mounting headwinds as
March—a 79-month high—as advanced economies and capital inflows slow down. The widening of short- and
EMDEs, especially in East Asia and the Pacific (EAP), ramped long-term interest rates has been observed across most
up their manufacturing production. advanced economies and has reduced negative-yielding
debt since January, with significant spillover effects on other
The economic recovery has been uneven across financial markets. In the United States, 10-year US Treasury
countries. The recovery in some advanced economies is yields have increased by 33 basis points, their sharpest
supported by fiscal support packages and loose monetary increase in five years. Yields on local currency and dollar-
policy. The manufacturing sectors of advanced countries denominated bonds of EMDEs are also increasing, although
and EMDEs in EAP have continued to recover on the back capital inflows lost momentum due to rising global yields
of stronger external demand. The United States’ recovery and concerns over a tightening of monetary policy in the
is accelerating due to an uptick in the rollout of vaccines United States. Finally, more subdued recovery projections
and renewed fiscal support. Stimulus checks pushed retail for EMDEs relative to advanced economies were reflected in
sales upward by 9.8 percent in March, a notable turnaround the decrease in bond issuance across EMDEs in February.
from the -8.7 percent in March 2020. Still, a resurgence of
COVID-19 infections in some large euro area economies is The recovering global environment has had impact on
weighing on economic activities and forcing governments the Philippines. Merchandise exports expanded in the first
to maintain stringent lockdowns. The euro area composite quarter of 2021 as the country benefitted from a recovery
PMI rose slightly in February but remained in contractionary in global demand for its exports, particularly in electronic
territory at 48.8. Among EMDEs, commodity exporters such products. This contributed to the recovery in manufacturing
as Russia, Saudi Arabia, Nigeria, and South Africa have activities which grew by 0.5 percent in the first quarter of
benefited from the broad-based increase in commodity 2021 from a 3.3 percent contraction in the same period
prices. The recovery in commodity importers is also gaining in 2020. Still, given continuing restrictions in international
traction due to reduced drag from the pandemic and travel and closed borders in many countries, tourism and
spillovers from the global recovery. the deployment of overseas Filipino workers remain weak
relative to pre-pandemic levels.
Global trade has largely recovered to pre-pandemic
levels (Figure 4). The rapid recovery of the global trade in Source: Global Economic Prospects, January 2021; and
goods has largely mirrored the rapid recovery in industrial Global Monthly, March 2021.
production. The recovery has not, however, been
Photo: Chema Grenda
PHILIPPINES ECONOMIC UPDATE JUNE 2021 EDITION 4Figure 3. The global economy contracted 4.3 percent in Figure 4. The global trade in goods has returned to
2020. December 2019 levels.
Global Trade
(Index, December 2019 = 1)
1.1
Percent World
1.05
8 Advanced economies 100
1
EMDEs 90
0.95
80
4 0.9
70
0.85
60
0.8
0 50
0.75
40
0.7
30
Jan-20
Feb-20
Apr-20
May-20
Jun-20
Sep-20
Oct-20
Jan-21
Mar-20
Jul-20
Aug-20
Nov-20
Dec-20
Dec-19
-4
20
10
-8 0 World Adva nced Economies
2010 2012 2014 2016 2018 2020 2022
EMDE Eme rgin g Asi a (excl . Chin a)
Source: World Bank. Source: World Bank.
Photo: Michael D Edwards
PHILIPPINES ECONOMIC UPDATE JUNE 2021 EDITION 51.2 The Exchange Rate and the External Sector: Stronger
Stable Peso Amid Recovery
The balance-of-payments (BOP) surplus more than doubled to 4.4 percent of GDP in 2020,
driven by a substantial current-account surplus due to a double-digit import contraction.
This led to a steady appreciation of the peso throughout 2020, which remained stable in the
first four months of 2021.
The trade deficit narrowed substantially in 2020, The Philippine peso appreciated in nominal and real
resulting in a current-account surplus. The current account terms in the first four months of 2021. The peso
improved from a deficit of 0.8 percent of GDP in 2019 to surplus appreciated by 4.4 percent in nominal terms in 2020
of 3.6 percent of GDP in 2020, driven by a significant narrowing amid weak imports, capital inflows, and weakness in the
of the trade deficit (Table 1). In 2020, goods imports saw steeper U.S. dollar. In the first four months of 2021, it registered an
declines than exports as domestic economy collapsed, and average of 5.5 percent year-on-year gains against the U.S.
global demand weakened. Yet in early 2021, both recovered with dollar on the back of narrower merchandise trade deficit6
goods exports growing faster than imports in March 2021 due and higher remittances. On a monthly basis, the peso began
to improving global demand (Figure 5). Meanwhile, net services to gradually depreciate amid merchandise import recovery7,
exports grew by a mere 0.3 percent in 2020, a substantial drop rising U.S. Treasury yields, and global oil prices returning to
from 12.3 percent in 2019, as travel restrictions crippled the pre-pandemic levels. The country’s real effective exchange
tourism sector4 and the business process outsourcing (BPO) rate also appreciated during the first four months of 2021 at a
sector recorded lower earnings.5 Moreover, remittances only time when the currencies of regional peers depreciated. This
grew at 0.8 percent in 2020, compared to 3.9 percent in 2019, may adversely impact the country’s exports competitiveness.
due to the repatriation of more than 325,000 overseas Filipino After reaching an all-time high of US$110 billion by end-
workers, mostly from Middle Eastern countries. Nonetheless, total 2020, gross international reserves fell to US$107.2 billion
remittances has reached US$8.5 million as of March 2021, 2.9 in April 2021, equivalent to 12.3 months’ worth of imports
percent higher than remittances inflow in the first quarter of 2020. of goods and payments of services and primary income.
Smaller but sustained net capital inflows contributed to
the BOP surplus in 2020. Net inflows to the capital and
financial accounts softened to US$4.7 billion (1.3 percent
of GDP) in 2020, as FDI fell by 24.6 percent to US$6.5
billion (Figure 6). This was partly due to the weak external
environment and the country’s poorer FDI attractiveness
compared to most regional peers, driven in part by
restrictions on FDI (Box 2). Net portfolio investments (FPI)
registered net outflows of US$0.5 billion (0.1 percent of
GDP) in 2020, stemming from the increase in foreign debt
securities investments by the BSP. Meanwhile, an increase
in public and private foreign loans led to substantial net
inflows in the other investments account. This contributed
to the overall BOP surplus more than doubling to US$16.0
billion (4.4 percent of GDP) in 2020. However, preliminary
data indicate a cumulative BOP deficit of US$2.8 billion
in Q1 2021, as the government repaid its maturing foreign
Photo: Michael Leslie
loans and the external goods trade posted a deficit.
4 Tourist arrivals plummeted by 83 percent between 2019 and 2020. Source: Department of Tourism http://tourism.gov.ph/Tourism_demand/Arrivals2020.pdf.
5 Villanueva, Joan. “Economist sees new record-highs for PH foreign reserves.” Philippine News Agency. March 12, 2021. https://www.pna.gov.ph/
articles/1133440.
6 In the first two months of 2021, total goods imports amounted to US$16.0 billion, 5.6 percent lower relative to the value of goods imported during the same
period in 2020. Likewise, goods exports contracted by 3.6 percent in the first two months of the year to US$10.8 billion, resulting in a merchandise trade deficit.
7 In Q1 2021, goods imports amounted to US$25.6 billion, 3.2 percent higher than the value of imports in Q1 2020.
PHILIPPINES ECONOMIC UPDATE JUNE 2021 EDITION 6Table 1. Balance of Payments, 2016–2020
In percentage of GDP 2016 2017 2018 2019 2020
Current account -0.4 -0.7 -2.6 -0.8 3.6
Goods -11.2 -12.2 -14.7 -13.1 -8.8
Exports 13.4 15.8 15.0 14.2 13.1
Imports 24.6 28.0 29.7 27.3 21.9
Services 2.2 2.6 3.3 3.5 3.6
Primary Income 0.8 1.0 1.1 1.4 1.2
Secondary Income 7.8 8.0 7.7 7.4 7.6
Capital and Financial accounts -0.0 0.9 2.7 2.2 1.3
Capital account 0.0 0.0 0.0 0.0 0.0
Financial account 0.1 -0.9 -2.7 -2.1 -1.3
Direct investment -1.8 -2.1 -1.7 -1.4 -0.8
Net acquisition of financial assets 0.8 1.0 1.2 0.9 1.0
Net incurrence of liabilities / 1
2.6 3.1 2.9 2.3 1.8
Portfolio investment 0.5 0.7 0.4 -0.7 0.1
Financial derivatives -0.0 -0.0 -0.0 -0.0 -0.1
Other investments 1.4 0.5 -1.4 -0.0 -0.5
Net unclassified items 2/
0.1 -0.5 -0.8 0.7 -0.4
Overall BOP position -0.3 -0.3 -0.7 2.1 4.4
Memo:
Basic Balance 1.5 1.5 -0.9 0.6 4.4
Gross International Reserves (in billions US$) 80.7 81.6 79.2 87.8 110.1
Import Coverage (in months) 8.8 7.8 6.9 7.6 12.6
1/ Net incurrence of liabilities refers to net foreign direct investment (FDI) to the Philippines.
2/The term “Net unclassified items” is a balancing figure. There are two methods of computing the BOP position: the first approach uses the change in net
international reserves due to transactions, while the second approach computes the sum balances of the current account, capital account less financial account.
The two measures do not necessarily tally. The BSP uses the first approach to determine the overall BOP position.
Note: Following the BSP presentation, the BOP balance = Current Account Balance + Capital Account Balance - Financial Account Balance + Net Unclassified Items.
Source BSP.
Figure 5. From mostly sharp contractions throughout Figure 6. The contraction in FDI was less pronounced in
2020, both imports and exports of goods indicate recovery the Philippines than in many other regional peers in 2020.
in early 2021.
FDI flows as share of GDP
35 7
6
15 5
4
Percent
3
-5
Percent
2
1
-25 0
2010-2020 2019 2020
-1
Export growth
-2
-45
Import growth
Philippines Thailand Indonesia Malaysia Vietnam
-65
M 0
-19
N 0
M 19
21
1
Ju 0
Se 9
N 9
- 19
M 0
Se 0
0
-2
2
-2
2
l-1
-2
-2
1
l-2
-
p-
n-
ar
ar
p-
ay
n-
ov
Ju
ar
ay
ov
Ja
Ja
M
M
Source: BSP. Source: Institute of International Finance (IIF).
PHILIPPINES ECONOMIC UPDATE JUNE 2021 EDITION 7Box 2. Foreign Direct Investment Restrictiveness in the
Philippines.
The Philippines lags its regional peers in FDI inflows, framework (Figure 7) and the most stringent foreign equity
which increases the risk that the country may be unable limits among peers (Table 2). The restrictive foreign equity
to leverage key growth opportunities during the economic limits have caused the domestic industries to miss out
recovery. From 2010-2019, the Philippines received US$45 on capital, technology, and productivity gains through
billion worth of FDI, lagging behind Indonesia (US$178 knowledge spillovers. Moreover, the outdated framework
billion), Viet Nam (US$112 billion), Malaysia (US$96 billion), will potentially limit the country’s ability to leverage growth
and Thailand (US$74 billion). An outdated legal and policy opportunities during the recovery, including the potential
framework has limited the inflow of FDI for decades. In 2019, spillover effects from the US$1.9 trillion U.S. stimulus through
the Philippines had the most restrictive regulatory investment channel.
Figure 7. Across key sectors, the FDI regulatory framework is more restrictive in the Philippines than in regional peers.
Overall FDI Regulatory Restrictiveness Index
(select sectors and total, 2019)
0.8
0.7
0.6
Closer to 1 = Most restrictive
0.5
0.4
0.3
0.2
0.1
0.0
Retail Road transport Water transport Fixed telecoms Mobile telecoms Total FDI Index
Philippines Indonesia Thailand Malaysia Vietnam
Source: Organisation for Economic Cooperation and Development (OECD).
Table 2. Foreign Equity Limits on FDI among ASEAN Countries.
Telecomunications- Telecomunications - Trasportation - Trasportation -
Fixed Mobile Road Water
Indonesia 67% *** 49% 49%
Malaysia 100% 100% 49%** 49%**
Philippines 40% 40% 40% 27.3
ThailandThree bills that aim to ease restrictions on FDI are supported by an annual review of the foreign investment
currently pending in Congress. The president recently negative list (FINL), regular updates to the declaration
certified these bills as urgent, effectively allowing of policy to incorporate the current dynamics of global
Congress to fast-track their passage. These three bills and regional economies, and the establishment of a joint
amend the Public Service Act, Retail Trade Liberalization web portal that will serve as a one-stop shop for foreign
Act (RTLA), and the Foreign Investment Act (FIA). investors. Aside from attracting FDI, the amended FIA also
aims to increase foreign skilled labor in the country by
The amendment to the Public Service Act is envisioned removing the practice of profession from the negative list.
to augment infrastructure investments. Foreign The influx of foreign professionals could help to reduce
ownership caps on public utilities are limiting the size the shortage of skilled labor in the country, and potential
of foreign investment in critical infrastructure like water, knowledge spillovers would help to upskill Filipino workers.
power, transportation, and telecommunication. In the
amended bill, only three sectors are identified as public Finally, the amended RTLA aims to increase
utilities: the transmission of electricity, distributions of competition in the retail sector. The senate bill aims to
electricity, and water works and sewerage systems, which increase the foreign participation in retail by reducing
will still face foreign ownership caps. To ensure flexibility, the required minimum paid-up capital from US$2.5
future legislation can classify additional sectors as public million to US$300,000. There are also several deleted
utilities, and the National Economic and Development provisions in the revised bill, including: (i) the 60 percent
Authority (NEDA) is mandated to recommend the limit on the foreign ownership of local retailers; (ii) the
classification of a business, or service as a public utility requirement that retail trade enterprises, of which 80
to Congress. Additionally, the bill contains a clause percent of the stocks are foreign owned, need to offer a
for creating an appropriate mechanism for fixing rates minimum of 30 percent of their equity to the public within
based on reasonable returns and the efficiency of public 8 years of starting their operations; (iii) the requirement
service delivery. Moreover, administrative enforcement that foreign retailers need to have a minimum net worth
will be strengthened to disincentivize investor neglect. of US$200 million in its parent corporation for those
classified under categories B and C and US$50 million
The amended FIA aims to increase investments and for those under category D; (iv) have 5 retail branches
attract foreign skilled professionals. To attract FDI, the or franchises anywhere around the world, with at least
employment threshold for non-Filipinos investing at least one store capitalized at a minimum of US$25 million; and
US$100,000 in small and medium-sized enterprises will (v) have a 5-year track record in the retail business.
be lowered from 50 to 15 direct employees. This policy is
Photo: By Walter Eric Sy
PHILIPPINES ECONOMIC UPDATE JUNE 2021 EDITION 91.3 Inflation and Monetary Policy: Accommodative Policy
Amid Rising Inflation
Rising food prices due to supply shocks brought by a series of typhoons in 2020 and the
outbreak of African Swine Fever (ASF) pushed inflation above the BSP target in the first four
months of 2021. Despite inflationary pressure, the BSP kept its key policy rate steady to
support the economy.
Inflation breached the upper bound of the BSP target support the economic recovery. Stable core inflation, along
range in the beginning of 2021 due to food supply with the government’s adoption of trade and other
shocks. The headline inflation rate averaged 4.5 percent in measures to address the low pork supply, solidified the
the first four months of 2021, higher than an average of 2.6 view of the BSP that the uptick in inflation is transitory. The
percent during same period in 2020 and above the BSP’s BSP has previously engaged in open market operations
inflation target range of 2-4 percent (Figure 12). Elevated and also continued the implementation of other regulatory
food prices, caused by harvest losses due to a series of measures to minimize the economic fallout of the COVID-19
typhoons in 2020, and a lower pork supply, caused by pandemic, such as adopting zero percent risk weight for
the outbreak of ASF, were the main drivers of inflationary the guaranteed loans of micro, small, and medium-sized
pressure. Transport inflation also rose due to higher fares enterprises, as well as waiving the fees for fund transfer
brought on by the implementation of quarantine restrictions, transactions through the BSP’s payment and settlement
and the rise of global oil prices back to pre-pandemic system.
levels.8 Excluding volatile food and energy items, the core
inflation averaged 3.5 percent in the first four months of The Philippine financial system maintains a high level
2021, slightly higher than the average of 3.1 percent in the of liquidity, but banks remain risk averse to lending.
same period last year. The small increase in core inflation Domestic liquidity remained high at Php14.0 trillion in
suggests that rising food prices had little spillover effects February 2021, despite liquidity growth declining year-
to other goods and services. Compared to neighboring on-year from 16.2 percent in June 2020 to 9.4 percent in
countries, domestic inflation is higher than Indonesia (1.4 February 2021. Banks continue to be risk averse, with the
percent), Malaysia (1.7 percent), Thailand (3.4 percent), and outstanding loans of universal and commercial banks falling
Vietnam (2.7 percent). by 2.7 percent between February 2020 and 2021 to reach
Php8.9 trillion. Credit to private sector sharply shrank amid
The BSP continued its accommodative policy stance by the COVID-19 pandemic and is expected to further decline
keeping the key policy rate unchanged. It maintained the due to the renewed lockdown in April 2021. Credit to private
key policy rate at 2.0 percent in March 2021 to continue to sector contracted by 2.4 percent in February 2021 (Box 3).
Photo: Walter Eric Sy
8 Transport inflation averaged 12.7 percent in the first four months of 2021, partly due to the increase in global oil prices, with the Brent crude oil price
benchmark growing by 20 percent, quarter-on-quarter.
PHILIPPINES ECONOMIC UPDATE JUNE 2021 EDITION 10Box 3. Recent Developments in the Financial System
The financial system has broadly withstood the impact The economic contraction is elevating credit risks, especially
of COVID-19 but it faces significant downside risks due from the corporate sector. As noted by the recent IMF Financial
to uncertainty around the pace of recovery and high System Stability Assessment (FSSA),10 non-financial corporates
interconnectedness with non-financial corporates. The are highly interconnected with the financial system through
banking sector’s overall capital adequacy ratio (CAR) remains mixed conglomerate structures. While banks can withstand
stable at about 16 percent, well above BSP’s regulatory the exceptionally severe shocks in the baseline scenario, they
threshold of 10 percent (Figure 8). The overall liquidity of could experience a systemic solvency impact if additional
the banking sector is sufficient to absorb funding shocks downside risks materialize. The firms are likely to experience
with a liquidity coverage ratio of above 150 percent. In terms substantial distress even in the baseline scenario. The GDP
of asset quality, The gross NPL ratio rose to 4.1 percent as shocks are expected to reduce corporate earnings across
of end-February 2021 compared to about 2.2 percent as different sectors as well as the debt servicing capacity of the
of the end of February 2020 (Figure 9). Furthermore, the corporates. Moreover, the recent national COVID-19 survey
banking system saw a significant increase in its restructured conducted in November 2020, indicates that a large share
loans, from 0.4 percent in January 2020 to 1.9 percent in of firms reported acute liquidity constraints, with reports of
December 2020. As a result, the capital at risk ratio (NPL net not having enough cash and have fallen behind in payments
of provision to capital ratio)9 has risen from 4.6 percent at the (Figure 10). Thus, the negative impact of COVID-19 on the
end of 2019 to 6.2 percent at the end of 2020. solvency of non-financial corporates poses significant risks to
the financial system.
Figure 8. The financial system appears to have adequate Figure 9. NPLs remain manageable, as in most
capital buffers. regionalpeers, but asset quality needs close monitoring.
Regulatory Capital to Risk-Weighted Assets Nonperforming Loans ratio, %, February 2021
(or latest available)
25
20 Mongolia 11.8
Brunei 3.7
15
Philippines 4.1
10 Thailand 3.2
Laos 3.2
5
Indonesia 3.2
0 Vietnam 2.1
China 1.8
am
e
es
a
sia
na
a
nd
di
or
si
Cambodia
in
i
1.8
la
ay
ne
bo
tn
Ch
ap
pp
ai
e
al
do
m
ng
Th
Malaysia
Vi
ili
M
1.6
Ca
Ph
In
Si
Singapore 1.3
Regulatory Capital to Risk-Weighted Assets Korea 0.2
Basel III minimum 0 5 10
Source : International Monetary Fund (IMF) FSI (Q4 2020 or latest available) Source : World Bank staff calculations; Haver Analytics
9 This indicator measures the capacity of bank capital to withstand losses from NPLs, once specific provisioning has absorbed part of those losses.
10 IMF, Philippines Financial System Stability Assessment, April 2021.
PHILIPPINES ECONOMIC UPDATE JUNE 2021 EDITION 11You can also read