Economic Recovery Strategy - Evidence Review Leicester and Leicestershire Local Enterprise Partnership - LLEP
←
→
Page content transcription
If your browser does not render page correctly, please read the page content below
Leicester and Leicestershire Local Enterprise Partnership

Economic Recovery Strategy
Evidence Review

 Draft Report       April 28   Cambridge Econometrics   info@camecon.com
                    2021       Cambridge, UK            www.camecon.com
Leicester & Leicestershire Economic Recovery Strategy – Evidence Review

                                                  Version 2.3

                                             28 April 2021, 16.00

                                              ga@camecon.com

     Cambridge Econometrics’ mission is to provide clear and useful insights, based on rigorous and
          independent economic analysis, to address the complex challenges facing society.
                                         www.camecon.com

                         Cambridge Econometrics Limited is owned by a charitable body,
                             the Cambridge Trust for New Thinking in Economics.
                                       www.neweconomicthinking.org

Cambridge Econometrics                                                                                                   2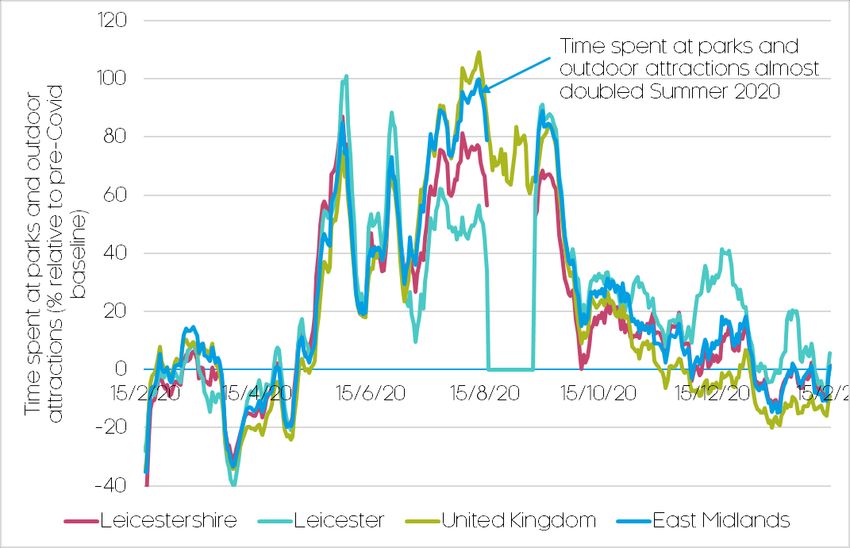
Contents

                                                                Page
Executive summary                                                  4
   Introduction                                                    4
   Impacts of Covid-19 and Brexit                                  4
   Informing the objectives of the economic strategy               7
   Developing the strategic objectives                             8

1   Introduction                                                  12
    1.1 About this report                                         12
    1.2 A changing context                                        12

2   Pre-Covid trends                                              15
    2.1 The Leicestershire economy pre-Covid                      15
    2.2 The Covid-19 pandemic in Leicester and Leicestershire     16

3   Sectors, business and innovation                              24
    3.1 Introduction                                              24
    3.2 The 2020 baseline                                         24
    3.3 Recent trends and outlook                                 27
    3.4 Workshop findings                                         37
    3.5 Implications and strategy priorities                      39

4   Employment and skills                                         44
    4.1 Introduction                                              44
    4.2 The 2020 baseline                                         44
    4.3 Recent trends and outlook                                 45
    4.4 Workshop findings                                         52
    4.5 Implications and strategy priorities                      54

5   Place, infrastructure and transport                           60
    5.1 Introduction                                              60
    5.2 The draft LIS baseline                                    60
    5.3 Recent trends and outlook                                 61
    5.4 Workshop findings                                         66
    5.5 Outlook, implications and strategy priorities             68

6   Inequality and inclusion                                      73
    6.1 Introduction                                              73
    6.2 The 2020 baseline                                         73
    6.3 Recent trends and outlook                                 73
    6.4 Workshop findings                                         76
    6.5 Implications and strategy priorities                      77

7   Low carbon and environment                                    80
    7.1 Introduction                                              80
    7.2 The 2020 baseline                                         80
    7.3 Recent trends and outlook                                 82
    7.4 Workshop findings                                         85
    7.5 Implications and strategy priorities                      88

8   Taking the strategy forward                                   90
    8.1 Workshop findings and board discussions                   90
    8.2 Strategic issues                                          91
Leicester & Leicestershire Economic Recovery Strategy – Evidence Review

Executive summary

Introduction
This report provides an overview of the latest evidence on the Leicester and
Leicestershire economy, including analysis of the impacts of Covid-19 and
Brexit; and a synthesis of previous strategies and findings from 14 workshops
that were conducted in March 2021.
This document and this Executive Summary is not a strategy. It provides
an overview of the issues, challenges and opportunities that the strategy must
be able to address. It represents the first step in devising a strategy – in-depth
knowledge and insight into the past, present and future of the economy of the
region.
A separate sectors study is also being undertaken, due for completion in May
2021 which will be incorporated into the evidence base and final strategy in
June 2021.

Impacts of Covid-19 and Brexit
The economic context and environment has changed significantly in the past
12 months. The main implications of Covid-19 and Brexit for the economic
prospects facing Leicester and Leicestershire can be summarised as follows.
Overall economy
Leicester and Leicestershire has generally been hit harder by the Covid-19
pandemic than elsewhere in the country. Current (February 2021) caseloads
in the county are still some 70% higher than the national average. Entering
Spring 2021, 1 in 14 Leicester and Leicestershire residents are estimated to
have returned a positive test for Covid-19, compared to 1 in 16 across the rest
of the country.
Employers within Leicester and Leicestershire have been less likely to have
made redundancies compared to the national average, but the true impact of
Covid-19 will only be apparent once furlough and other support ends. In the
short-term, vulnerable sectors have been highly reliant on furlough and other
Covid support. Once support tapers off there is a risk of job and business
losses. Some sectors in the UK have been more active users of government
support (grants, loans, and furlough schemes) – including manufacturing,
utilities, accommodation and food, and other services.
The LLEP business survey conducted in September 2020 showed the obvious
concern for doing business with the Coronavirus impacting the economy and
operations. 50% of businesses were aiming for steady growth over the next 12
months, 34% planned to stay as they were, and 6% planned to downsize.
Only 1% planned to cease trading.
Preliminary economic forecasts indicate that by 2030, as a legacy of the
pandemic, the Leicester and Leicestershire economy could expect to have in
the region of 1,600 fewer jobs, output £800 million lower, and a workforce
£1,300 per annum less productive. However, within the wider national context,
not only is the short-run impact expected to be less pronounced in Leicester
and Leicestershire, but its recovery could match and potentially exceed the UK
Cambridge Econometrics                                                                        4
Leicester & Leicestershire Economic Recovery Strategy – Evidence Review

average, resulting in a smaller relative ‘lost growth’ shortfall over the longer
term.
Sectors, business and innovation
Leicestershire’s sectoral structure could insulate it from the worse of the long-
term economic effects. Pre-Covid the Leicestershire economy had a lower
relative incidence of jobs in ‘vulnerable’ and ‘very vulnerable’ sectors.
The disruption to business activity is expected to be less severe locally, but
still substantial. Short-term, such sectors have been highly reliant on furlough
and related support. There has been a slightly lower rate of decline in payrolls
in Leicester and Leicestershire compared to nationally. Longer-term though
there is an increased risk of job losses and business dissolutions, particularly
with the reduction or winding down of any support.
Retail, leisure and tourism are amongst the hardest hit sectors, but appear to
be more resilient in Leicestershire. The retail, leisure and tourism sector -
which accounts for a substantial 62,000 jobs in Leicester and Leicestershire -
has seen a markedly steeper drop and slower recovery in activity and
revenues compared to other sectors.
Innovative and international businesses have faced distinct challenges –
including a fall in demand, and reduced access to R&D facilities. Concerns
have also been raised about future access to research funding, and the fall in
exports.
Employment and skills
On aggregate, labour market impacts have been substantial, with Leicester
and Leicestershire faring slightly better than the UK average. The main
findings from the analysis of the impacts of Covid-19 and Brexit in this chapter
revealed that The labour market impact has been substantial, though
Leicester and Leicestershire has fared better than others due to the industrial
structure of the economy and employment.
Significant concentrations of impact in Leicester. Within Leicester and
Leicestershire, the labour market impact has largely been a ‘Leicester story’; 4
in 10 of those out of work in the county reside in the city, which has accounted
for half of all new unemployment claims in Leicester and Leicestershire. These
increases have largely been within deprived parts of the city already afflicted
with high levels of worklessness and deprivation.
Flexible and self-employed workers have been the hardest hit employment
group. The impact of the pandemic for these employment groups has been
significant; close to two-thirds have reported having less work than usual,
whilst self-employed earnings are set to be a third lower during the crisis.
Homeworking potential is high in Leicestershire, though workers have been
quick to return to the workplace. It is estimated 4 in 10 (39%) Leicester and
Leicestershire jobs can be easily done from home, a higher proportion than
regional and national averages (36% and 38% respectively).
The skills impact is uncertain, though disruption to teaching has been greater
in Leicestershire. Pupils in Leicester and Leicestershire have already been
much more likely to experience school closures and interruptions to teaching
than peers, creating potentially unrecoverable gaps in learning.

Cambridge Econometrics                                                                        5
Leicester & Leicestershire Economic Recovery Strategy – Evidence Review

Overseas labour arriving in Leicestershire has plummeted, and has the
potential to exacerbate skills shortages. NINo registrations to overseas adults
halved in 2020 compared to 2019 - with EU citizens making up three-quarters
of this fall. Sectors particularly vulnerable include Distribution, Hotels and
restaurants, Textiles, Food and drink, Banking, finance and insurance, Public
administration, Education and Health and social care, and Agriculture.
There are further risks, as we will have created a cohort of young people and
workers unable to secure apprenticeships or entry-level jobs during the past
12 months; allied with uncertain labour demand if business confidence is low
for the rest of 2021 and increased competition from experienced workers
made redundant. This could create a cohort of workers who are unemployed,
do not enter a career path, or end up disaffected and marginalised.
Inequality and inclusion
The following groups have been more severely affected by Covid-19 and the
lockdowns:
•   Low earners and low skilled – significantly 24% of jobs in Leicester and
    Leicestershire were paying less than a Living Wage pre-Covid; almost 1 in
    10 working age residents (almost 60,000 people) have no formal
    qualifications
•   Prior to Covid-19, 81,800 households were in relative poverty in Leicester
    and Leicestershire – half of these were in the City of Leicester, which had
    the 7th highest rate of poverty out of 181 urban authorities.
•   Young people – Leicester and Leicestershire has a larger share (14%) of
    population aged 16-24 (UK=12%)
•   Black, Asian and Ethnic Minority (BAME) residents - some 23% of adults in
    Leicester and Leicestershire are BAME, almost twice the national average
    of 13%.
Place, infrastructure and transport
Transport use has seen unprecedented change during the pandemic, with
private travel prioritised. Public transport use declined sharply, as did car use,
with active travel increasing significantly.
Public transport has providers have been particularly hard hit, though use has
been more resilient in Leicestershire. Public transport use dropped by over
two-thirds during the first lockdown in Leicester and Leicestershire.
Despite obstacles, demand for freight and logistics has been relatively
buoyant. Commercial road transport volumes, though dropping by over 50%
during the first lockdown, recovered strongly during the Summer – particularly
compared to other indicators of economic activity - and by the Autumn was
eclipsing pre-Covid levels. Alongside this, global air freight demand started to
bounce back, and by 2021 had started to recover its 2020 losses.
Demand for residential space is changing, whilst local property prices have
increased. Rightmove saw a doubling in searches for homes in small towns
and villages, and a significant rise in searches for homes further from town
and city centres, with larger gardens and space for a home office. Leicester
and Leicestershire’s housing market could be particularly well-suited to any
such shift in demand.

Cambridge Econometrics                                                                        6
Leicester & Leicestershire Economic Recovery Strategy – Evidence Review
The ‘death of the office’ narrative appears premature, though demand patterns
could change. The reaction of the market has been swift; commercial leases
were down 60% in the first nine months of 2020. However there has been
some distinction between demand and rents rising for new offices, yet
declining for older and sublet space. Mobility data has shown Leicester and
Leicestershire workers have been quicker to return to the office.
Low carbon and environmental sustainability
Environmental sustainability and climate change continue to present a major
public policy and economic challenge. For the UK to meet its carbon budget
target, it needs to cut carbon emissions by 31% by 2030, on top of the 29%
reduction achieved between 2009 and 2019. Many urban authorities wish to
pursue comprehensive carbon reduction policies and actions, and the Local
Government Association estimated that this has the potential to sustain
694,000 jobs over the next 10 years, and 1.18 million jobs to 2050.
Analysis of the recent evidence points out that:
• There was a sharp decline in air pollution during lockdown, though it has
since recovered. In Leicester, the lockdown has reduced emissions - NO2
concentrations dropped by some 30% on predicted levels during the first
months of lockdown
• Green spaces and natural capital have been increasingly prioritised by
residents during the pandemic. during Summer 2020, Leicestershire
residents spent almost twice as much time at parks and outdoor attractions
than they did pre-Covid
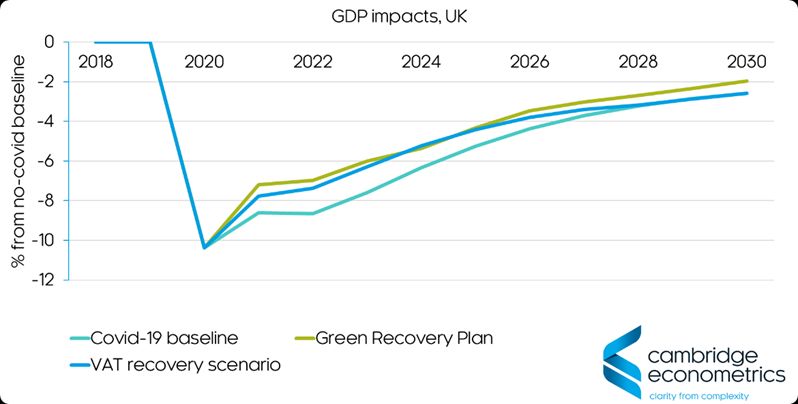
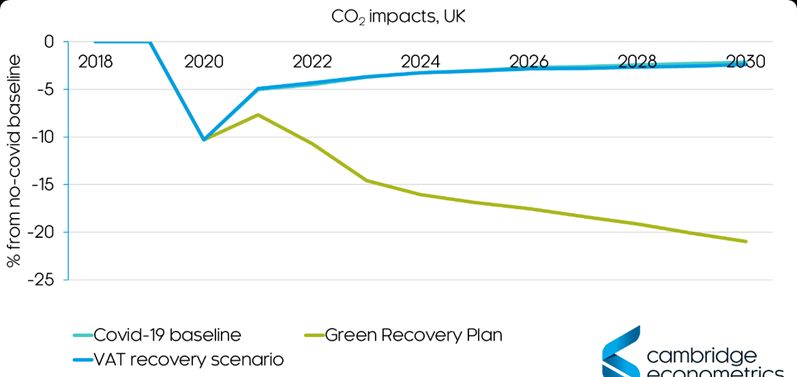
• If Leicester and Leicestershire followed a green recovery plan (HM
Government’s ‘Ten Point Plan’), this could help to establish a low-carbon
trajectory and create 4,500 jobs.
Informing the objectives of the economic strategy
A range of views have been discussed during the workshops and LLEP board
meetings concerning the aims and role of the economic strategy. To date,
these have been summarised as follows:
Aims of the strategy
➢ Be ambitious
➢ Demonstrate leadership, including thought leadership and that way
forward is fit for future challenges
➢ Have 5 or 6 major priorities – be focused
➢ Be agile and responsive enough to deal with the covid-19 recovery period,
and other challenges that emerge
➢ Reflect the changing national government priorities, frameworks and
funding opportunities
➢ Make progress in low carbon whilst also achieving economic growth
➢ Set out the broad principles
➢ Set out the response to ensure community recovery
➢ Demonstrate that the strategic planning is in place
Cambridge Econometrics 7Leicester & Leicestershire Economic Recovery Strategy – Evidence Review
➢ Ensure alignment with bottom-up concerns and issues
➢ Overcome the fragmentation of funding, initiatives and services to deliver
coherent solutions for the next 5-10 years
Local identity
During the workshops and in board discussions, there is the ambition to
ensure that the new Economic Strategy reflects the uniqueness of Leicester
and Leicestershire.
The main areas and assets differentiating Leicester and Leicestershire from
other parts of the UK include:
✓ Diversity – diverse business base, diverse population, diverse urban
and rural places
✓ Young population and workforce
✓ 3 leading universities
✓ High tech industries and research strengths – health, life sciences,
space and earth observation, engineering, advanced manufacturing,
automotive, IT, cyber, and sports
✓ World class sites and science and technology parks
✓ Leading and growing logistics hub
✓ Attractive, diverse city with great connections and large workforce
✓ Successful county towns with their own unique specialisms
✓ Partnership working and collaboration
Developing the strategic objectives
Taking what we have learnt and interpreted from the evidence base, relevant
existing strategies and workshop findings - one interpretation could be to distil
the findings into themes and objectives outlined below:-
SECTORS, ENTERPRISE AND INNOVATION
Enterprise growth, resilience and innovation
➢ Building on high rates of entrepreneurship and the high start-up rate
➢ Supporting new ‘beacons’ – scaling up SMEs with growth ambitions
➢ Supporting business survival and resilience, financial readiness and
bounce back from Covid-19
➢ Helping businesses transition to low carbon and digital
Innovation strengths and capabilities
➢ Increasing innovation: spend, collaborative networks, and activity through
the whole company base (‘bootstraps’)
➢ Continue to build on existing research strengths through collaborations,
and business commercialisation
➢ Explore how corporate R&D strengths and capabilities can be used to
benefit the local economy and SME base
Cambridge Econometrics 8Leicester & Leicestershire Economic Recovery Strategy – Evidence Review Sector specialisms and strengths ➢ Continue to support growth in key sectors, including space and earth observation, life sciences, medtech, sport and sports science, IT, digital, cyber, textiles, logistics, low carbon, food and drink and agritech, advanced manufacturing and automotive ➢ Develop the visitor offer, and local cultural and leisure offer for visitors, residents, workers and investment attraction ➢ Continue to grow knowledge-based businesses and jobs Ensuring the enterprise support offer is relevant and accessible ➢ Reflecting the needs of rural and urban areas, ethnicity, gender, and sectors Refreshing approaches to trade and inward investment ➢ To align to opportunities posts-covid and after the EU transition EMPLOYMENT AND SKILLS Workforce skills and development ➢ Ensure that the growing, younger workforce has the qualifications, skills and progression routes to sustain work, earnings and meet employers’ needs ➢ Matching skills supply to demand to achieve employer-led skills provision ➢ Improving skills and qualifications attainment ➢ Improving individual take-up of apprenticeships ➢ Engage with growth sectors Youth transitions ➢ Ensure young people successfully transition to subject choice, FE, HE and employment ➢ Improve graduate retention ➢ Continue to build upon success in establishing guidance services and capabilities Employer development ➢ Improve and support SME HR, skills specification and recruitment activity ➢ Help SMEs to access apprenticeships Mobility ➢ Improve worker mobility and travel-to-work, particularly for access to FE, apprenticeships and entry level jobs Low carbon ➢ Identify low carbon skills specifications and pathways Funding transition ➢ Transition from European Funds to UK funded solutions Cambridge Econometrics 9
Leicester & Leicestershire Economic Recovery Strategy – Evidence Review

INEQUALITY AND INCLUSION
Reducing deprivation
➢ Address low earnings
➢ Improve in-work progression
Reduce risks of exclusion
➢ Keep vulnerable groups and individuals (including NEETs) close to the
  labour market, and improve and maintain employability
➢ Continue to develop and expand guidance services
➢ Identify and address gaps in existing support and welfare system
➢ Resolve and reduce risks of digital exclusion

PLACE, INFRASTRUCTURE AND TRANSPORT
Transport
➢ Continue to deliver strategic road and rail projects, including east-west
  connectivity, improved train speeds, rail electrification, and infrastructure to
  support strategic growth sites
➢ Improve public transport services and modal shift
➢ Develop sustainable transport infrastructure, particularly alternative for
  fuels and electric vehicles
Energy
➢ Improve energy infrastructure, particularly to accommodation housing and
  employment growth sites
➢ Implement sustainable energy strategy
➢ Continue to increase renewable energy generation and sourcing
Networks
➢ Improve 5G services, implement a test bed
➢ Improve broadband access and asynchronous connectivity
Housing
➢ Increase housing supply and improve affordability
Sites, city centre and town centres
➢ Town centre and high street transition and renewal in rural market towns
  and towns
➢ City centre transition and development, including grade A commercial
  office provision in the City Centre
➢ Continue to support the build out and extension of successful strategic
  sites, including EZ sites, science and technology parks, Space Park,
  MIRA, East Midlands Airport and SEGRO

Cambridge Econometrics                                                                      10
Leicester & Leicestershire Economic Recovery Strategy – Evidence Review

LOW CARBON AND ENVIRONMENTAL SUSTAINABILITY
Creating the pathways to a low carbon economy
➢ Develop and identify low carbon pathways, including strategies and
  incentives
➢ Support business transition to low carbon
➢ Pathways to green jobs and skills
➢ Enhance and maintain biodiversity and natural capital
Sustainable transport
➢ Deliver sustainable public transport infrastructure and services, and
  infrastructure for alternative fuels and electric vehicles
Low Carbon and Environmental Goods and Services (LCEGS) Sector
➢ Grow the LCEGS in Leicester and Leicestershire
➢ Use local research, technology, innovation and entrepreneurial capabilities
➢ capabilities

Cambridge Econometrics                                                                      11
Leicester & Leicestershire Economic Recovery Strategy – Evidence Review

1       Introduction

1.1     About this report
This report provides an overview of the latest evidence on the Leicester and
Leicestershire economy, including analysis of the impacts of Covid-19 and
Brexit; and a synthesis of previous strategies and findings from 14 workshops
that were conducted in March 2021.
This document is not a strategy. It provides an overview of the issues,
challenges and opportunities that the strategy must be able to address. It
represents the first step in devising a strategy – in-depth knowledge and
insight into the past, present and future of the economy of the region. This
document provides the insights to help to update the draft Local Industrial
Strategy finalised in March 2020. .
A separate sectors study is also being undertaken, due for completion in May
2021 which will be incorporated into the evidence base and final strategy in
June 2021.

1.2     A changing context
The economic context and environment has changed significantly in the past
12 months.
Covid-19
Since the last comprehensive strategy was developed for Leicester and
Leicestershire in March 2020 (The draft Local Industrial Strategy), much has
changed, new challenges have emerged, and additional strategies and action
plans have been published.
As we come out of the third national lockdown for England, the immediate and
long-term impacts of Covid-19 are significant, and could be far reaching for
certain industries and communities. Patterns of investment, employment and
how and where people work may change in the future.
The national impacts are revealing: GDP in November 2020 fell to 8.5% below
the levels seen in February 2020 and claimant unemployment has increased
to 2.6 million. Furloughs peaked at 8.9 million employments in May –
representing one-quarter of all workforce jobs.
Covid-19 has amplified existing inequalities in our communities, and the
impacts have been uneven both spatially and according to income group, age,
ethnicity and gender.
In particular, the industries that help shape the urban and rural experience –
retail, hospitality, and the visitor economy – have been severely affected.
Office-based activities that provide jobs and footfall for urban areas have also
been curtailed, with many people working from home.
The true impact of Covid-19 will not be known until the vaccination programme
nears completion, and relief programmes such as the Coronavirus Job
Retention Scheme (CJRS) have ended

Cambridge Econometrics                                                                      12
Leicester & Leicestershire Economic Recovery Strategy – Evidence Review

Brexit
The Brexit deal agreed in December 2020 has several implications in terms of
trade, customs and supply chains. The main features of the deal are
summarised below.
Trade in Goods. The agreement ensures that most goods traded between the
EU and U.K. won’t face new tariffs or quotas. However, British exporters will
face an array of regulatory hurdles that will make it more costly and
burdensome to do business in Europe, including rules of origin certification.
Cars will face special restrictions. Gasoline or diesel vehicles will need to be
made with at least 55% local content to escape tariffs. Electric and hybrid
vehicles will be allowed to contain 60% overseas content - but that will fall to
55% by 2026. Batteries will be allowed to contain 70% international content,
but that will drop over the same period of time to 50%. The absence of a
mutual recognition agreement means U.K. regulatory bodies won’t be able to
certify products for sale in the EU, a potentially big barrier to trade.
Financial Services. The deal offers little clarity for financial firms. There is no
decision on so-called equivalence, which would allow firms to sell their
services into the single market from the City of London. The agreement only
features standard provisions on financial services, meaning it doesn’t include
commitments on market access. No further progress has been made on this
since December 2020.
Level Playing Field. Both the EU and UK committed to upholding their
environmental, social, labour and tax transparency standards to make sure
they don’t undercut each other.
Customs. The UK has left the Customs Union. The accord largely commits the
EU and Britain to follow international practices aimed at minimizing customs
costs for businesses. However, in practice, over the last three months this has
proved to be particularly burdensome for businesses in several respects – the
new processes and paperwork require to clear customs and delays associated
with this, the end of groupage clearance (every item must be certificated); the
imposition of additional transport and processing fees; and the requirement for
EU purchasers to pay UK VAT in advance directly to HMRC.
Aviation. The EU has stopped short of granting automatic recognition to British
aerospace designs and products. Such recognition will be confined to minor
changes until the EU “gains confidence in the U.K.’s capability for overseeing
design certification.”
Haulage. Both sides commit to “good and efficient management of visa and
border arrangements for road hauliers, in particular across the U.K.-Union
border” and to “appropriately facilitate the entry and stay of” truckers.
Data Flows. The deal includes a temporary solution to keep data flowing
between the EU and U.K. until the bloc has adopted a data adequacy
decision.
Energy. The U.K. won’t have access to the EU’s internal energy market. This
was expected but there will be new arrangements in place by April 2022 to
make sure that trading is smooth and efficient on interconnectors - huge
power cables that run between the U.K. and Europe.

Cambridge Econometrics                                                                      13
Leicester & Leicestershire Economic Recovery Strategy – Evidence Review

Professional Services. The deal means that there will no longer be automatic
mutual recognition of professional qualifications. Doctors, nurses, dentists,
pharmacists, vets, engineers or architects must have their qualifications
recognized in each member state they wish to practice in, according to the
deal. However, the deal does create a framework for the recognition of
qualifications in future.
Business Travel. The U.K. and EU agreed that short-term business visitors
won’t need to hold work permits or undergo economic needs tests.
Agriculture. Trade of farm goods will benefit from the zero-tariff, zero-quota
terms between the two sides. U.K. agri-food consignments will have to have
health certificates and undergo sanitary and phyto-sanitary controls at
member states’ border inspection posts. Food and agri-products entering
Northern Ireland from Great Britain will be subject to checks and phyto-
sanitary controls.
The OBR has predicted that the economy will suffer a 4% drop in output over
the long-term from Brexit, even if the UK and EU sign a free trade deal. As
well as the need for recovery policies and programmes to build back the
economy and jobs lost, there will be pressures on the public finances due to
reduced tax revenues and increased expenditure as a result of the pandemic.

Cambridge Econometrics                                                                      14
Leicester & Leicestershire Economic Recovery Strategy – Evidence Review

2       Pre-Covid trends

2.1     The Leicestershire economy pre-Covid
According to the Leicester and Leicestershire draft Local Industrial Strategy
completed in March 2020, in 2019 the area generated £24.5 billion in GVA,
and had 42,065 businesses, with 538,000 jobs in the area. The diversity of the
economy in terms of its sector mix, is an important feature emphasised in
previous strategies and studies, as has been the dominance of
microbusinesses (1-4 employees) in the economy. Productivity rates in
Leicester and Leicestershire, at £30.91 in GVA per hour worked, 2019 were
below the England average (£33.99 GVA per hour worked). Population growth
in 2019 was four times the national average, at 1.2%. The claimant
unemployment rate was 1.4% in 2019.
Manufacturing is the largest broad sector in terms of employment – with
59,000 employees comprising 12.4% of the total (compared to the England
average of 9.8%). Managerial and professional jobs have grown significantly –
by 40,000, or 13% (from 240,000 to 280,000 jobs) between 2014 and 2019.
Notably, Operative and elementary; and Administration and Skilled trades had
shown little growth over this period, but continued to employ 269,000 people,
so continue to be significant. Earnings were a concern in the 2000s but
notably, growth was twice the national average between 2008 and 2013, and
earnings had risen in 2019.
The contrast between Leicester City and the surrounding rural area has been
emphasised in past economic strategies, notwithstanding the track record of
partnership working in the LEP and Strategic Growth Plan (a non-statutory
joint spatial plan). The mixed offer of sport, culture, retail and leisure of
Leicester City is complemented by the distinctive market towns surrounding it,
and natural capital such as the National Forest.

Cambridge Econometrics                                                                      15
Leicester & Leicestershire Economic Recovery Strategy – Evidence Review

                          2.2     The Covid-19 pandemic in Leicester and Leicestershire
                          Leicester and Leicestershire has been hit harder by the Covid-19 pandemic
                          than elsewhere in the country. As Figure 2.2.1 shows, current (February 2021)
                          caseloads in the county are still some 70% higher than the national average,
                          though this was preceded by a much gentler peak during the virus’ third wave
                          over Winter 2020-21. Entering Spring 2021, 1 in 14 Leicester and
                          Leicestershire residents are estimated to have returned a positive test for
                          Covid-19, compared to 1 in 16 across the rest of the country.
             Figure 2.2.1: Covid-19 caseloads (daily positive cases per 100,000 people, 2020-21)

             Source: HM Government, Cambridge Econometrics. Note: 7-day rolling average, by specimen date.
Table 2.2.1: Covid-19 caseloads (2020-21) and related deaths (2020 only)

                                    Total Covid-19          …per 10,000           Total Covid-19            …per 10,000
                                            cases             residents                   deaths              residents
 Leicester & Leicestershire                73,955                 697.4                    1,393                   13.1
 National average                        4,081,747                   611.1                 80,741                     13.6
 Blaby                                        6,476                  637.9                     128                    12.6
 Charnwood                                  11,410                   613.9                     206                    11.1
 Harborough                                   4,718                  502.9                     104                    11.1
 Hinckley and Bosworth                        5,565                  491.9                     144                    12.7
 Leicester                                  33,361                   941.8                     492                    13.9
 Melton                                       2,409                  470.4                      76                    14.8
 North West Leicestershire                    5,380                  519.2                     129                    12.5
 Oadby and Wigston                            4,636                  813.1                     114                    20.0
Source: HM Government, Cambridge Econometrics.

                          Cambridge Econometrics                                                                         16
Leicester & Leicestershire Economic Recovery Strategy – Evidence Review
Of course, this rate varies within the county, with Leicester and
Leicestershire’s performance particularly influenced by the city of Leicester, as
Table 2.2.1 shows. The city has accounted for almost half (45%) of all cases
in the LEP area, with 1 in 10 Leicester residents estimated to have returned a
positive test for Covid-19. Resultantly, the city has been under some form of
lockdown longer than any other city in the UK. Away from Leicester, caseloads
have been substantially lower, and generally in-line or below the national
average.
The health implications of the virus’ rapid spread in Leicestershire has been
telling; throughout 2020, 1,400 Covid-related deaths were recorded in the
county, at a rate of 13.1 per 10,000 people, marginally lower than the national
average (13.6). Just over two-thirds of these deaths were recorded within the
city of Leicester.
A number of risk factors have been identified that could explain
Leicestershire’s response to the virus. Table 2.2.2 explores a number of risk
factors that are more pronounced locally, particularly in Leicester, including
housing conditions, overcrowding, use of public transport, high Covid-risk
occupations, and a large Black, Asian and Minority Ethnic (BAME) population.
Table 2.2.2: Virus transmission risk factors
Proportion of:
Residents in Residents in Households Public Workers in
multi-unit multi- in transport high Covid-
housing generational overcrowded trips per risk
housing conditions 1,000 occupations
workers
Leicester &
8.5% 6.4% 7.3% 81.1 38.9%
Leicestershire
National average 15.9% 5.4% 8.5% 164.0 37.2%
Blaby 3.8% 4.4% 3.0% 60.1 -
Charnwood 7.4% 4.1% 5.0% 66.3 -
Harborough 4.7% 3.3% 3.1% 41.4 -
Hinckley and Bosworth 5.1% 3.2% 3.2% 38.6 -
Leicester 15.0% 11.0% 15.2% 149.2 41.3%
Melton 4.6% 3.2% 3.4% 40.8 -
North West Leicestershire 4.5% 3.6% 2.9% 28.3 -
Oadby and Wigston 4.9% 8.1% 4.3% 95.5 -
Source: ONS, Cambridge Econometrics. Note: all data is pre-Covid.
The risk of regular and prolonged inter and intra-household contact and
proximity indoors is made higher by the incidence of multi-unit housing, inter-
generational housing and overcrowded households. These are
disproportionately overrepresented in Leicester, particularly for low-earners
and those from ethnic minorities.
Alongside this are the significantly higher rates of public transport use in
Leicester, which has also been closely linked to virus transmission; workers in
the city are almost three times more likely to use public transport than
elsewhere in the county. Similarly, lower-income and ethnic minority workers
Cambridge Econometrics 17Leicester & Leicestershire Economic Recovery Strategy – Evidence Review
are more likely to rely on such forms of transport, whilst many will have
continued travelling during the pandemic for essential work.
Such groups are also more likely to work in occupations where the risk of virus
transmission is higher, such as health and care, transport, and education,
which are also overrepresented in Leicester. Finally, Leicestershire has a
highly diverse population with a greater share of BAME residents. Evidence
throughout the pandemic suggests such groups are at a disproportionate risk
of virus transmission and mortality, largely as a result of the aforementioned
factors1.
2.3 The headline economic impact and prospects for recovery
in Leicester and Leicestershire
Updated forecasts produced by CE (March 2021, presented in Figure 2.3.1)
incorporating the impact of the Covid-19 pandemic and the latest Brexit
developments indicate a comparatively short, but unprecedented, impact to
economic activity in Leicester and Leicestershire, but with a favourable outlook
relative to regional and national comparators.
Boosted by the furlough scheme and related labour market support (e.g. self-
employment support), alongside the desires of firms to retain staff in spite of
falls in output, employment is expected to prove much more resilient than
output, contracting by only 1% across the UK.
In fact, within Leicester and Leicestershire, net job losses could be negligible
compared to the national average. However, with the unwinding of furlough
support, labour market uncertainty will persist into 2021, before stronger jobs
growth picks up 2022-onwards with the momentum of a UK-wide recovery.
Output (i.e. GVA), meanwhile, is expected to recover quickly following a very
sharp bottoming-out in 2020. Given lower furlough uptake and a more resilient
labour market, output could decline by 7.3% (in real terms) in Leicester and
Leicestershire over 2020, significantly lower than the UK average of 8.4%.
However, this contraction is unprecedented compared to previous economic
crises; after the 2008 recession, the output hit was ‘only’ 4.8% in Leicester and
Leicestershire. There were however 13,500 net job losses during this time,
multiples of those expected during the pandemic.
Given the contrasting response of output and employment, productivity
consequently undergoes a sharp drop in 2021, further exacerbating Leicester
and Leicestershire’s ‘productivity puzzle’, although the recovery could be
productivity-led, driven by increased digitisation and automation triggered by
the pandemic.
1
The BMJ (2020), Covid-19: Increased risk among ethnic minorities is largely due to poverty and social
disparities
Cambridge Econometrics 18Leicester & Leicestershire Economic Recovery Strategy – Evidence Review
Figure 2.3.1: Forecast jobs (top) and GVA (bottom) impact and recovery from the Covid-19 pandemic,
2019-25
As Figure 2.3.3 shows, sectors such as retail, accommodation and food, and
arts and recreation are expected to be the hardest hit in Leicester and
Leicestershire, particularly short-term. Public administration and health, digital,
and real estate could prove resilient and emerge strongly post-Covid. The
sectoral dimension of the crisis is explored in greater detail in Chapter
Cambridge Econometrics 19Leicester & Leicestershire Economic Recovery Strategy – Evidence Review
Figure 2.3.3: Forecast GVA impact and recovery from the Covid-19 pandemic by broad sector, 2019-
25
Source: ONS, Cambridge Econometrics. Note: charts indexed to 100.0 in 2019.
Figure 2.3.33 considers the impact within Leicester and Leicestershire. North
West Leicestershire – with its higher incidence of impacted industries, such as
aviation, retail, and tourism – could be the hardest hit, but it is the only area in
the LEP area to underperform relative to the UK average. All areas are
expected to fully recover to pre-Covid levels of economic activity by 2023, in
line with the UK average, and all but two areas outperform the UK recovery.
Figure 2.3.2: Forecast GVA impact and recovery from the Covid-19 pandemic by local authority area in
Leicestershire, 2019-25
Source: ONS, Cambridge Econometrics. Note: charts indexed to 100.0 in 2019.
Cambridge Econometrics 20Leicester & Leicestershire Economic Recovery Strategy – Evidence Review
The long-term implications of the pandemic could however be significant. As
Figure 2.3.4 and Table 2.3.1 show; relative to a pre-Covid trajectory, CE’s
preliminary forecasts indicate that by 2030, as a legacy of the pandemic, the
Leicester and Leicestershire economy could expect to have in the region of
1,600 fewer jobs, output £800 million lower, and a workforce £1,300 per
annum less productive.
Figure 2.3.4: Leicester and Leicestershire’s pre- and post-Covid outlook, 2010-30
Source: ONS, Cambridge Econometrics. Note: pre-Covid outlook relates to CE’s January 2020 forecasts
Table 2.3.1: Leicester and Leicestershire’s pre- and post-Covid outlook, 2019-30
2019
Growth, % growth,
(forecast 2025 2030
2019-30 2019-30
baseline)
Employment (jobs) 550,800 559,400 568,300 17,400 3.2%
relative to pre-Covid outlook - -1,200 -1,600 -1,600 -0.3%
GVA (£bn) £26.8 £28.1 £30.2 £3.4 12.6%
relative to pre-Covid outlook - -£0.9 -£0.8 -£0.8 -3.0%
Productivity (£) £48,700 £50,300 £53,100 £4,500 9.2%
relative to pre-Covid outlook - -£1,500 -£1,300 -£1,300 -2.6%
However, it is important to set these trends within the wider national context;
as
Cambridge Econometrics 21Leicester & Leicestershire Economic Recovery Strategy – Evidence Review Table 2.3.2 shows, not only is the short-run impact expected to be less pronounced in Leicester and Leicestershire (see column 1), but its recovery could match and potentially exceed the UK average (column 2), resulting in a smaller relative ‘lost growth’ shortfall over the longer timeframe (column 3). Cambridge Econometrics 22
Leicester & Leicestershire Economic Recovery Strategy – Evidence Review

Table 2.3.2: Leicester and Leicestershire’s post-Covid outlook relative to the UK average

                            GVA impact, 2020             GVA recovery per           GVA shortfall relative
                             (relative to 2019)           annum, 2021-30          to pre-COVID-19, 2050
 Leicester and
                                         -7.3%                          2.0%                          -2.6%
 Leicestershire
 UK average                              -8.4%                          2.1%                          -4.0%
Source: ONS, Cambridge Econometrics.

             Cambridge Econometrics                                                                        23
Leicester & Leicestershire Economic Recovery Strategy – Evidence Review
3 Sectors, business and innovation
3.1 Introduction
This Chapter examines the economic performance and conditions facing
sectors, businesses and innovation prior to Covid, and analyses the impacts of
Covid. It also provides an overview of existing strategic priorities and adds
observations from the consultations and discussions to date.
It is worth noting, that a separate study is being conducted which will analyse
sector trends, specialisations and forecasts in more depth, which is being
used to inform the Economic Recovery Strategy.
3.2 The 2020 baseline
Strengths and challenges outlined in the draft Local Industrial Strategy
and MIT Reap submission
Enterprise
The 2020 draft Local Industrial Strategy highlighted the progress made since
2014 in increasing the size of the business base (+ 20% between 2014 and
2019), and in improving start-up and survival rates.
With 40 firms for every 1,000 residents, Leicester and Leicestershire was
above the East Midlands average of 42.8%. The challenges of many small
businesses operating in lower value-added and lower productivity sectors was
highlighted, with the priority to raise productivity rates across all businesses.
The MIT REAP submission, made in September 2020 also emphasised the
following performance characteristics:
- Above average composition of microbusinesses and freelancers, who are
more likely to operate below the official VAT/Pay-As-You-Earn (PAYE)
thresholds
- BIS Business Population Estimates for 2017 indicate that around 90 per
cent (89.8%) of businesses in Leicester and Leicestershire are micro
(employing 0-9 people) compared to 84 per cent for the UK as a whole
- Microbusinesses are particularly prevalent in textiles and fashion, design,
arts, media, music, and IT sectors, which at the local level equates to an
additional c20,000 businesses
Innovation
Within the Industrial Strategy, the government committed the UK to reaching
2.4 per cent of GDP investment in R&D by 2027 and 3 per cent of GDP in the
longer term.
In 2016, R&D spend of £573m across the across the Leicestershire, Rutland &
Northamptonshire NUTS2 region accounted for only 1.3 per cent of GVA.
In the period from 2010, levels of overall R&D expenditure in Leicestershire,
Rutland and Northamptonshire have remained relatively constant in real
terms, rising by only 0.6 per cent – well below the UK average of R&D
expenditure growth of 15.1 per cent over the same period.
Cambridge Econometrics 24Leicester & Leicestershire Economic Recovery Strategy – Evidence Review
The area also performs broadly in line with the rest of the UK for patent
applications, ranking 17th and 18th out of 37 NUTS2 regions for the rates of
non-high tech and high-tech patents, respectively.
A significant proportion of the area’s businesses were regarded as
underperforming in terms of productivity – with only three sectors performing
above the national average.
Leicester and Leicestershire’s innovation strengths were outlined in the draft
Local Industrial Strategy as:
• Three outstanding universities:
- Leicester University has five Research Institutes with specialisms in
space and earth observation, structural and chemical biology and
precision medicine
- De Montfort University has internationally acknowledged research
groups spanning cybersecurity, transport, clean energy, water,
advanced manufacturing and creative industries
- Loughborough University has expertise spanning advanced
manufacturing and engineering, data and digital technologies
(including med-tech, life and health sciences), logistics and textiles
technology
• Advanced engineering and aerospace (e.g. the Rolls-Royce University
Technology Centre at Loughborough University)
• Automotive – particularly at MIRA Technology Park, which hosts
automotive and engineering firms and expertise in its offices, laboratories
and workspaces. HORIBA MIRA works in close collaboration with vehicle
manufacturers and suppliers around the world, providing comprehensive
support ranging from individual product tests to turnkey engineering
design, development and build programmes.
• Space – with Space Park Leicester set to open in 2021, which will provide
a significant global hub for businesses, researchers, academia and
innovation
• Life sciences
• Sport
• Agri-tech
• International R&D intensive businesses: 3M Healthcare (Loughborough),
IBM Client Innovation Centre (Leicester), PepsiCo R&D Centre (Leicester),
Samworth Brothers and Mars Group
Knowledge intensive services are forming an increasing share of the local
workforce – comprising 238,600 jobs in 2018, and have increased by 2% per
year since 2000.
Scientific and technical occupations support 34,100 jobs - around seven per
cent of the total workforce, and representing one-in-eight additional jobs
generated across the area since the year 2000.
The MIT REAP submission, made in September 2020 also emphasised the
following performance characteristics:
Cambridge Econometrics 25Leicester & Leicestershire Economic Recovery Strategy – Evidence Review
- Research excellence in Leicestershire’s higher education institutions: 43
industry centres of excellence: 16 at Loughborough University; 16 at the
University of Leicester; and 11 at De Montfort University.
- Research excellence located within the Leicester Food Park (Food and
Drink) and the MIRA Technology Park (Automotive), as well as the applied
research present in the enterprise zones.
- £12.75m of turnover through Leicestershire’s university spin-outs (both
formal and with some HEP ownership) and the £110,000 turnover of
graduate start-ups in 2017/18 (HESA Intellectual Property metrics).
- University patents filed in 2017/18 (53), the number filed by external
partners naming a HE provider (353), number granted (105), and the
cumulative patent portfolio (684) for Leicestershire.
- Knowledge Transfer - 16 companies (SMEs) currently engaged in formal
knowledge transfer with HE providers, or conducting national R&D with
Innovate UK, amounting to 120 grants and knowledge transfer
partnerships to the value of £25m. This falls short of formal R&D
expenditure in other regions and LEP areas.
- Interest in knowledge exchange: 28,000 attendees at HE events in
2017/18 and 10,000 attendees each year at Leicester Business Festival
and Innovation Week.
- Significant number of established R&D sites and facilities, accelerators
and incubators, maker/hacker/fab labs, co-working spaces, and events.
- Survey evidence reveals significant innovation activity and interest, skills
as a barrier to growth, and low awareness of finance options for growth
Sector priorities
In the 2014-2020 Strategic Economic Plan and in the 2020 draft Local
Industrial Strategy, there were a number of sectors and activities which were
highlighted.
• The most important sectors in terms of total employment included
Manufacturing, Logistics, Education, Health and Retail.
• Strong sector specialisations included Manufacturing, Logistics, Education,
Motor Trades, and Mining, quarrying and utilities.
• Sectors that had lower shares of employment, but made a high GVA
contribution included Professional, scientific and technical activities,
Finance and insurance, ICT, and Property.
• Sectors and activities with strong levels of R&D activity and specialisms
included:
- Space and satellites
- Automotive, including autonomous and electric vehicles
- Sports science
- Life sciences and medtech
- Food & drink and agritech
- Cyber security
Cambridge Econometrics 26Leicester & Leicestershire Economic Recovery Strategy – Evidence Review
Cultural, leisure and tourism industries were also emphasised in the draft
Local Industrial Strategy – with the visitor economy generating £1.88bn for the
local economy in 2018 and supporting 23,076 jobs. The lack of awareness
and knowledge of Leicester and Leicestershire as a visitor destination was
highlighted as a challenge.
Sector prioritisation was made with the aim of increasing jobs, productivity,
earnings and GVA. In the 2014 SEP, the following sectors were prioritised:
Logistics, High tech manufacturing, Food and drink manufacturing, Business
and financial services, Tourism and hospitality and Creative design. New
sector development was also prioritised in Low carbon, Space, and Life
sciences. It was acknowledged that Health and social care, and Retail were
big employers and important to monitor as core sectors.
In the 2020 draft LIS, sector prioritisation was much the same as the 2014
SEP, with perhaps additional emphasis on Automotive and autonomous
vehicles.
The 2014 SEP emphasised the need to engage more businesses in
innovation and with the universities, to help increase knowledge intensive
business growth and jobs.
There are a number of key sites that are strongly related to sector specialisms,
and where geographical clustering has been supported and enhanced, and
significant progress has been made:
• Space and satellites: Space Park Leicester opened in 2020, with Phase 3
underway; and £14m funding for METEOR
• Autonomous and electric vehicle assets: MIRA and Bruntingthorpe proving
ground
• Sport and Sports science: SportPark Lougborough
• LUSEP Is one of the UK’s largest science parks, part of the Enterprise
Zone and already home to 75 innovating businesses and 2200 jobs across
a range of sectors.
• Life sciences, medical (particularly cardiovascular, respiratory, diabetes,
cancer and regenerative medicine) and medtech, health data: Charnwood
Campus Life Sciences Opportunities Zone. The construction of the
Defence Health and Rehabilitation Centre has also enhanced the life
sciences sector.
• Cyber Security – De Montford – Academic Centre of Excellence
• Logistics – SEGRO Logistics Park; Freeport
3.3 Recent trends and outlook
All businesses have been impacted in some way by the Covid pandemic and
Brexit. The type of activity that a business engages in determines the extent to
which the impacts have been highly negative, slightly negative, or, in some
cases, positive.
Cambridge Econometrics 27Leicester & Leicestershire Economic Recovery Strategy – Evidence Review
Leicestershire’s sectoral structure could insulate it from the worse
of the long-term economic effects
Analysis by the Centre for Cities (adapted in Figure 3.3.1) shows that pre-
Covid the Leicestershire economy had a lower relative incidence of jobs in
‘vulnerable’ and ‘very vulnerable’ sectors - these are activities that are
expected to experience a discernible and lasting impact from the pandemic
and/or Brexit, including sectors such as accommodation, food service,
transport (notably automotive and aviation), leisure, and some retail.
The city of Leicester was ranked as having the fifth lowest share of such jobs
in the country, accompanying Oxford and Cambridge as “places [that] are
expected to bounce back more quickly”2. Such proportions still equate to a
significant number of jobs though; 117,000 in Leicestershire, encompassing
12,000 local employers (the majority, some 99% of whom, are SMEs).
Short-term, such sectors have been highly reliant on furlough and related
support. Longer-term though there is an increased risk of job losses and
business dissolutions, particularly with the reduction or winding down of any
support.
Figure 3.3.1: Proportion of pre-Covid (2019) jobs in ‘vulnerable’ and ‘very vulnerable’
sectors
Source: Centre for Cities, ONS, Cambridge Econometrics.
Table 3.3.1 looks in greater detail at the sectoral composition of these jobs.
Tourism, retail and leisure – which has been highly disrupted by the pandemic
and social distancing measures - account for 58,000 (50% of all) ‘vulnerable’
and ‘very vulnerable’ jobs in Leicestershire. Conversely, the 30,000 jobs in
machinery, automotive and metals are at risk largely due to Brexit and other
factors. Fossil fuels and mining, facing additional pressures alongside the
pandemic and Brexit, account for a further 9,000 at-risk jobs.
2
Centre for Cities (2020), What does the COVID-19 crisis mean for the economies of British cities and large
towns?
Cambridge Econometrics 28Leicester & Leicestershire Economic Recovery Strategy – Evidence Review
Table 3.3.1: Composition of ‘vulnerable’ and ‘very vulnerable’ sectors in Leicestershire (2019)
Within Leicestershire
Jobs Proportion Businesses Proportion
Sector classification
affected of total jobs affected SME
Vulnerable sectors, of which: 48,410 10.0% 4,635 98.6%
Retail & wholesale (excl. food, drug or other
16,885 3.5% 2,185 100.0%
“demanded products”)
Machinery & equipment 11,655 2.4% 865 97.7%
Basic metals & metal products 8,140 1.7% 705 96.5%
Transport (excl. air & freight transportation) 3,775 0.8% 395 97.5%
Rubber & plastics 3,575 0.7% 160 100.0%
Non-metallic minerals 2,295 0.5% 70 100.0%
Mining 1,635 0.3% 35 85.7%
Film & video production 450 0.1% 220 97.7%
Very vulnerable sectors, of which: 68,715 14.3% 7,415 99.1%
Tourism & business travel 29,475 6.1% 2,915 99.8%
Leisure (incl. sports, amusement parks, arts
11,165 2.3% 1,095 97.3%
facilities, etc.)
Automotive & parts (whole value chain, incl.
10,135 2.1% 1,805 100.0%
tyres)
Fossil fuel producers & distribution 7,625 1.6% 125 92.0%
Services that cannot performed at home or
offered online, nor be postponed (e.g. hair & 5,755 1.2% 1,235 98.8%
beauty)
Aviation 4,560 0.9% 240 97.9%
Very vulnerable or vulnerable total 117,125 24.3% 12,050 98.9%
Source: Centre for Cities, ONS, Cambridge Econometrics.
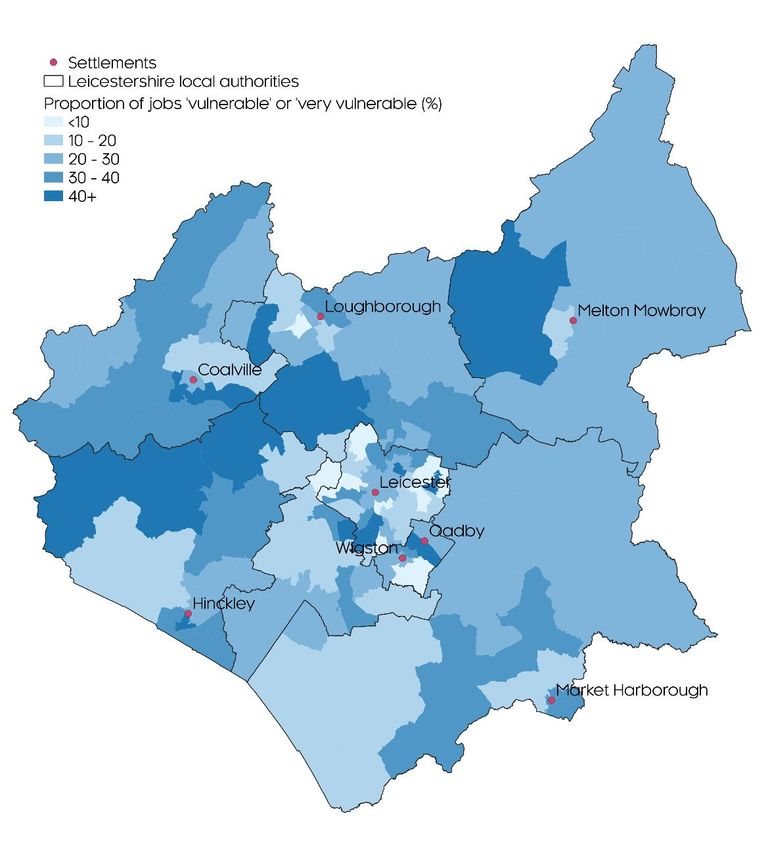
Spatially, the distribution and composition of ‘vulnerable’ and ‘very vulnerable’
jobs varies across Leicestershire, as Figure 3.3.1 and Figure 3.3.3 shows.
Over a third (31%) of all jobs in North West Leicestershire are classified as
such, with 7,000 jobs alone in the district related to tourism, travel and
aviation. A similar share is observable in Hinckley, which has 4,000 jobs in
automotive and machinery. After Leicester (19%), Blaby has the lowest share
in county, with only 22% of all jobs classified as ‘vulnerable’ and ‘very
vulnerable’.
Resultantly the disruption to business activity is expected to be
less severe locally, but still substantial
Given this favourable sectoral structure, the overall disruption to business
appears to have been gentler locally; payroll data presented in Figure 3.3.4
shows employers in Leicester and Leicestershire3 have been the least likely in
the country to have made redundancies since March 2020 (joint with Cornwall,
out of 41 areas). Local wages and hours worked have also been resilient, with
the former increasing by 3.4% in real terms (ahead of a 2.8% increase
nationally).
3
The Leicestershire NUTS2 geography, which also includes Rutland and Northamptonshire.
Cambridge Econometrics 29Leicester & Leicestershire Economic Recovery Strategy – Evidence Review
The scale of the disruption is still significant though; by Summer 2020, across
the UK, GDP had contracted by as much as 25%, accompanied by some
655,000 redundancies, whilst 410,000 businesses were undergoing
dissolution. This contrasts to a 6.3% contraction in GDP and redundancies of
1.7 million during the peak of the 2008-09 recession. Critically, the disruption
has been sectorally uneven, concentrated in a few, mostly consumption and
interaction-driven activities (
Table 3.3.2) – notably accommodation and food, arts and entertainment, retail
and other services.
Figure 3.3.2: Proportion and composition of pre-Covid (2019) jobs in ‘vulnerable’ or ‘very
vulnerable’ sectors across Leicestershire
Source: Centre for Cities, ONS, Cambridge Econometrics.
Cambridge Econometrics 30You can also read