Technology Components - Foldable smartphone, finally unfolding - CIMB Group
←
→
Page content transcription
If your browser does not render page correctly, please read the page content below
December 7, 2018

                         Technology Components
                         Foldable smartphone, finally unfolding
NAVIGATING SOUTH KOREA

                         SOURCE: LETSGODIGITAL

                         ■ Samsung Electronics (SEC) plans to introduce its long-awaited foldable
                           smartphone in 1Q19, followed by other smartphone set-makers in 2019-20F.
                         ■ With unmatched technological prowess and track record in flexible OLED,
                           we think Samsung Display (SDC) and its supply chain will be beneficiaries.
                         ■ Given the steep hike in component dollar content for foldable devices vs.
                           conventional smartphones, we see trading opportunities in this sector.

                         Analyst(s)
                         Jun LIM
                         T (82) 2 6730 6130
                         E jun.lim@cgs-cimb.com

                         IMPORTANT DISCLOSURES, INCLUDING ANY REQUIRED RESEARCH CERTIFICATIONS, ARE PROVIDED AT THE           Powered by
                         END OF THIS REPORT. IF THIS REPORT IS DISTRIBUTED IN THE UNITED STATES IT IS DISTRIBUTED BY CGS-CIMB    the EFA
                         SECURITIES (USA), INC. AND IS CONSIDERED THIRD-PARTY AFFILIATED RESEARCH.                              Platform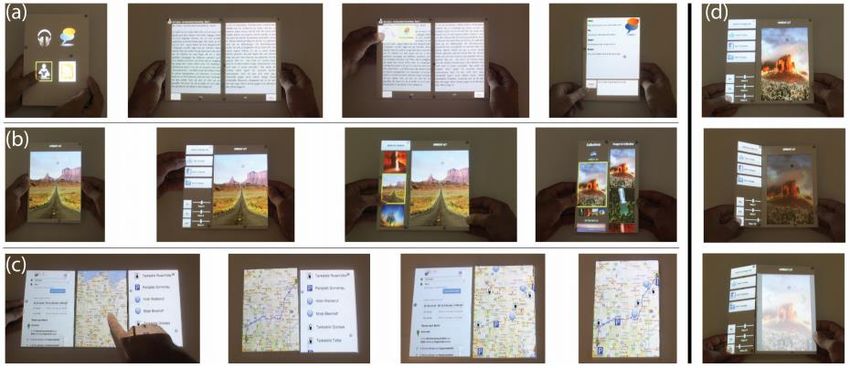
Navigating South Korea
                                                Technology │ Technology Components │ December 7,2018

TABLE OF CONTENTS

PROLOGUE........................................................................................................ 5

INTRODUCTION................................................................................................. 6
  Smartphone industry – ripe for a change .......................................... 6
  Foldable smartphones – finally a commercial reality        ....................... 7
  The value proposition of a foldable smartphone      ............................ 10

INVESTMENT THESIS ..................................................................................... 13
  Sector investment strategy ............................................................... 13
  Samsung SDI (006400 KS, Add, TP: W345k) ................................. 23
  SKC Kolon PI (178920 KS, Hold, TP: W37k) .................................. 25
  Kolon Industries (120110 KS, Reduce, TP: W44k) ......................... 26
  BH Co Ltd (090460 KS, Add, TP: W20k) ........................................ 28

INDUSTRY FORECASTS ................................................................................. 29
  Shipment forecasts .......................................................................... 29
  Pricing .............................................................................................. 32

SUCCESS FACTORS ...................................................................................... 35
  Foldable smartphone coinciding with 5G – complementing each other                                               37

PRODUCT CONCEPTS ................................................................................... 39
  Samsung Electronics (005930 KS, Add, TP: W53k; SEC) .............. 39
  Royole Corp (Unlisted) .................................................................... 41
  Huawei (Unlisted) ............................................................................ 42
  Apple (APPL US, Not Rated) .......................................................... 43
  LG Electronics (066570 KS, Add, TP: W120k; LG) ........................ 44
  Oppo (Unlisted) ............................................................................... 45
  Motorola (MOT US, Not Rated) ....................................................... 46

KEY ENABLING TECHNOLOGIES ................................................................. 47
  User interface (UI)            ........................................................................... 59

BENEFICIARIES .............................................................................................. 60

RISKS ............................................................................................................... 65
  Radical design changes may cause objections                     ............................. 65
  Economies of scale   ........................................................................ 65

CONCLUSION .................................................................................................. 65
  Foldable smartphones poised to be a game changer; enticing trading opportunities await                                   65

APPENDIX ........................................................................................................ 66
  What is OLED? ................................................................................ 66
  Glossary .......................................................................................... 67

                                                                               2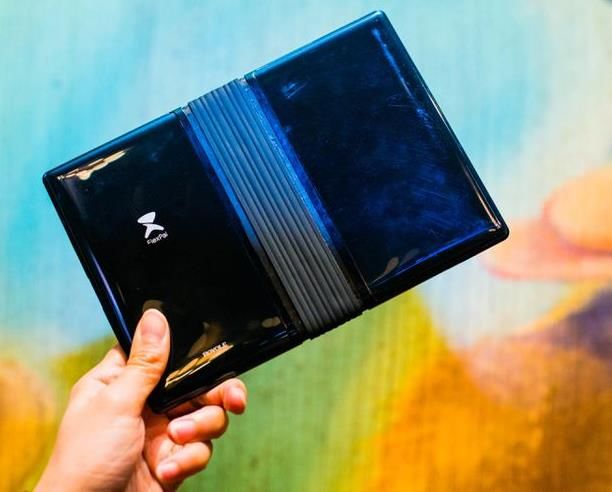
Sector Note                                          Navigating South Korea │ Technology Components │ December 7, 2018

   South Korea
Neutral (no change)
                                                     Technology Components
Highlighted Companies                                Foldable smartphone, finally unfolding
Samsung SDI
(Add, TP: W345k, W208,000 close)                     ■ Samsung Electronics (SEC) plans to introduce its long-awaited foldable
                                                       smartphone in 1Q19, followed by other smartphone set-makers in 2019-20F.
For foldable smartphones, SDI supplies:
                                                     ■ With unmatched technological prowess and track record in flexible OLED, we
1) OLED materials (blue dopant), 2)                    think Samsung Display (SDC) and its supply chain will be beneficiaries.
adhesives, and 3) batteries. Its product
                                                     ■ Given the steep hike in component dollar content for foldable devices vs.
pipeline includes polariser and green
                                                       conventional smartphones, we see trading opportunities in this sector.
host. SDI is our top pick for its well-
diversified portfolio, especially for the
                                                     A new chapter unfolds for the smartphone industry
non-smartphone business.
                                                     The arrival of the long-awaited foldable smartphone is just around the corner, with SEC
SKC Kolon PI                                         planning to launch the first model in 1Q19F. SEC’s supply chain started commercial
(Hold, TP: W37k, W30,550 close)                      production of the foldable phone in 3Q18. SEC’s foldable smartphone model, Galaxy F,
SKPI is an upstream supplier of graphite             will feature a 7.3” vertical in-fold (book-shaped) foldable OLED screen on one side and a
sheets     and   FPCBs      for   SEC’s              4.6” flexible OLED on the front. The clamshell form factor facilitates usage as a tablet
smartphones. For Galaxy F, SKPI will                 when unfolded and as a conventional bar-type smartphone when folded.
supply foldable OLED base film.
                                                     Downtrend in smartphone demand to trough in 2020F
BH Co Ltd
                                                     Over the past 20 years, the handset industry has gone through numerous cycles of: 1)
(Add, TP: W20k, W16,400 close)
                                                     innovation and revitalised demand, followed by 2) commoditisation and stagnant demand.
BH is the main OLED FPCB vendor for                  The industry is now in full downswing into commoditisation, in our view, with declining
SDC (c.65% market share in 2017);                    sales volume since 2016. However, the foldable smartphone launch and adoption of 5G
given the growth in FPCB dollar content              wireless network lead us to expect a refreshed upcycle starting at end-2020F. Based on
per device, BH would benefit directly                our forecasts (base case), we expect: 1) global foldable smartphone sales volume to rise
from the proliferation of SDC’s foldable             from 4m units in 2019F to 39m in 2022F, and 2) the share of foldable smartphones in
OLED displays, in our view.                          global smartphone revenue to increase from 1.3% in 2019F to 9.2% in 2022F.
Kolon Industries
(Reduce, TP : W44k, W51,700 close)                   Key components
                                                     Foldable smartphones will require a complete overhaul in hardware components; we
Kolon Industries manufactures colourless             estimate the initial bill of materials (BOM) cost for Galaxy F will be 69% higher than that
CPI film and operates the world’s first              of Galaxy S9+, implying dollar content growth. Hence, we advise investors to focus on: 1)
CPI mass production plant. Although                  new components – i.e. cover window, base film, adhesives, casing hinge, and 2)
SKPI is a close rival, we expect Kolon               incremental component dollar content hikes per smartphone (substrate, battery, OLED
Industries to become the key CPI                     materials). We expect limited implications for camera modules, storage, etc. In the long
supplier to the global market in long term.          run, we expect OLED equipment names to benefit, once the foldable smartphone trend
                                                     triggers another upturn in capex cycle for the global flexible OLED industry.
Summary Valuation Metrics
P/E (x)
Samsung SDI
                      Dec-18F
                         19.9
                                 Dec-19F Dec-20F
                                    11.7      9.3
                                                     Samsung Display and its supply chain for the win
SKC Kolon PI             23.5       16.4    12.9     We retain a Neutral sector view given the downturn in the smartphone industry which we
BH Co.                     7.5        5.1     3.8
Kolon Industries         12.6       10.9      9.5    believe will last until 2019F. However, the foldable smartphone trend is a potential share
                                                     price catalyst for companies in the supply chain, which we view as trading buy
P/BV (x)              Dec-18F    Dec-19F Dec-20F
Samsung SDI                1.2        1.1     1.0    opportunities ahead of the launch of the first foldable smartphone by Samsung in the first
SKC Kolon PI               3.4        3.1     2.8
BH Co.                     2.6        1.7     1.2
                                                     week of Jan 2019. We anticipate further re-rating upon the foldable smartphone’s positive
Kolon Industries           0.6        0.6     0.5    reception by consumers. Depending on the speed of foldable smartphone proliferation,
Dividend Yield        Dec-18F    Dec-19F Dec-20F     we advise investors to accumulate: 1) stocks on the non-display supply chain and 2)
Samsung SDI             0.5%       0.5%    0.5%      equipment manufacturers in long run. Risks are poor consumer acceptance and lower-
SKC Kolon PI            3.2%       4.6%    5.8%
BH Co.                  0.0%       4.1%    5.5%      than-expected rate of proliferation of the foldable smartphone.
Kolon Industries        1.6%       1.9%    2.2%

Analyst(s)

                                                       Figure 1: Timeline for foldable smartphone model releases by set-makers

                                                                 1H19F                             2H19F                   1H20F                 2H20F

Jun LIM
T (82) 2 6730 6130
E jun.lim@cgs-cimb.com
                                                                                                                     SOURCES: CGS-CIMB RESEARCH ESTIMATES

IMPORTANT DISCLOSURES, INCLUDING ANY REQUIRED RESEARCH CERTIFICATIONS, ARE PROVIDED AT THE END OF THIS REPORT. IF THIS REPORT IS DISTRIBUTED IN      Powered by EFA
THE UNITED STATES IT IS DISTRIBUTED BY CGS-CIMB SECURITIES (USA), INC. AND IS CONSIDERED THIRD-PARTY AFFILIATED RESEARCH. EFACustomEntityStatement          Platform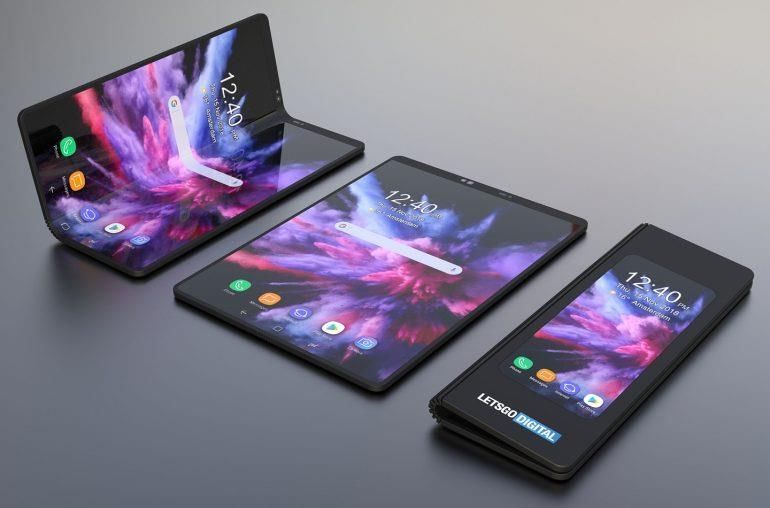
Navigating South Korea
Technology Components │ December 7, 2018
KEY CHARTS
Foldable smartphone form factor
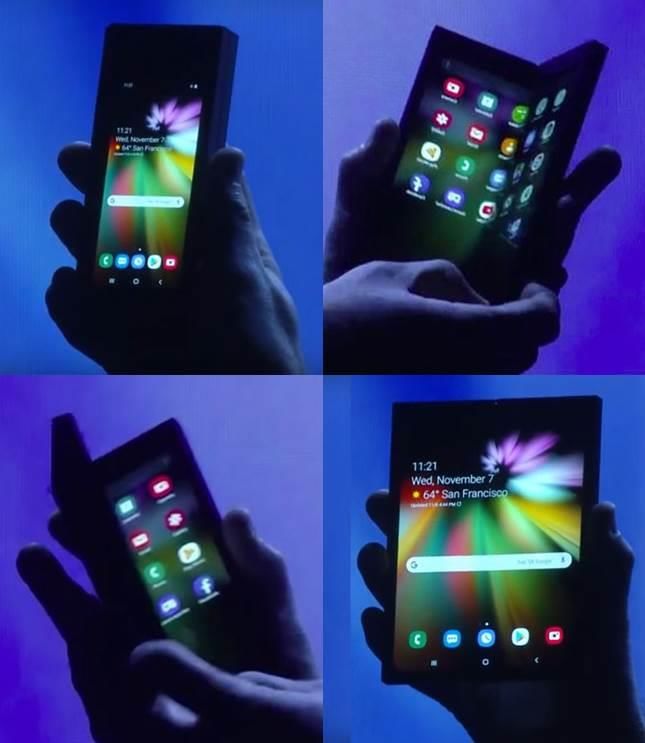
SEC plans to launch Galaxy F, its first-generation foldable Galaxy F form factor (CGS-CIMB forecast)
smartphone in 1Q19F. The Galaxy F model will feature
one foldable OLED display that folds in like a book and
opens up to 7.3’ to offer a tablet-like viewing experience
(richer vs. smartphone). Once closed, a smaller display on
the outside (called a cover display) sized 4.6’ allows users
to perform the same tasks as on a conventional
smartphone.
Sales and penetration outlook (m units)
45 3.0%
In our base-case scenario, we forecast foldable Foldable smartphone sales and penetration rate
40 forecast (base case)
smartphones shipment volumes of 4m/13m/24.5m/39m 2.5%
units in 2019F/20F/21F/22F, translating into a CAGR of 35
114% over 2019-22F. Our bull-case scenario, assuming 30 2.0%
faster-than-expected erosion in bill of materials (BOM), 25
1.5%
features 151% shipment volume CAGR (from 4m units in 20
2019F to 72m units in 2022F) over the same period. Our 15 1.0%
bear-case scenario, assumes: 1) the foldable smartphone
10
fails to solidify its position in the high-end smartphone 0.5%
market, and 2) slower-than-expected BOM cost erosion. 5
Under our bear-case scenario, we estimate shipment 0 0.0%
2018 2019F 2020F 2021F 2022F
volume CAGR of 89% (from 4m units in 2019F to 24m Global foldable smartphone sell-through volume (m units)
units in 2022F) over the same period. % of global smartphone penetration (RHS)
Foldable OLED and component dollar content (US$)
hike 700 BOM cost comparison of Galaxy F vs. Galaxy S9+
The hike in component dollar content hike arising from the 600
introduction of foldable smartphones is inevitable, in our 500
view, as the form factor for the phone will be radically
400
different from conventional smartphones. Although foldable
OLED displays share much of the fabrication technology 300
and equipment used for the manufacturing of existing 200
flexible OLED (curved) displays, many key components 218.8
100
(cover window, adhesives, substrate) require a complete 79.0
overhaul to achieve foldability. Therefore, we expect 0
Galaxy S9+ (as at 22 Mar 2018) Galaxy F (based on our forecast as at Dec 2018)
battery, circuitry and hinge manufacturers to see a hike in Display/Touch module Cameras Mechanical/Electro-Mechanical
component dollar content per foldable device vs. the Application processor
Memory
Power management IC
RF/PA/front-end
Bluetooth/WLAN
Sensors
conventional flagship models. Battery pack(s) Box contents Other contents
Panel makers with large scale to win 100%
Global mobile OLED shipment share
100%
Global mobile OLED capacity share
Despite the rising threat of competition, we expect 90% 90%
Samsung Display (SDC) and its supply chain to dominate 80% 80%
the initial demand for foldable OLED panels given: 1) their 70% 70%
superior track record in flexible OLED, 2) unmatched 60% 60%
technological prowess in production in flexible OLED 50% 50%
40% 40%
fabrication (in our view), and 3) captive customer base.
30% 30%
Most importantly, given their unrivalled scale of flexible 20% 20%
OLED production vs. peers, we expect SDC and its supply 10% 10%
chain to set the standard and lead the industry’s shipment 0% 0%
volume growth. 1Q16 3Q16 1Q17 3Q17 1Q18 3Q18 1Q16 3Q16 1Q17 3Q17F 1Q18F 3Q18
Samsung Display Others Samsung Display Others
SOURCES: CGS-CIMB RESEARCH, COMPANY REPORTS, IHS MARKIT
4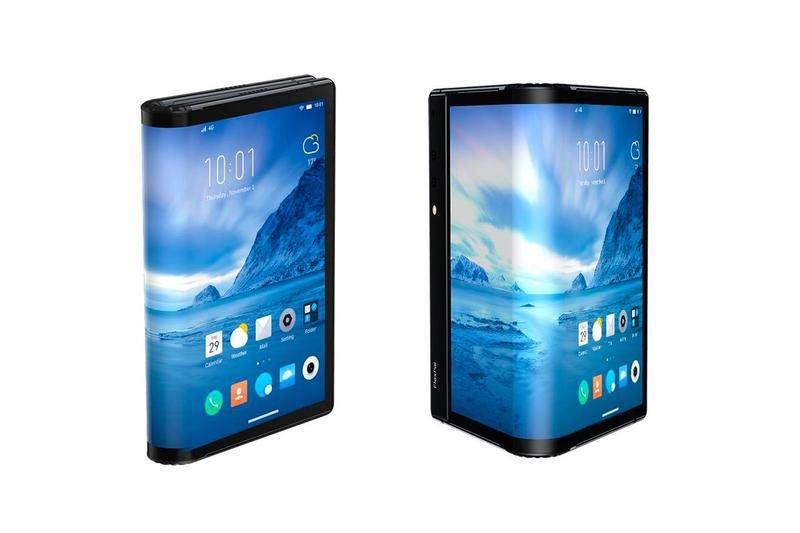
Navigating South Korea
Technology Components │ December 7, 2018

PROLOGUE
Smartphones have played the role of custodian of our lives and the mobile
industry has been transforming everything around us. The smartphone is small
enough to carry around everywhere, yet powerful enough to handle most daily
tasks and equipped with enough sophisticated cameras, sensors, and displays
to create an excellent user experience.
Up till now, we believe the form factor reference point for smartphones has been
the original iPhone – a flat, bar-type handset with touch controls, a revolutionary
mobile hardware back then. New form factors are bound to be tested and
explored by the major players in hopes of capturing a new wave of smartphone
sales. The smartphones of today, with their edge-to-edge displays, high
computing power, DSLR-like cameras and voice assistants, are impressive but
they are merely refinements of the initial ground-breaking iPhone, in our view.
We believe this version of our most personal gadget is about to be outdated
given the saturated industry with maturing commoditisation.
Every technological trend waxes, then wanes; the handset is no different. For
the past 20 years, there have been numerous cycles of 1) innovation and
revitalised demand, followed by 2) commoditisation and stagnated demand in
the handset industry. Since 2016, we have been in a full downswing into
commoditisation of the flat smartphone with declining demand volume. In
response, set-makers have sought a non-conventional out-of-the-box design
that will herald the next evolution in mobile communications. We are at the
initiation point of the next paradigm shift, in our view. We believe the foldable
smartphone is poised to be the next smartphone form factor revolution after the
original iPhone and expect the foldable smartphone to reinvigorate demand for
high-end smartphones and their respective value chains. It is our view that the
smartphone industry will see a newly-refreshed upcycle from end-2020F.
In this report, we: 1) introduce the background and different concepts of the
foldable smartphone, 2) present the key enabling technologies, 3) highlight
subsequent value content changes in the foldable smartphone, and 4) provide
our investment thesis for the respective beneficiaries in Korea.

                    5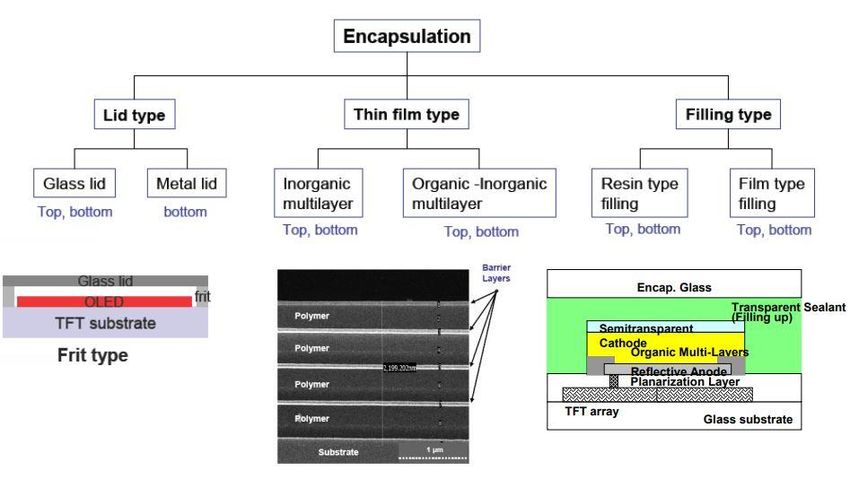
Navigating South Korea
                                                             Technology Components │ December 7, 2018

                                                             INTRODUCTION
                                                             Smartphone industry – ripe for a change
                                                             Smartphone volume sales could decline 3% yoy in 2018F, after recording 3%
                                                             yoy growth in 2017, according to Counterpoint. At the same time, the
                                                             commoditisation of the smartphone industry is continuing to put pressure on
                                                             smartphone prices. Global smartphone sales value increased by 9% yoy in 2017
                                                             (according to GfK Research), and we expect the growth to decelerate to +3%
                                                             yoy in 2018F. Profitability among the smartphone set makers is becoming harder
                                                             to protect as component cost hikes, driven by ever-intensifying spec competition,
                                                             have outpaced the ASP hikes of smartphones. Given the zero-sum game in
                                                             volume demand and lengthening replacement cycle, we believe the smartphone
                                                             set-makers must find a way to increase ASPs in order to resume revenue growth.
                                                             This would have to be in the form of a clear product differentiation strategy, in
                                                             our view.
                                                             We believe the unrelenting smartphone upgrade cycle over the past 10 years
                                                             has made consumers less interested in upgrades – i.e. better resolution, bigger
                                                             battery, more cameras. The needs of a maturing market, coupled with
                                                             technologies at their peak, are becoming the reasons why industry growth is
                                                             stagnating.
                                                             Smartphone set-makers are seeking to differentiate themselves from others, in
                                                             search of a reason to put a higher price tag on their phones to make up for the
                                                             declining underlying demand volume. In other words, it is our view that we are
                                                             heading towards a commoditisation stage in a full downswing.

Figure 2: Global smartphone sales value                      Figure 3: Global smartphone shipment                      Figure 4: Global smartphone replacement
                                                             volume (sell-in)                                          cycle trend
(US$bn)                                                       (bn units)                                                (months)
 600                                                   25%   2.0                                                 50% 30                                               29.5
                                                                                                                                                              29.0
                                                                                                                       29
                                       479     492                                                                                                   28.0
 500                                                                                         1.52   1.56         40%
                               440                     20%   1.6                  1.46                                 28
                        398                                                1.30                                        27
 400            380                                                                                              30%                       26.0
          330                                          15%   1.2                                                       26
                                                                    1.02
 300                                                                                                             20% 25            24.5

                                                       10%   0.8                                                       24
 200                                                                                                             10%
                                                                                                                       23   22.4
                                                       5%    0.4                                                       22
 100                                                                                                             0%
                                                                                                                       21

   0                                                   0%    0.0                                                 -10% 20
       2013     2014   2015    2016    2017   2018F                 2013   2014   2015       2016   2017 2018F              2013   2014    2015      2016     2017    2018F
                                                                                                         (YTD)
                       Global smartphone sales value                        Global smartphone shipment volume
                       yoy growth (%, RHS)                                  yoy growth (%, RHS)                                        Smartphone replacement cycle

       SOURCES: CGS-CIMB RESEARCH, GFK RESEARCH                       SOURCES: CGS-CIMB RESEARCH, COUNTERPOINT              SOURCES: CGS-CIMB RESEARCH, RECON ANALYTICS

                                                                                         6
Navigating South Korea
Technology Components │ December 7, 2018

Foldable smartphones – finally a commercial reality
A new chapter in the smartphone industry is about to unfold - the long-awaited
foldable phone is just around the corner, with major smartphone set-maker.
Samsung Electronics (SEC, 005930 KS, Add, TP: W53k) scheduled to launch
the first foldable smartphone, the Galaxy F, in 1Q19F. Several smartphone set-
makers have also announced plans to launch foldable smartphone models in
2019-20F. Huawei (Unlisted) has publicly announced its plan to launch a
foldable smartphone by 1H19F. According to tech media outlets such as
LetsGoDigital and GSMArena, LG Electronics (066570 KS, Add, TP: W120k)
and Oppo (Unlisted) are also revealing their foldable smartphones at Consumer
Electronics Show 2019 and Mobile World Congress (MWC) 2019, respectively.
Apple (AAPL US, Not Rated), too, is working on releasing one by 3Q20F, based
on our channel checks. We do not believe that the initial foldable smartphone
shipment volumes will be close to those of the major smartphone set-makers’
flagship models, and the set-makers would release smaller batches on a trial
basis at first.
The management of renowned smartphone makers have made it clear that they
hope to make the foldable smartphone “the next big thing”. During the IFA 2018
(world’s largest trade show for consumer electronics and home appliances) on
6-11 Sep 2018, Huawei’s CEO Richard Yu asked, “Why are you still using a
computer? Probably because the smartphone display is too small for you. We
will change that”. DJ Koh, CEO of Samsung’s IT and Mobile Communications
(IM) division, was quoted by the media as saying that “it is time to deliver” in
reference to the foldable Galaxy smartphone. He added that “every feature,
every innovation should have a meaningful message to our end-customer.” Koh
said that he “didn’t want to lose the world’s first title” and promised that SEC’s
foldable smartphone would be the first to market. In contrast, Hwang Jeong-
hwan, the CEO of LG’s Mobile division, told the media that, “We will release [the
foldable smartphone] at a time when we can provide enough customer value
rather than releasing it for the first time in the world”.
Royole Corp (Unlisted), a little-known display manufacturer, beat major
smartphone set-makers to the title of the ‘world’s first commercial foldable
smartphone’ with its ‘FlexPai’ model. However, we do not see Royole posing a
threat to sales of the likes of SEC. The first foldable smartphone by a global
major set-maker, SEC, will be sold to the public in 1Q19F, after being unveiled
at the Consumer Electronics Show (CES) on 8-12 Jan 2019. It will feature one
foldable OLED display that folds like a book and opens up to 7.3’, to offer a
tablet-like viewing experience (richer vs. smartphone). Once closed, a smaller
display on the outside (called a cover display), sized 4.6’, allows users to
perform the same tasks as on a conventional smartphone.

                    7
Navigating South Korea
Technology Components │ December 7, 2018

Figure 5: Timeline for foldable smartphone model releases by set-makers, based on our
estimates

       1H19F                              2H19F                 1H20F                       2H20F

                                                             SOURCES: CGS-CIMB RESEARCH, COMPANY REPORTS

Figure 6: Evolution of smartphone displays for conventional form factor at mature
stage

 Screen size                                                             Limited to 7.x’’, due to ergonomics

          Resolution                                                     Limited to QHD+, due to mobile
                                                                         foundation
 From 3.5’’                  Narrow bezel / wide- display
 to 6.x’’                                                                Expected to reach the limit in 2019F
              From VGA
              to QHD
                                                Notch
 Average                                                                 Screen body ratio expected to hit peak
                             From wide bezel                             (c. 93%+) in 2019F (without notch)
 screen
              FHD is still   & home button
 size                                           Maximising
              the most       to narrow bezel-
 increased                                      screen to
              popular        less design
 to 5.x’’                                       body ratio
              resolution
                                                over 80%

                                                                               SOURCES: CGS-CIMB RESEARCH

                              8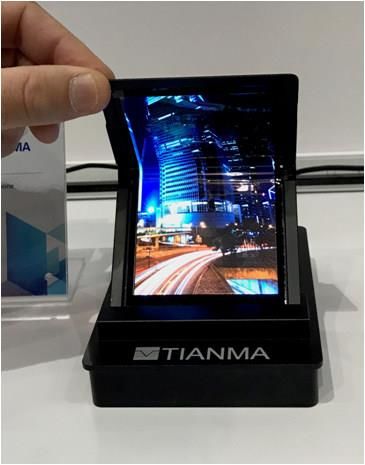
Navigating South Korea
                                                  Technology Components │ December 7, 2018

Figure 7: Galaxy F teaser during Samsung Developer Conference Figure 8: Galaxy F form-factor, revealed during Samsung
2018                                                          Developer Conference 2018

        SOURCES: CGS-CIMB RESEARCH, SAMSUNG DEVELOPER CONFERENCE 2018            SOURCES: CGS-CIMB RESEARCH, SAMSUNG DEVELOPER CONFERENCE 2018

Figure 9: SDC’S flexible OLED display             Figure 10: LGD’S flexible OLED display           Figure 11: BOE’S flexible OLED display

SOURCES: CGS-CIMB RESEARCH, IDOWNLOADBLOG (IDB)                  SOURCES: CGS-CIMB RESEARCH, IDB            SOURCES: CGS-CIMB RESEARCH, OLED INFO

Figure 12: Tianma’s flexible OLED display         Figure 13: EverDisplay’s flexible OLED           Figure 14: GVO’s (Visionox) flexible OLED
                                                  display                                          display

      SOURCES: CGS-CIMB RESEARCH, DISPLAY DAILY                  SOURCES: CGS-CIMB RESEARCH, IHS                  SOURCES: CGS-CIMB RESEARCH, IHS

                                                                        9
Navigating South Korea
Technology Components │ December 7, 2018

The value proposition of a foldable smartphone
Smartphones that are pocketable are too small for many applications, given the
limited size of their display screens; tablets on the other hand increase the
weight and fragility of the device, as well as making the device less portable
given the bulky size. We note that the smartphones that have adopted flexible
OLED with glass cover-window are not flexible in nature; they have some
features of flexible OLED – lightweight/unbreakable/flexible surface. However,
the flexible OLED smartphones do not offer any meaningful value differentiation
from the conventional mobile devices with thin-film-transistor liquid crystal
display (TFT-LCD).
The foldable smartphone, with a foldable display and foldable casing, could be
folded like a book. Set-makers desire a pocketable tablet form factor, providing a
richer/wider viewing experience with multi-tasking capability, without sacrificing
‘in-the-pocket’ portability. When the technology matures to allow multi-fold
displays, we expect to see foldable smartphones with 10”+ displays, yet with
portability. Considering the size of the latest flagship smartphones (ranging from
5.5-6.5”), we think there is limited room for further expansion in screen size,
while maintaining portability. Furthermore, given the inherent nature of plastic
substrates and the plastic cover window of the foldable smartphone, we believe
the foldable smartphones may be less susceptible to physical damage than
conventional smartphones.

Figure 15: Incremental size of display per fold

 5.2” – 3:2.1 aspect ratio panel                         Galaxy F (unfolded 7.3’’, unfolded aspect ratio 4.2:3)
       Single screen                         Bi-fold                                               Tri-fold

 108                               108                                     108

              75                             150                                                   226
 5.8” – 19.5:9 aspect ratio panel
       Single screen                      Bi-fold                                              Tri-fold

 134                               134                                     134

              62                           123                                                  185

 7.0” – 16:9 aspect ratio panel
        Single screen                       Bi-fold                                              Tri-fold

 155                               155                                      155

              87                             175                                                    262

                                                                                    SOURCES: CGS-CIMB RESEARCH

Figure 16: Different foldable display form factors
 Type                   C-INFOLD             C+1                  G               C-OUTFOLD                      S

 Shape

 Display                 In-fold         In-fold & out          Inside              Out-fold              In & out side
 Number of screen             2               3                   3                     2                        3
 Number of fold            1x                 1x                  2x                   1x                        2x
 Number of direction          1               1                   1                     1                        2
 Number of display      1 display         2 display           1 display             1 display                 1 display
 Thickness                Thin             Medium              Medium                 Thick                    Thick
 Difficulty               Low                Low                 Mid                  High                      High

                                                                                    SOURCES: CGS-CIMB RESEARCH

                         10
Navigating South Korea
Technology Components │ December 7, 2018
Figure 17: Change in diagonal size from additional number of panels
Single screen Bi-fold Tri-fold
Folded Unfolded (bi-fold) Unfolded (tri-fold)
Diagonal (inches) Aspect ratio Diagonal (inches) Aspect ratio Diagonal (inches) Aspect ratio
5.8'' 3:2.1 8.2'' 4.2:3 11.1'' 6.3:3
5.5'' 3:2.1 7.8'' 4.2:3 10.6'' 6.3:3
5.2'' 3:2.1 7.3'' (Galaxy F) 4.2:3 9.9'' 6.3:3
4.7'' 3:2.1 6.7'' 4.2:3 9.0'' 6.3:3
4.3'' 3:2.1 6.1'' 4.2:3 8.3'' 6.3:3
4'' 3:2.1 5.7'' 4.2:3 7.7'' 6.3:3
SOURCES: CGS-CIMB RESEARCH
Figure 18: Different types of foldable form factor Figure 19: Different interactive applications of foldable form
factor
SOURCES: CGS-CIMB RESEARCH, TECHNISCHE UNIVERSITAT SOURCES: CGS-CIMB RESEARCH, TECHNISCHE UNIVERSITAT
Figure 20: Android user interface (UI) for foldable smartphones Figure 21: Android’s UI for foldable smartphones (unfolded),
(folded), released from Google released from Google
SOURCES: CGS-CIMB RESEARCH, ANDROID SOURCES: CGS-CIMB RESEARCH, ANDROID
11Navigating South Korea
Technology Components │ December 7, 2018
Figure 22: Global mobile data consumption Figure 23: Global mobile video data traffic
(EB/month) (EB/month)
450 350
400
300
350
250
300
250 200
200 326
396 150
319 259
150
254 100 200
100 201 156
156 50
120
50 122 92
0 0
2017 2018F 2019F 2020F 2021F 2022F 2017 2018F 2019F 2020F 2021F 2022F
Global mobile data consumption Global mobile video traffic
SOURCES: CGS-CIMB RESEARCH, CISCO SOURCES: CGS-CIMB RESEARCH, CISCO
Figure 24: Mobile share of total global online video consumption
70%
62%
60%
58% 58%
60% 57% 57%
54%
51% 52%
50% 48%
46%
44% 45%
42%
40%
34%
30%
30%
25%
21%
20% 17%
14%
10%
0%
3Q13 1Q14 3Q14 1Q15 3Q15 1Q16 3Q16 1Q17 3Q17 1Q18
Mobile share of global online video views
SOURCES: CGS-CIMB RESEARCH, OOYALA
Figure 25: YouTube’s global number of monthly active users Figure 26: Netflix’s accumulated number of subscribers
(MAU) worldwide
(bn users) (m subscribers)
2 140
120
1.8
100
1.6
80
1.4
1.9 60 118
1.8
1.7
1.2 1.6 94
1.5 40
75
1.3 58
1 20 45
34
24
0.8 0
2016 2017 2018F 2019F 2020F 2021F 2011 2012 2013 2014 2015 2016 2017
YouTube's global number of MAU Netflix's accumulated number of subsribers
SOURCES: CGS-CIMB RESEARCH, EMARKETTER SOURCES: CGS-CIMB RESEARCH, NETFLIX
12Navigating South Korea
Technology Components │ December 7, 2018
INVESTMENT THESIS
Sector investment strategy
The foldable smartphone race is on, in our view. We expect the rapid
proliferation of foldable smartphones to reinvigorate the revenue growth of the
smartphone set-makers, but more notably, the companies in the set-makers’
supply chain. Based on our estimates, the foldable smartphones will see at least
a 60%+ hike in bill of materials (BOM) from that of existing flagship smartphones,
given the new technologies and components required, as well as the larger
screen/form factor.
The biggest beneficiaries of the significant component dollar content hike per
device will be the companies in the foldable OLED module supply chain,
especially the manufacturers of proprietary/newly-developed components for
foldable OLED such as cover window, foldable polariser (anti-reflection film),
foldable optically clear adhesive (OCA), thin-film-transistor (TFT) substrate base
film. We also expect the manufacturers of battery, OLED material and flexible
printed circuit assembly (FPCA), including flexible printed circuit board (FPCB),
to benefit from the component dollar content hike from incremental quantity of
components per device. We think the related equipment manufacturers would
implicitly benefit, depending on the speed of foldable smartphone proliferation;
the successful positioning of a mainstream flagship foldable smartphone is likely
to lead to upward revision in capex plans by display-makers. We see limited
benefits from the foldable smartphone trend for memory or camera module
makers, as there would be insignificant component content growth for foldable
smartphones vs. the conventional smartphone.
Figure 27: BOM cost comparison (Galaxy F vs. the Galaxy S9+, Figure 28: Galaxy F supply chain breakdown
the conventional flagship)
Galaxy F iPhone XS
($US) Galaxy S9+ Component Galaxy F (1st G) beneficiaries
(forecast) Max
Display/Touch module $218.8 $120.0 $79.0 Foldable OLED panel-maker SDC
Emissive layer (SDC M8)
Cameras $48.5 $37.6 $38.0 ETL Tosoh
Mechanical/Electro-Mechanical $87.5 $71.5 $29.8 a-ETL Doosan
HTL DS Duksan, Doosan
Application processor $71.0 $30.0 $67.0 Red host DS Neolux
Power management IC $10.9 $12.6 $8.8 Green host NSCC
Blue host Idemitsu Kosan
Bluetooth/WLAN $7.0 $7.0 $7.0 Red dopant UDC
Memory* $79.0 $40.8 $57.0 Green dopant UDC
Blue dopant SFC
RF/PA/front-end $21.0 $15.5 $19.0 Red prime DS Neolux
Sensors $7.0 $1.2 $5.5 Green prime Merck
Blue prime SYRI
Battery pack (s) $9.2 $6.5 $4.9 P/N dopant SDI (Novaled)
Box contents $19.0 $7.3 $15.5 CPI cover-window Sumitomo Chemical
CPI coating Dongwoo Fine-Chem
Other contents $57.8 $40.2 $44.5 Polarizer Nitto Denko
Total BOM cost $636.7 $390.0 $375.8 Foldable OCA SDI
Touch SDC (Y-OCTA)
Retail price (unsubsidised) $1,800.0 $1,099.0 $840.0 Display FPCB BH Co., SEMCO
Display FPCA (Y-OCTA) DKT Co.
Profit margin after BOM (%) 65% 65% 55%
TFT substrate (PI-varnish) Samsung-Ube Materials
*iPhone XS Max / GS9+ NAND = 64GB, Galaxy F = 128GB Base film (PI) SKC Kolon PI
Acrylic adhesive Innox Advanced
DDI SEC (System LSI)
DDI Pack aging STECO
HDI/SLP SEMCO, ISUP, KC, Ibiden
Hinge KH Vatec
Casing SEC (In-sourced)
Battery SDI, LG Chem
SDI = Samsung SDI, SYRI = Samsung Yokohama R&D Institute, KC = Korea Circuit
NSCC = Nippon Steel&Chemial Co, SEMCO = Samsung Electro-Mechanics, , ISUP = ISU Petasys
SOURCES: CGS-CIMB RESEARCH SOURCES: CGS-CIMB RESEARCH
13Navigating South Korea
Technology Components │ December 7, 2018
The share prices of many of the flexible/foldable OLED stocks in Korea have
been on a full-fledged downtrend YTD (-28% average for CGS-CIMB Research
coverage of technology components sector), in view of the downcycle in demand
for conventional smartphones. Given the market’s lowered expectations, we
advise investors to accumulate the foldable smartphone-related supply chain
names now as trading buy opportunities, as we expect positive share price
momentum to build ahead of the Galaxy F launch. We expect further re-rating
once there is positive public response to the foldable smartphones. Hence, we
recommend investors view companies in SDC’s foldable OLED module supply
chain as a basket and a trading buy opportunity; given the recent steep erosion
in their share prices, we think they offer attractive risk-reward at the moment.
In the technology components sector, our top picks are BH and SDI as plays on
the foldable smartphone theme for our forecast period (2018-20F). We expect
BH to see a significant hike in component dollar content per device from foldable
smartphones, as foldable OLEDs require two build-up FPCBs (4.6”/7.3”; c.US$7
in total value) vs. one build-up FPCB or rigid-flex printed circuit board (RF-PCB);
(US$3 in total value for Galaxy S9+) for a conventional flagship smartphone by
SEC. Also, as a beneficiary of rising flexible OLED penetration in mobile phones,
we think the structural growth story underpins BH’s earnings growth going
forward. Even based on our conservative assumptions for iPhone/Galaxy
shipment volumes, we forecast EPS CAGR of 40% over FY18-20F for BH.
As for SDI, it supplies SEC/SDC with batteries, foldable OCA, P/N dopant for the
Galaxy F. We think it is also a contender to supply foldable polariser and OLED
materials (M9 green host) for the second-generation Galaxy F. Given its
accelerating net profit growth momentum in FY18-20F (based on our estimates)
from its lithium-ion battery (LiB) business and limited downside risk to P/E
valuation at the moment, we believe SDI will be a safe haven for investors. We
also highlight SKPI, BH and Kolon Industries as potential key beneficiaries of the
foldable smartphone trend.
Figure 29: Korea foldable smartphone set-makers and supply chain valuation
Ticker Price TP Upside Mkt cap P/E (x) P/BV (x) ROE (%) EV/EBITDA (x)
Contents Company Recom.
(BBG) (Local curr) (Local curr) (%) (USD $m) FY18F FY19F FY18F FY19F FY18F FY19F FY18F FY19F
Foldable smartphone Samsung Electronics 000660 KS ADD 40,950 53,000 29.4% 234,591 6.1 8.0 1.1 1.0 19.7 13.3 2.2 2.2
set-mak ers (Korea) LG Electronics 034220 KS ADD 66,900 120,000 79.4% 9,770 7.0 5.8 0.8 0.7 12.3 13.0 2.6 2.2
Weighted average 6.1 7.9 1.1 1.0 19.5 13.3 2.2 2.2
Samsung SDI 006400 KS ADD 208,000 345,000 65.9% 12,764 19.9 11.7 1.2 1.1 6.2 9.7 11.2 6.9
SKC Kolon PI 178920 KS HOLD 30,550 37,000 21.1% 801 23.5 16.4 3.4 3.1 14.9 19.8 11.2 8.8
BH Co. 090460 KS ADD 16,400 20,000 22.0% 458 7.5 5.1 2.6 1.7 39.4 40.5 4.4 3.1
Kolon Industries 120110 KS REDUCE 51,700 44,000 -14.9% 1,245 12.6 10.9 0.6 0.6 5.0 5.4 9.1 8.3
SEMCO 009150 KS ADD 116,500 190,000 63.1% 7,766 13.2 7.2 1.8 1.5 14.7 22.4 5.4 3.4
Innox 272290 KS NR 39,100 na na 313 11.4 8.8 2.3 1.8 21.7 22.8 7.6 5.4
Duksan Neolux 213420 KS NR 14,200 na na 304 18.1 16.6 2.4 2.1 14.3 13.5 12.5 10.2
SFA 056190 KS NR 34,900 na na 1,118 7.7 7.4 1.5 1.3 19.8 18.3 3.8 3.2
Wonik IPS 240810 KS NR 20,500 na na 755 8.1 8.3 2.1 1.7 29.2 22.8 4.4 4.0
Jusung Engineering 036930 KS NR 6,680 na na 288 8.6 6.7 1.5 1.2 18.3 19.8 5.1 3.3
AP System 265520 KS NR 22,800 na na 287 8.5 7.3 2.7 2.0 37.1 30.9 4.5 5.2
Foldable smartphone
TES 095610 KS NR 12,950 na na 228 5.3 6.2 1.1 1.0 23.0 16.5 2.4 2.2
supply chain (Korea)
HB Technology 078150 KS NR 2,780 na na 196 22.2 12.5 1.3 1.2 6.0 10.4 na na
Wonik Tera Semicon 123100 KS NR 14,750 na na 149 9.1 17.4 0.9 0.9 10.9 5.4 4.4 5.2
Wonik Materials 104830 KS NR 24,550 na na 276 8.6 7.8 1.2 1.1 15.3 14.2 4.3 3.4
ENF Tech 102710 KS NR 13,500 na na 171 6.3 4.6 0.9 0.8 15.1 17.6 5.1 3.2
SK Materials 036490 KS NR 152,700 na na 1,437 13.2 10.0 3.3 2.7 28.8 31.2 8.5 6.9
ICD 040910 KS NR 7,380 na na 110 5.8 4.3 0.9 0.8 15.9 20.0 3.7 3.1
Viatron 141000 KS NR 10,150 na na 110 5.5 5.7 1.0 0.8 18.9 15.7 2.2 1.6
New Power 144960 KS NR 12,600 na na 93 8.3 7.4 0.8 0.7 10.1 10.3 2.1 1.4
YAS 255440 KS NR 16,400 na na 191 5.7 5.0 1.5 1.1 29.8 25.4 3.2 2.4
V-One 251630 KS NR 20,450 na na 137 9.8 8.1 2.0 1.6 22.3 21.7 5.5 3.8
IsuPetasys 007660 KS NR 6,360 na na 234 111.6 7.8 1.5 1.3 1.2 17.8 10.6 5.5
Weighted average 15.6 11.3 1.5 1.3 11.6 13.7 7.6 6.0
* All forecasts for non-rated companies are b ased on Bloomb erg consensus
* CGS-CIMB Research coverage highlighted in b lue
NOTE: AS AT 7 DEC 2018
SOURCES: CGS-CIMB RESEARCH, BLOOMBERG
14Navigating South Korea
Technology Components │ December 7, 2018
Prefer component names to smartphone set-makers
In the initial years of the foldable smartphone’s entry to the market (2019-20F),
we advise investors to focus on the component players, rather than the
smartphone set-makers. We expect both component makers and smartphone
set-makers to benefit from the foldable smartphone trend due to: 1) the hike in
ASP per smartphone, and 2) the hike in BOM cost per smartphone. However,
we believe smartphone set-makers will continue to face downside risks to sales
of their conventional smartphone line-ups, which we do not think will be offset by
the upside from the sales of foldable smartphones over the next three years.
Component players, on the other hand, have the potential to diversify their
customer base to other smartphone makers and limit downside risk through
market share gains in their respective supplied components.
Figure 30: Global handset sales & revenue contribution from Figure 31: Global smartphone sales volume & sales volume
foldable smartphones (base case) contribution from foldable smartphones (base case)
(US$ bn) (m units)
600 10% 1800 10%
9% 1600 8%
500 8% 6%
1400
400 7% 4%
1200
6% 2%
1000
300 5% 0%
800
4% -2%
200 3% 600 -4%
2% 400 -6%
100
1% 200 -8%
0 0% 0 -10%
2017 2018F 2019F 2020F 2021F 2022F 2017 2018F 2019F 2020F 2021F 2022F
Global smartphone sales ($ bn) Global smartphone sales volume (m units)
Global foldable sales ($ bn) Global foldable sales volume (m units)
% of revenue contribution from foldable (RHS) % of volume contribution from foldable (RHS)
Global handset sales yoy growth (%) (RHS) Global handset sales volume yoy growth (%) (RHS)
SOURCES: CGS-CIMB RESEARCH ESTIMATES, COUNTERPOINT SOURCES: CGS-CIMB RESEARCH ESTIMATES, COUNTERPOINT
15Navigating South Korea
Technology Components │ December 7, 2018
Figure 32: SEC IM division’s handset sales & revenue Figure 33: SEC’s smartphone sales volume & volume
contribution from foldable smartphones (base case) contribution from foldable smartphones (base case)
(W tn) (m units)
100 25% 400 10%
90 350 8%
20%
80 6%
300
70 15% 4%
60 250 2%
10%
50 200 0%
5%
40 150 -2%
30 0% -4%
100
20 -6%
-5% 50
10 -8%
0 -10% 0 -10%
2017 2018F 2019F 2020F 2021F 2022F 2017 2018F 2019F 2020F 2021F 2022F
SEC IM division handset sales (W tn) SEC handset sales volume (m units)
SEC foldable sales (W tn) SEC foldable sales volume (m units)
% of revenue contribution from foldable (RHS) % of volume contribution from foldable (RHS)
IM division handset sales yoy growth (%) (RHS) IM division handset sales volume yoy growth (%) (RHS)
SOURCES: CGS-CIMB RESEARCH ESTIMATES, COUNTERPOINT SOURCES: CGS-CIMB RESEARCH ESTIMATES, COUNTERPOINT
Figure 34: Apple’s iPhone sales & revenue contribution from Figure 35: Apple’s iPhone sales volume & volume contribution
foldable smartphones (base case) from foldable smartphones (base case)
(US$bn) (m units)
180 20% 250 10%
160 8%
15%
140 200 6%
4%
120 10%
150 2%
100
5% 0%
80
100 -2%
60 0%
-4%
40 50 -6%
-5%
20 -8%
0 -10% 0 -10%
2017 2018F 2019F 2020F 2021F 2022F 2017 2018F 2019F 2020F 2021F 2022F
Apple iPhone sales (US$bn) (CY) Apple iPhone sales volume (m units)
Apple foldable sales (US$bn) Apple foldable sales volume (m units)
% of revenue contribution from foldable (RHS) % of volume contribution from foldable (RHS)
Apple iPhone sales yoy growth (%) (RHS) Apple iPhone sales volume yoy growth (%) (RHS)
SOURCES: CGS-CIMB RESEARCH ESTIMATES, COUNTERPOINT SOURCES: CGS-CIMB RESEARCH ESTIMATES, COUNTERPOINT
16Navigating South Korea
Technology Components │ December 7, 2018
Prefer SDC supply chain to other display panel makers
Among the numerous panel-makers worldwide that have announced their
development of foldable OLED – Samsung Display (SDC, a subsidiary of SEC),
LG Display (LGD, 034220 KS, Reduce, TP: W15k), China Star Optoelectronics
Technology (CSOT, Unlisted), BOE Technology Group (BOE, 000725 CH,
Reduce, TP: Rmb2.65), Tianma Microelectronics (Tianma, 000050 CH, Add,
TP:Rmb17.90) – we favour SDC and its supply chain as the likely winners of the
foldable smartphone theme for our forecast period (2018-20F). In our view, LGD
is SDI’s closest competitor but it lags far behind SDC in terms of both technology
and scale of production.
Assuming the foldable smartphone prices put them in the ultra-high-end
smartphone segment (US$1,500 per unit or above) until 2020F, we think that
demand for foldable smartphones will only accelerate following their penetration
into the lower-priced segments. The reduction in ASP can only be done through
lower BOM cost, which would come from economies of scale and productivity
(yield) gains. We believe this virtuous cycle can only be implemented by SDC.
Given SDC’s technological prowess in flexible OLED production, market-leading
position (97% global shipment volume market share in flexible OLED in 2017)
and successful track record in developing and producing flat/curved flexible
OLEDs (same fabrication technology and components used to manufacture
foldable flexible OLEDs), we believe SDC and its supply chain would lead the
way in the proliferation of components for foldable smartphones
As for the non-SDC foldable OLED supply chains, we think their technical
immaturity and lower-level of technology (flat/curved flexible OLED), as well as
shorter track record make it difficult for them to compete commercially with SDC.
As a result, they try to copy/mimic SDC’s foldable OLED structure and its
suppliers’ too. Based on our channel checks, many of the companies in SDC’s
foldable OLED supply chain have been in contact with other panel-makers. Also,
given their much smaller production scale vs. SDC, we think non-SDC foldable
OLED supply chains and other panel-makers would not be as cost competitive
as SDC.
More importantly, there is still a question of which factories would actually be
built and able to mass produce commercial grades of flexible OLED panels,
especially in China. We still expect delays and cancellation of capex plans for
flexible OLED fabs in China, as seen in the past few years.
We think SDC’s foldable OLED display in the Galaxy F model will define the
standard foldable OLED structure for the industry, as SDC’s supply chain is
likely to supply materials to other panel-makers. In our view, SDC would
continue to dominate the mobile flexible OLED market (including foldable OLED
segment) in 2019-20F. SDC is not keeping its foldable OLED technology
exclusive to SEC, but intends to make it available to any set-maker that wants to
develop foldable smartphones. We believe there are significant gaps in
technological proficiency and yield between SDC and the foldable OLED panel
laggards (LGD and BOE). We believe SDC will be able to defend its position as
the only viable/competitive foldable OLED panel-maker, capable of mass
producing (>1m units p.a.) until 2020F, when LGD joins the competition.
Figure 36: Technological proficiency in manufacturing mobile OLEDs by panel-maker (Dec 2018)
SOURCES: CGS-CIMB RESEARCH
17Navigating South Korea
Technology Components │ December 7, 2018
Figure 37: Global mobile flexible OLED (FOLED) capacity, based Figure 38: Global mobile FOLED capacity breakdown , by
on our forecasts company
(k sqm/qtr)
10,000 100%
9,000 90%
8,000 80%
7,000 70%
6,000 60%
5,000 50%
4,000 40%
3,000 30%
2,000 20%
1,000 10%
0 0%
1Q16 2Q17F 3Q18 4Q19F 1Q21F 2Q22F 1Q16 2Q17F 3Q18 4Q19F 1Q21F 2Q22F
Samsung Display LG Display JDI Sharp Samsung Display LG Display JDI Sharp
BOE Tianma Truly Foxconn BOE Tianma Truly Foxconn
Visionox China Star Royole Ever Display Visionox China Star Royole Ever Display
AUO Ningbo Mange CEC Panda Trenso AUO Ningbo Mange CEC Panda Trenso
New Vision New Vision
SOURCES: CGS-CIMB RESEARCH, IHS MARKIT SOURCES: CGS-CIMB RESEARCH, IHS MARKIT
Figure 39: Quarterly mobile active-matrix organic light-emitting Figure 40: Quarterly mobile AMOLED shipment volume market
diode (AMOLED) shipment volume share
(m units)
140 100%
90%
120
80%
100 70%
60%
80
50%
60
40%
40 30%
20%
20
10%
0 0%
1Q16 2Q16 3Q16 4Q16 1Q17 2Q17 3Q17 4Q17 1Q18 2Q18 3Q18 4Q18F 1Q16 2Q16 3Q16 4Q16 1Q17 2Q17 3Q17 4Q17 1Q18 2Q18 3Q18 4Q18F
Samsung AUO BOE Everdisplay LG Display Tianma Visionox Samsung AUO BOE Everdisplay LG Display Tianma Visionox
SOURCES: CGS-CIMB RESEARCH, IHS MARKIT SOURCES: CGS-CIMB RESEARCH, IHS MARKIT
Figure 41: Global mobile flexible OLED fab expansion breakdown
Capacity
Manufacturer Fab MG size Tech Probability 2017 2018F 2019F 2020F 2021F 2022F 2023F
(k/month)
SDC A2E (ph.2) 1300 x 1500 LTPS 8 100%
SDC A4 (L7-1) 1500 x 1850 LTPS 30 100%
SDC A5 1500 x 1850 LTPS 105 30%
LG Display Paju P9-E6 G6 1500 x 1850 LTPS 45 100%
LG Display Paju P10-E7 G5 1500 x 1850 LTPS / LTPO 30 30%
BOE B7 Cheongdu 1500 x 1850 LTPS 48 100%
BOE B11 Manyang 1500 x 1850 LTPS / LTPO 48 100%
BOE B12 Chongqing 1500 x 1850 LTPS 48 50%
BOE B15 1500 x 1850 LTPS 48 30%
CSOT T4 Wuhan 1500 x 1850 LTPS 45 100%
CPT Mantix 1500 x 1850 a-Si / Oxide 60 100%
EDO Ever Display 2 LTPS 1500 x 1850 LTPS 30 100%
JOLED JDI TOG Nomi G5.5 D2 1300 x 1500 LTPS / Oxide 20 90%
Royole Ryl Shenzhen 1300 x 1500 Oxide 5 100%
Tianma Zuoling Wuhan 1500 x 1850 LTPS 30 100%
Tianma Wuhan 2 1500 x 1850 LTPS 30 30%
Visionox V2 Gu'an 1500 x 1850 LTPS 30 100%
Visionox V3 Hefel 1500 x 1850 LTPS 30 65%
Visionox VSX V4 1500 x 1850 LTPS 15 30%
Equipment order Equipment installation Mass production
SOURCES: CGS-CIMB RESEARCH
18Navigating South Korea
Technology Components │ December 7, 2018
Focus on hike in component dollar content
As shown in our BOM cost analysis (Figure 41), we expect to see a 69% hike in
component dollar content per device for the Galaxy F from that of Galaxy S9+. In
our view, the steepest hike will come from new components used for the foldable
OLED display module due to the adoption of new components, as well as the
increase in number of materials and mechanical components. New components
in the foldable smartphone include colourless polyimide [CPI, from Sumitomo
Chemical (4005 JP, Not Rated)], foldable OCA [from SDI], foldable polariser
[from Nitto Denko (6988 JP, Not Rated)] and base film [from SKPI]. In our view,
beneficiaries of the larger form factor (and larger display) of the foldable
smartphone include the manufacturers of: 1) display materials [i.e. Duk San
Neolux (213420 KS, Not Rated)], 2) batteries [i.e. SDI], 3) electro-mechanical
components, including players in flexible printed circuit assembly (FPCA) and
flexible printed circuit boards (FPCB) [i.e. DKT (Unlisted) and BH)], and 4)
casings/hinges (i.e. KH Vatec (060720 KS, Not Rated). In contrast, memory and
camera module makers are unlikely to see much change in revenue or earnings
from the foldable smartphone trend, in our view.
Figure 42: Technological component dollar content – Galaxy F vs. conventional
flagship smartphone models (iPhone XS Max and Galaxy S9+)
(US$) Galaxy F (forecast) iPhone XS Max Galaxy S9+ Diff. vs. iPhone XS Max Diff. vs. Galaxy S9+
Display/Touch module $218.8 $120.0 $79.0 $98.8 $139.8
Cameras $48.5 $37.6 $38.0 $10.9 $10.6
Mechanical/Electro-Mechanical $87.5 $71.5 $29.8 $16.0 $57.8
Application processor $71.0 $30.0 $67.0 $41.0 $4.0
Power management IC $10.9 $12.6 $8.8 ($1.7) $2.1
Bluetooth/WLAN $7.0 $7.0 $7.0 $0.0 $0.0
Memory* $79.0 $40.8 $57.0 $38.3 $22.0
RF/PA/front-end $21.0 $15.5 $19.0 $5.5 $2.0
Sensors $7.0 $1.2 $5.5 $5.9 $1.5
Battery pack(s) $9.2 $6.5 $4.9 $2.7 $4.3
Box contents $19.0 $7.3 $15.5 $11.8 $3.5
Other contents $57.8 $40.2 $44.5 $17.6 $13.3
Total BOM cost $636.7 $390.0 $375.8 +$246.7 (+63%) +$260.9 (+69%)
Retail price (unsubsidised) $1,800.0 $1,099.0 $840.0
Profit margin after BOM (%) 65% 65% 55%
*iPhone XS Max / GS9+ NAND = 64GB, Galaxy F = 128GB
SOURCES: CGS-CIMB RESEARCH
Figure 43: Changes in OLED structure from rigid to foldable
Rigid OLED Curved OLED Foldable OLED
Cover window (glass) Cover window (glass) Cover window (CPI)
Polariser film Polariser film Polariser film (foldable)
Touch sensor Touch sensor Touch sensor
Encapsulation (frit glass) Thin film encapsulation Thin film encapsulation
R G B R G B R G B
TFT substrate (glass) TFT substrate (PI varnish) TFT substrate (PI varnish)
Base film (PET) Base film (PI)
SOURCES: CGS-CIMB RESEARCH
19Navigating South Korea
Technology Components │ December 7, 2018
Figure 44: Companies in the Galaxy F supply chain and their competitors
Component Galaxy F (1st G) beneficiaries Contenders
Foldable OLED panel-maker SDC LGD, BOE, JDI, CSOT, BOE, Tianma, BOE
Emissive layer (SDC M8)
ETL Tosoh Idemitsu Kosan, LG Chem, SDI
a-ETL Doosan SDI, Dow Chem
HTL DS Duksan, Doosan Idemitsu Kosan, Merck , Doosan
Red host DS Neolux Dow Chem
Green host NSCC SDI
Blue host Idemitsu Kosan SFC, Idemitsu Kosan
Red dopant UDC DS Neolux
Green dopant UDC Merck
Blue dopant SFC Idemitsu Kosan, Chisso
Red prime DS Neolux Tosoh, LG Chem
Green prime Merck DS Neolux
Blue prime SYRI Idemitsu Kosan, Chisso
P/N dopant SDI (Novaled)
CPI cover-window Sumitomo Chemical Kolon Industries, SKC, Mitsubishi Gas Chem
CPI coating Dongwoo Fine-Chem Toray, SKC
Polariser Nitto Denko Dongwoo Fine-chem, Samsung SDI, LG Chem
Foldable OCA SDI Tapex, 3M
Touch SDC (Y-OCTA) Nissha, Alps, Broadcom, Sumitomo Chemical
Display FPCB BH Co., SEMCO Interflex, Youngpoong
Display FPCA DKT Co. Union, Our Circuit
TFT substrate (PI-varnish) Samsung-Ube Materials SKC Kolon PI, Kanek a, Dupont, Taimide
Base film (PI) SKC Kolon PI Kanek a, Dupont, Taimide, Ube Materials
Acrylic adhesive Innox Advanced Toray
DDI SEC (System LSI)
DDI Pack aging STECO
HDI/SLP SEMCO, ISUP, KC, Ibiden Unimicron, Compeq, AT&S, NOK, Zhen Ding
Hinge KH Vatec Intops, Foxconn
Casing SEC (In-sourced) Foxconn, Catcher
Battery SDI, LG Chem ATL, Murata
SDI = Samsung SDI (006400.KS, ADD, TP W345,000), SYRI = Samsung Yokohama R&D Institute (Unlisted), KC = Korea Circuit (007810.KS,
Not rated) ISUP = ISU Petasys (007660.KS, Not rated), NSCC = Nippon Steel & Chemial Co (Unlisted), SEMCO = Samsung Electro-Mechanics
(009150.KS, ADD, W190,000), LGD = LG Display (034220.KS, REDUCE, W15,000), JDI = Japan Display (6740.TYO, Not rated), CSOT = China
Star Optoelectronics Technology (Unlisted), BOE = BOE Technology Group (000725.SZ, REDUCE, TP RMB2.65), Tianma = Tianma
Microelectronics (000050.SZ, ADD, TP RMB17.90)
SOURCES: CGS-CIMB RESEARCH
20Navigating South Korea
Technology Components │ December 7, 2018
Potential re-rating catalyst
We believe an increase in component dollar content and in the volume growth of
foldable smartphones is almost certain, and as such, we expect this potential to
be reflected in the share prices of players in the respective supply chains ahead
of the launch of the Galaxy F. At present, many of the flexible/foldable OLED
stocks in Korea are trading at attractive valuations, in our view, given the
downward trend in share prices YTD, on the back of lowered consensus
expectations on the earnings growth. Given the lowered expectations, we advise
investors to accumulate select related supply chain names as we expect positive
share price momentum to build up ahead of the launch of Galaxy F in 1Q19F.
Our top picks within the theme, among names we cover, are: 1) BH and 2) SDI.
We believe BH will see a significant increase in component dollar content per
device from foldable smartphones, as foldable OLEDs require two build-up
FPCBs (4.6”/7.3”; c.US$7 in total value) vs. one build-up FPCB or RF-PCB
(US$3 in total value for Galaxy S9+) for a conventional flagship model from SEC.
Also, we believe there is a structural growth story underpinning BH’s earnings
growth prospects, as it is a beneficiary of the increase in flexible OLED
penetration within the mobile industry. Despite our conservative assumptions for
total shipment volume contraction of -2.8% over FY17-20F for iPhone (65% of
BH’s FY18F revenue) and -6.1% p.a. over FY17-20F Galaxy (30% of BH’s
FY18F revenue), we forecast EPS CAGR of 40% for BH over that period.
Concerns over conventional smartphone demand are valid, in our view, but we
believe the magnitude of the share price correction is clearly an over-reaction.
BH currently trades at 5.1x FY19F P/E (vs. its average 12-month forward P/E of
11.8x in FY17, when the earnings growth momentum from OLED industry was
price in), and 18.6x over FY11-14 (period of FPCB industry downturn and
consolidation). We left FY15-16 out of our historical average P/E calculation
because of negative EPS during the period.
SDI is a key components supplier (battery, OLED materials) for SEC’s Galaxy F.
We believe SDI offers a superior risk-reward proposition as compared to the rest
of the foldable smartphone supply chain, given it solid earnings momentum
(from its non-smartphone business) in FY18-20F, and attractive valuation. SDI
currently trades at 11.1x FY19F EV/EBITDA (-2 s.d. below its historical average
(EV/EBITDA in Jan 2010-Nov 2018, excluding FY15-16 because of negative
EBITDA in those years) vs. CATL’s 20.5x FY19F EV/EBITDA, despite the
unprecedented earnings momentum of 67% EBITDA CAGR during FY17-20F.
We expect the valuation to gradually re-rate once SDI starts delivering
sustainable earnings growth, which should boost investors’ confidence in the
stock, in our view.
Figure 45: YTD share price performance of notable companies in the foldable
smartphone supply chain
10%
2%
0%
-10%
-20%
-20%
-30%
-40% -35%
-40%
-42% -42% -43%
-50% -44%
Samsung SEC SKC Kolon BH Kolon DS Neolux LG Display KH Vatec
SDI PI Industries
YTD share price performance
SOURCES: CGS-CIMB RESEARCH, BLOOMBERG
21Navigating South Korea
Technology Components │ December 7, 2018
Figure 46: SEC foldable smartphone supply chain valuation
Ticker TP Upside Price Mkt cap P/E (x) P/BV (x) ROE (%) EV/EBITDA (x)
Parts Company Recom.
(BBG) (Local curr) (%) (Local curr) (USD $m) FY18F FY19F FY18F FY19F FY18F FY19F FY18F FY19F
Samsung SDI 006400 KS ADD 345,000 65.9% 208,000 12,764 19.9 11.7 1.2 1.1 6.2 9.7 11.2 6.9
SKC Kolon PI 178920 KS HOLD 37,000 21.1% 30,550 801 23.5 16.4 3.4 3.1 14.9 19.8 11.2 8.8
Idemitsu Kosan 5019 JT NR na na 3,800 7,007 5.0 4.3 0.9 0.8 21.2 16.6 6.2 5.7
OLED
Universal Display OLED US NR na na 99 4,644 82.2 39.8 6.7 5.7 8.1 15.3 73.2 34.3
materials
Innox 272290 KS NR na na 39,100 313 11.4 8.8 2.3 1.8 21.7 22.8 7.6 5.4
Duksan Neolux 213420 KS NR na na 14,200 304 18.1 16.6 2.4 2.1 14.3 13.5 12.5 10.2
Dow Chem DWDP US NR na na 56 128,294 13.5 11.9 1.3 1.3 9.6 9.8 8.3 7.5
OLED materials weighted average 15.8 12.4 1.5 1.4 9.8 10.4 10.4 8.2
BH Co. 090460 KS ADD 20,000 22.0% 16,400 458 7.5 5.1 2.6 1.7 39.4 40.5 4.4 3.1
Kolon Industries 120110 KS REDUCE 44,000 -14.9% 51,700 1,245 12.6 10.9 0.6 0.6 5.0 5.4 9.1 8.3
OLED modules SEMCO 009150 KS ADD 190,000 63.1% 116,500 7,766 13.2 7.2 1.8 1.5 14.7 22.4 5.4 3.4
Sumitomo Chemical 4005 JP NR na na 591 8,673 7.0 7.1 1.0 0.9 16.0 14.1 6.2 6.0
Nitto Denko 6988 JP NR na na 5,816 8,959 9.7 11.2 1.3 1.3 14.5 11.2 3.8 4.2
OLED modules 9.9 8.6 1.4 1.2 15.0 15.6 5.3 4.7
Applied Materials AMAT US NR na na 35 34,100 7.9 9.8 5.0 5.4 50.7 47.8 6.6 8.0
SFA 056190 KS NR na na 34,900 1,118 7.7 7.4 1.5 1.3 19.8 18.3 3.8 3.2
Wonik IPS 240810 KS NR na na 20,500 755 8.1 8.3 2.1 1.7 29.2 22.8 4.4 4.0
Jusung Engineering 036930 KS NR na na 6,680 288 8.6 6.7 1.5 1.2 18.3 19.8 5.1 3.3
AP System 265520 KS NR na na 22,800 287 8.5 7.3 2.7 2.0 37.1 30.9 4.5 5.2
TES 095610 KS NR na na 12,950 228 5.3 6.2 1.1 1.0 23.0 16.5 2.4 2.2
HB Technology 078150 KS NR na na 2,780 196 22.2 12.5 1.3 1.2 6.0 10.4 na na
Wonik Tera Semicon 123100 KS NR na na 14,750 149 9.1 17.4 0.9 0.9 10.9 5.4 4.4 5.2
OLED Wonik Materials 104830 KS NR na na 24,550 276 8.6 7.8 1.2 1.1 15.3 14.2 4.3 3.4
equipments Nikon 7731 JT NR na na 1,752 6,226 21.0 12.7 1.2 1.2 6.0 9.2 5.9 3.9
ENF Tech 102710 KS NR na na 13,500 171 6.3 4.6 0.9 0.8 15.1 17.6 5.1 3.2
SK Materials 036490 KS NR na na 152,700 1,437 13.2 10.0 3.3 2.7 28.8 31.2 8.5 6.9
ICD 040910 KS NR na na 7,380 110 5.8 4.3 0.9 0.8 15.9 20.0 3.7 3.1
Viatron 141000 KS NR na na 10,150 110 5.5 5.7 1.0 0.8 18.9 15.7 2.2 1.6
New Power 144960 KS NR na na 12,600 93 8.3 7.4 0.8 0.7 10.1 10.3 2.1 1.4
YAS 255440 KS NR na na 16,400 191 5.7 5.0 1.5 1.1 29.8 25.4 3.2 2.4
Ulvac 6728 JP NR na na 3,710 1,623 5.9 7.2 1.4 1.1 26.2 16.4 3.5 3.6
V-One 251630 KS NR na na 20,450 137 9.8 8.1 2.0 1.6 22.3 21.7 5.5 3.8
OLED 9.7 10.0 4.0 4.2 40.8 38.7 6.2 6.9
LG Chem 051910 KS ADD 500,000 42.2% 351,500 22,144 14.5 13.1 1.4 1.3 10.2 10.4 6.6 6.7
Others IsuPetasys 007660 KS NR na na 6,360 234 111.6 7.8 1.5 1.3 1.2 17.8 10.6 5.5
Ibiden 4062 JT NR na na 1,578 1,971 19.2 18.3 0.8 0.8 4.4 4.3 3.9 3.8
Total weighted average 14.0 11.7 1.9 1.9 16.2 16.2 8.7 7.4
*NR companies' forecasts are based on Bloomberg consensus
*Highlighted companies in blue are under CGS-CIMB coverage universe.
NOTE: AS AT 7 DEC 2018
SOURCES: CGS-CIMB RESEARCH, BLOOMBERG
22Navigating South Korea
Technology Components │ December 7, 2018
Samsung SDI (006400 KS, Add, TP: W345k)
SDI supplies polymer batteries and P-type and N-type dopant for the 1st
generation Galaxy F, with its pipeline potentially including polariser and green
host for the 2nd generation of foldable smartphones. Given 1) the significantly
larger battery size (at 5,000mha+), and 2) additional/larger display (leading to
larger quantity of OLED materials) in Galaxy F, we see SDI as one of the key
beneficiaries of the proliferation of foldable smartphone.
We reiterate our Add call and SOP-based TP of W345k (based on 7x FY19F
EV/EBITDA for small-sized battery and DCF for large sized battery, implying 19x
FY19F P/E and 1.8x FY19F P/BV) as we remain positive on SDI on the back of
tailwinds across the LiB segment from high-growth applications, and sustainable
earnings growth. At 11.7x FY19F P/E, we believe the premium from the
accelerating earnings up-cycle is hardly priced in. Given the recent market jitters
from 1) negative net fund flow of Samsung Group funds, and 2) the emergence
of new contenders in Europe, which we view as non-fundamental and a non-
event for SDI’s earnings in FY18-20F, we advise investors to accumulate SDI at
the current share price level. Catalysts: 1) new order backlog for xEV and
energy storage system (ESS) batteries, 2) improving visibility for Chinese OEMs
(discontinued EV subsidy programme). Risks: 1) slowdown in ESS installations,
and 2) slower-than-expected EV proliferation.
Figure 47: SOP-valuation, based on our estimates
Valuation
(W bn) Value Comments
methodology
Operational value (A)
Small size LiB (1) 7x FY19F EV/EBITDA 7,894 FY19F EBITDA is W1,128 bn
Large size LiB (EV+ESS) (2) DCF-based valuation 6,181
Electronic materials (3) 7x FY19F EV/EBITDA 3,735 FY19F EBITDA is W534 bn
Total (1+2+3) 17,810
Non-core assets (B)
Samsung Display (4) 30% discount to 2Q18 BV 4,379 2Q18 BV is W6,256 bn
Other affiliates (listed + unlisted) (5) 30% discount to 2Q18 BV 999 2Q18 BV is W1.427 bn
Total (4+5) 5,378
Equity value (C) (A) + (B) 23,188
Treasury share value (6) 765 Market value as at 6 Dec 2018
Net debt (7) 225 FY19F-based
Fair value of equity (D) (C) + (6 - 7) 23,727
# of total shares (m) 68.8
NAV/Share (W) 345,000
Target Price (W) 345,000
Current price (W) 208,000
Upside potential 65.9%
NOTE; AS AT 7 DEC 2018
SOURCES: CGS-CIMB RESEARCH, COMPANY REPORTS
23You can also read