Virtual, Mixed & Augmented Reality in NRW - VR - Mediennetzwerk.NRW
←
→
Page content transcription
If your browser does not render page correctly, please read the page content below
Virtual, Mixed &
Augmented Reality
in NRW
Potentials and needs of the VR, MR, AR sectors in
North Rhine-Westphalia

                                                    VR

                             AR

                                            MR
Prof. Christian Zabel
Prof. Gernot Heisenberg
Cologne, 12/15/2017
Publisher:

Mediennetzwerk.NRW
c/o Mediencluster NRW GmbH
Kaistrasse 14 | 40221 Düsseldorf
info@medien.nrw.de | www.medien.nrw.de

Mediennetzwerk.NRW supports media companies in North Rhine-Westphalia in exploiting the
opportunities of the digital transition and in establishing national and international networks.
It is financed by the State of North Rhine-Westphalia and with funds from the European
Regional Development Fund (ERDF).
A Study by the TH Köln
on Behalf of Mediennetzwerk.NRW

Mediennetzwerk.NRW supports media companies in North Rhine-Westphalia in exploiting the
opportunities of the digital transition and in establishing national and international networks.
It is financed by the State of North Rhine-Westphalia and with funds from the European
Regional Development Fund (ERDF).

Editorial cooperation: Regina Wirtz
Layout: hoop-de-la design

Status of the research: November 30, 2017
with the kind support of the First Association for Virtual Reality (EDFVR e.V.)
VR, MR and AR in NRW

Table of Contents

0. EXECUTIVE SUMMARY  . . . . . . . . . . . . . . . . . . . . . . . . . . . . . . . . . . . . . . . . . . . . . . . . . . . . . .  6
   0.1. Study Design  . . . . . . . . . . . . . . . . . . . . . . . . . . . . . . . . . . . . . . . . . . . . . . . . . . . . . . . . . . . . .  7
   0.2. General Development of the Sector  . . . . . . . . . . . . . . . . . . . . . . . . . . . . . . . . . . . . . . . . .  7
   0.3. Opportunities and Challenges for VR  . . . . . . . . . . . . . . . . . . . . . . . . . . . . . . . . . . . . . . . .  7
   0.4. Opportunities and Challenges for AR and MR  . . . . . . . . . . . . . . . . . . . . . . . . . . . . . . . . .  8
   0.5. The Structure of the VR/MR/AR Sector in NRW  . . . . . . . . . . . . . . . . . . . . . . . . . . . . . . .  9
   0.6. Customer and Revenue Structures  . . . . . . . . . . . . . . . . . . . . . . . . . . . . . . . . . . . . . . . . . .  9
   0.7. Evaluation of the NRW Location  . . . . . . . . . . . . . . . . . . . . . . . . . . . . . . . . . . . . . . . . . . . .  10
   0.8. Development Needs of the Sector  . . . . . . . . . . . . . . . . . . . . . . . . . . . . . . . . . . . . . . . . . .  11
   0.9. Recommendations for Action  . . . . . . . . . . . . . . . . . . . . . . . . . . . . . . . . . . . . . . . . . . . . . .  11

1. PROBLEM & OBJECTIVE SETTING  . . . . . . . . . . . . . . . . . . . . . . . . . . . . . . . . . . . . . . . . . . . .  13
   1.1. Initial Position  . . . . . . . . . . . . . . . . . . . . . . . . . . . . . . . . . . . . . . . . . . . . . . . . . . . . . . . . . . .  14
   1.2. State of Research  . . . . . . . . . . . . . . . . . . . . . . . . . . . . . . . . . . . . . . . . . . . . . . . . . . . . . . . .  15
   1.3. Research Design  . . . . . . . . . . . . . . . . . . . . . . . . . . . . . . . . . . . . . . . . . . . . . . . . . . . . . . . . .  17

2. DELIMITATION OF VIRTUAL, MIXED AND AUGMENTED REALITY  . . . . . . . . . . . . . . . . . .  20
   2.1. Technical Delimitation  . . . . . . . . . . . . . . . . . . . . . . . . . . . . . . . . . . . . . . . . . . . . . . . . . . . .  23
   2.2. Industrial Economic Structure of the Sector  . . . . . . . . . . . . . . . . . . . . . . . . . . . . . . . . .  26
        2.2.1. Breakdown based on the Value Chain  . . . . . . . . . . . . . . . . . . . . . . . . . . . . . . . .  27
        2.2.2. Breakdown by Markets  . . . . . . . . . . . . . . . . . . . . . . . . . . . . . . . . . . . . . . . . . . . . .  29

3. THE MARKET FOR AUGMENTED, VIRTUAL AND MIXED REALITY IN GERMANY  . . . . . .  33
   3.1. Sales Performance in Germany  . . . . . . . . . . . . . . . . . . . . . . . . . . . . . . . . . . . . . . . . . . . .  34
   3.2. Use of VR, MR and AR in Germany  . . . . . . . . . . . . . . . . . . . . . . . . . . . . . . . . . . . . . . . . . .  39
   3.3. Opportunities and Challenges of the VR/MR/AR Sector  . . . . . . . . . . . . . . . . . . . . . . .  40
        3.3.1. Possible Use Cases for VR  . . . . . . . . . . . . . . . . . . . . . . . . . . . . . . . . . . . . . . . . . .  40
        3.3.2. Possible Use Cases for AR and MR  . . . . . . . . . . . . . . . . . . . . . . . . . . . . . . . . . . .  44
        3.3.3. Challenges for the Adoption of VR  . . . . . . . . . . . . . . . . . . . . . . . . . . . . . . . . . . .  46
               3.3.3.1. End Devices: Distribution, Use, Usability, Performance  . . . . . . . . .  49
               3.3.3.2. Standards and Interoperability  . . . . . . . . . . . . . . . . . . . . . . . . . . . . . .  50
               3.3.3.3. Monetization  . . . . . . . . . . . . . . . . . . . . . . . . . . . . . . . . . . . . . . . . . . . . . .  50
               3.3.3.4. Conceptual Design  . . . . . . . . . . . . . . . . . . . . . . . . . . . . . . . . . . . . . . . . .  51
               3.3.3.5. Design of the Value Chain  . . . . . . . . . . . . . . . . . . . . . . . . . . . . . . . . . . .  52

Prof. Christian Zabel                                                                                                                     2 of 92
Prof. Gernot Heisenberg
VR, MR and AR in NRW
3.3.4. Challenges for the Adoption of MR and AR . . . . . . . . . . . . . . . . . . . . . . . . . . . . 53
3.3.4.1. Technology . . . . . . . . . . . . . . . . . . . . . . . . . . . . . . . . . . . . . . . . . . . . . . . . 54
3.3.4.2. Regulatory Requirements . . . . . . . . . . . . . . . . . . . . . . . . . . . . . . . . . . . 55
3.3.4.3. Economic Requirements . . . . . . . . . . . . . . . . . . . . . . . . . . . . . . . . . . . . 55
4. NATIONAL AND INTERNATIONAL BEST PRACTICES . . . . . . . . . . . . . . . . . . . . . . . . . . . . . 57
4.1. Selected VR Cases . . . . . . . . . . . . . . . . . . . . . . . . . . . . . . . . . . . . . . . . . . . . . . . . . . . . . . . 58
4.1.1. Better than Life / Deutsche Telekom AG . . . . . . . . . . . . . . . . . . . . . . . . . . . . . . 58
4.1.2. My Brother’s Keeper / PBS . . . . . . . . . . . . . . . . . . . . . . . . . . . . . . . . . . . . . . . . . . 58
4.1.3. Opel “Adam” – Germany’s Next Top Model . . . . . . . . . . . . . . . . . . . . . . . . . . . . 58
4.1.4. MIYUBI / Felix & Paul Studios . . . . . . . . . . . . . . . . . . . . . . . . . . . . . . . . . . . . . . . . 59
4.1.5. Carne y Arena / Alejandro Gonzalez Iñárritu . . . . . . . . . . . . . . . . . . . . . . . . . . 59
4.1.6. The Void Star Wars Challenge . . . . . . . . . . . . . . . . . . . . . . . . . . . . . . . . . . . . . . . 59
4.1.7. Home – A VR Spacewalk / Rewind . . . . . . . . . . . . . . . . . . . . . . . . . . . . . . . . . . 59
4.1.8. The Cathedral / WDR . . . . . . . . . . . . . . . . . . . . . . . . . . . . . . . . . . . . . . . . . . . . . . . 60
4.1.9. Safran Nacelles and Airbus . . . . . . . . . . . . . . . . . . . . . . . . . . . . . . . . . . . . . . . . . 60
4.2. Selected AR and MR Cases . . . . . . . . . . . . . . . . . . . . . . . . . . . . . . . . . . . . . . . . . . . . . . . . 61
4.2.1. Augmented Reality Maintenance / Deutsche Telekom AG . . . . . . . . . . . . . . . 61
4.2.2. Augmented Reality Shopping / Yihaodian . . . . . . . . . . . . . . . . . . . . . . . . . . . . . 61
4.2.3. Project Esper / 3D4Medical . . . . . . . . . . . . . . . . . . . . . . . . . . . . . . . . . . . . . . . . . 61
5. THE VR AND AR SECTOR IN NRW . . . . . . . . . . . . . . . . . . . . . . . . . . . . . . . . . . . . . . . . . . . . 62
5.1. Structure of the VR/MR/AR Sector in NRW . . . . . . . . . . . . . . . . . . . . . . . . . . . . . . . . . . 63
5.2. Activities of VR/MR/AR Companies in NRW . . . . . . . . . . . . . . . . . . . . . . . . . . . . . . . . . . 68
5.3. Customers and Revenues of VR/MR/AR Companies in NRW . . . . . . . . . . . . . . . . . . . 72
5.4. Development of the NRW Location . . . . . . . . . . . . . . . . . . . . . . . . . . . . . . . . . . . . . . . . . 77
5.4.1. Significance and Evaluation of the Location from the Stakeholders’
Perspective . . . . . . . . . . . . . . . . . . . . . . . . . . . . . . . . . . . . . . . . . . . . . . . . . . . . . . . . . . . 77
5.4.2. Development Needs in NRW from the Stakeholders’ Perspective . . . . . . . . 80
6. DERIVATION OF RECOMMENDATIONS FOR ACTION . . . . . . . . . . . . . . . . . . . . . . . . . . . . . 84
6.1. Stronger Networking with Universities and Research Institutions . . . . . . . . . . . . . . 85
6.2. Training of Specialists at the Location . . . . . . . . . . . . . . . . . . . . . . . . . . . . . . . . . . . . . . 85
6.3. Regional Networking with Customers . . . . . . . . . . . . . . . . . . . . . . . . . . . . . . . . . . . . . . 86
6.4. Stronger Networking within the Sector . . . . . . . . . . . . . . . . . . . . . . . . . . . . . . . . . . . . . 87
6.5. Dedicated Support Measures for Media-related Productions . . . . . . . . . . . . . . . . . . 88
7. LITERATURE . . . . . . . . . . . . . . . . . . . . . . . . . . . . . . . . . . . . . . . . . . . . . . . . . . . . . . . . . . . . . . 89
Prof. Christian Zabel 3 of 92
Prof. Gernot HeisenbergVR, MR and AR in NRW List of Figures Figure 1: List of interview partners . . . . . . . . . . . . . . . . . . . . . . . . . . . . . . . . . . . . . . . . . . . . . . . . . . . . . . . . . . . . . . . . . . . . . . . . . . . . 19 Figure 2: The Reality-Virtuality/Mixed Reality Continuum . . . . . . . . . . . . . . . . . . . . . . . . . . . . . . . . . . . . . . . . . . . . . . . . . . . . . . . . . 21 Figure 3: Mixed Reality Scale according to Tom Saunter . . . . . . . . . . . . . . . . . . . . . . . . . . . . . . . . . . . . . . . . . . . . . . . . . . . . . . . . . . 22 Figure 4: Various Head-Mounted Display Systems (HMD) . . . . . . . . . . . . . . . . . . . . . . . . . . . . . . . . . . . . . . . . . . . . . . . . . . . . . . . . . 24 Figure 5: CAVE as Rear Projection-based Virtual Reality Display . . . . . . . . . . . . . . . . . . . . . . . . . . . . . . . . . . . . . . . . . . . . . . . . . . 25 Figure 6: Projection-based Augmented Reality Solutions . . . . . . . . . . . . . . . . . . . . . . . . . . . . . . . . . . . . . . . . . . . . . . . . . . . . . . . . . 26 Figure 7: Integration of Value Creation Stages in the B2C VR Market . . . . . . . . . . . . . . . . . . . . . . . . . . . . . . . . . . . . . . . . . . . . . . . 27 Figure 8: Value Creation Chains for VR-AR Projects . . . . . . . . . . . . . . . . . . . . . . . . . . . . . . . . . . . . . . . . . . . . . . . . . . . . . . . . . . . . . . 28 Figure 9: Target Market Content Matrix for Virtual and Augmented Reality . . . . . . . . . . . . . . . . . . . . . . . . . . . . . . . . . . . . . . . . . 30 Figure 10: Suitability of AR/MR/VR Types for Use Cases . . . . . . . . . . . . . . . . . . . . . . . . . . . . . . . . . . . . . . . . . . . . . . . . . . . . . . . . . 32 Figure 11: Worldwide VR Sales, 2014-2018 . . . . . . . . . . . . . . . . . . . . . . . . . . . . . . . . . . . . . . . . . . . . . . . . . . . . . . . . . . . . . . . . . . . . . 34 Figure 12: Virtual Reality Sales in Germany, 2016-2020 . . . . . . . . . . . . . . . . . . . . . . . . . . . . . . . . . . . . . . . . . . . . . . . . . . . . . . . . . . 35 Figure 13: Development of B2B Sales in Germany, 2016-2020 . . . . . . . . . . . . . . . . . . . . . . . . . . . . . . . . . . . . . . . . . . . . . . . . . . . . 37 Figure 14: Long-term Business Models in the VR/MR/AR Market . . . . . . . . . . . . . . . . . . . . . . . . . . . . . . . . . . . . . . . . . . . . . . . . . . 38 Figure 15: Assessment of the Attractiveness of VR Use Cases in the Next 18 Months . . . . . . . . . . . . . . . . . . . . . . . . . . . . . . . . 41 Figure 16: Assessment of the Attractiveness of AR and MR Use Cases in the Next 18 Months . . . . . . . . . . . . . . . . . . . . . . . . 45 Figure 17: Factors for the Adoption of VR . . . . . . . . . . . . . . . . . . . . . . . . . . . . . . . . . . . . . . . . . . . . . . . . . . . . . . . . . . . . . . . . . . . . . . . 47 Figure 18: Factors for the Economic Development of VR . . . . . . . . . . . . . . . . . . . . . . . . . . . . . . . . . . . . . . . . . . . . . . . . . . . . . . . . . 48 Figure 19: VR Along the Consumer Electronics Value Chain . . . . . . . . . . . . . . . . . . . . . . . . . . . . . . . . . . . . . . . . . . . . . . . . . . . . . . . 53 Figure 20: VR Along the Consumer Electronics Value Chain . . . . . . . . . . . . . . . . . . . . . . . . . . . . . . . . . . . . . . . . . . . . . . . . . . . . . . . 54 Figure 21: Regional Distribution of VR/MR/AR Companies in NRW . . . . . . . . . . . . . . . . . . . . . . . . . . . . . . . . . . . . . . . . . . . . . . . . . 63 Figure 22: Regional Distribution of VR/MR/AR Companies in NRW (survey) . . . . . . . . . . . . . . . . . . . . . . . . . . . . . . . . . . . . . . . . . 64 Figure 23: Size Classes of VR/MR/AR Companies in NRW . . . . . . . . . . . . . . . . . . . . . . . . . . . . . . . . . . . . . . . . . . . . . . . . . . . . . . . . 65 Figure 24: Distribution by Size Class and Region . . . . . . . . . . . . . . . . . . . . . . . . . . . . . . . . . . . . . . . . . . . . . . . . . . . . . . . . . . . . . . . . 66 Figure 25: Founding Dates of VR/MR/AR Companies in NRW . . . . . . . . . . . . . . . . . . . . . . . . . . . . . . . . . . . . . . . . . . . . . . . . . . . . . . 67 Figure 26: Legal Forms of VR/MR/AR Companies in NRW . . . . . . . . . . . . . . . . . . . . . . . . . . . . . . . . . . . . . . . . . . . . . . . . . . . . . . . . 68 Figure 27: Activities in VR, MR and AR . . . . . . . . . . . . . . . . . . . . . . . . . . . . . . . . . . . . . . . . . . . . . . . . . . . . . . . . . . . . . . . . . . . . . . . . . . 69 Figure 28: Product Portfolio of VR/MR/AR Companies in NRW . . . . . . . . . . . . . . . . . . . . . . . . . . . . . . . . . . . . . . . . . . . . . . . . . . . . 70 Figure 29: Formats Offered by VR/MR/AR Companies in NRW . . . . . . . . . . . . . . . . . . . . . . . . . . . . . . . . . . . . . . . . . . . . . . . . . . . . 71 Figure 30: Target Industries of VR/MR/AR Companies in NRW . . . . . . . . . . . . . . . . . . . . . . . . . . . . . . . . . . . . . . . . . . . . . . . . . . . . 73 Figure 31: Annual Sales by VR/MR/AR Companies in NRW 2016 . . . . . . . . . . . . . . . . . . . . . . . . . . . . . . . . . . . . . . . . . . . . . . . . . . 74 Figure 32: Satisfaction with Current VR/MR/AR Activities . . . . . . . . . . . . . . . . . . . . . . . . . . . . . . . . . . . . . . . . . . . . . . . . . . . . . . . . 75 Figure 33: Satisfaction with VR/MR/AR Activities in 18 Months . . . . . . . . . . . . . . . . . . . . . . . . . . . . . . . . . . . . . . . . . . . . . . . . . . . 76 Figure 34: Importance of a Specific Location for the Success of VR/MR/AR Activities . . . . . . . . . . . . . . . . . . . . . . . . . . . . . . . . 77 Figure 35: Geographical Focus of Corporate Activities . . . . . . . . . . . . . . . . . . . . . . . . . . . . . . . . . . . . . . . . . . . . . . . . . . . . . . . . . . . . 78 Figure 36: Geographical Focus of Corporate Activities . . . . . . . . . . . . . . . . . . . . . . . . . . . . . . . . . . . . . . . . . . . . . . . . . . . . . . . . . . . . 79 Figure 37: Development Needs from the Perspective of VR/MR/AR Companies . . . . . . . . . . . . . . . . . . . . . . . . . . . . . . . . . . . . . 80 Prof. Christian Zabel 4 of 92 Prof. Gernot Heisenberg
VR, MR and AR in NRW

0. EXECUTIVE SUMMARY

Prof. Christian Zabel                  5 of 92
Prof. Gernot Heisenberg
VR, MR and AR in NRW

0.1. Study Design
. The design of the study combines several investigation steps: Desk research, complete
    survey and online survey of virtual reality (VR) / mixed reality (MR) and augmented reality
    (AR) companies in NRW as well as interviews with experts.

.   The focus of interest is on trends, potentials and risks in the VR/MR/AR industry, the struc-
    ture and development of the industry in NRW and the need for support measures.

.   A total of 101 VR/MR/AR companies in NRW were identified, 43 of which took part in the
    online survey. The sample is representative in terms of location, company age and size. In
    addition, 13 experts from different sub-areas of the VR/MR/AR industry were interviewed.

0.2. General Development of the Industry
. Forecasts predict strong growth in the VR/MR/AR industry: According to PWC, VR alone
    is expected to generate sales of over €1 billion in the German consumer market in 2020.
    According to estimates by Deloitte, the B2B segment for VR/MR/AR applications could
    amount to €840 million in Germany in 2020. However, the growth achieved in the industry
    has recently lagged behind these forecasts.

.   In the medium term, AR and possibly MR are expected to represent the larger share of the
    market. However, in the short term, experts attribute higher relevance to VR.

0.3. Opportunities and Challenges for VR
. Over the next 18 months, the NRW companies see potential primarily in B2B applications
    in the area of training, e.g. for employees (83% of respondents) and in the area of design/
    simulation, e.g. for the development of prototypes (77%). With regard to end customers,
    information/entertainment (65%) and product presentations/experiences, e.g. at the point
    of sale, but also in the event trade show sector (62%), are regarded as promising.

.   In addition to games, media-related applications will primarily include 360° videos, volu-
    metric (i.e. holographic) and interactive videos. It is expected that moving image content
    will increasingly be produced in addition to linear film and TV productions.

.   However, the implementation of VR faces several challenges. These include, above all,
    devices that are not yet sufficiently powerful or easy to use, especially in the case of dis-

Prof. Christian Zabel                                                                       6 of 92
Prof. Gernot Heisenberg
VR, MR and AR in NRW
play systems. In addition, the knowledge, dissemination and actual use of the systems is
currently too low.
. Other deficits identified include a lack of standards and interoperability of systems and
applications as well as a lack of monetization models (beyond B2B applications). In addi-
tion, conceptual hurdles still have to be overcome, for example in the area of user interac-
tion and narration.
. Finally, the structure of the sector with a small number of providers controlling the central
platforms is seen as problematic for its profitable development in the long term.
0.4. Opportunities and Challenges for AR and MR
. In the AR and MR field, NRW companies expect the training of employees (68%) and sup-
portive deployment in production/maintenance/service (65%) to be the most common
fields of application. Design/simulation (56%), experience/product presentations (53%)
and support systems/navigation aids (53%) are also rated as attractive.
. Similar deficits are identified in the AR and MR segments as in the VR segment. First and
foremost among them is the inadequately mature technology for the mass market, espe-
cially in the MR segment. Many devices (HoloLens etc.) are too expensive and currently not
powerful enough for widespread use (also in the B2B sector). In addition, challenges are
seen in data processing and data transmission especially.
. For ‘low-end’ AR applications, the smartphone provides an extensive device base. Here, it
is expected that rapid development of new applications will begin using Apple and Google’s
AR software developer kits.
. In addition to structural regulatory requirements, MR and AR providers in the consumer
segment also face the economic challenge of establishing value creation models.
0.5. Structure of the VR/MR/AR Sector in NRW
. The sector in NRW displays a strong regional concentration: 46 of the 101 companies have
their registered offices in Cologne or Düsseldorf. Other important centers are Aachen (7)
and Bonn (5).
. Most companies are also rather small: A third of them have less than ten employees,
another quarter less than 50.
Prof. Christian Zabel 7 of 92
Prof. Gernot HeisenbergVR, MR and AR in NRW
. The number of VR/MR/AR startups has accelerated: A good quarter of the companies were
founded in the last three years. However, many companies are more than ten years old, so
they were already involved in ‘earlier waves’ of VR.
. The companies are primarily active in the VR sector (91% of respondents; AR: 71%, MR:
50%). The boundaries between the three offered forms are becoming blurred: 40% of the
companies were active in all three fields.
. With regard to the products and solutions currently sold, information and entertainment
offerings, e.g. news videos or games, are ahead (59%). Experiences/product presentations
were also frequently mentioned, before design/simulation (56%) and training (54%). Appli-
cations in the areas of manufacturing/maintenance/service (29%), conferencing (20%) or
support systems (10%) are developed and sold much less frequently.
. In terms of product forms, moving image content (360°, interactive or volumetric videos)
is the most common (63%), followed by product presentations (48%) and prototypes (43%),
followed by games (30%) and serious games (23.5%).
0.6. Customer and Revenue Structures
. NRW companies most frequently work for the media/information and communications
sector (here primarily for film and television) and the manufacturing industry (46% each).
This is followed by hospitality/tourism (32%), science & research (27%), medicine/health-
care and arts & entertainment (24% each).
. Almost half (49%) of the companies surveyed generated less than €100,000 with VR/MR/AR
in 2016, 11% of them less than €20,000. Notwithstanding, 29% of the companies reported
VR/MR/AR-related sales of more than €100,000, but less than €1 million. Three companies
realized sales volumes of over €2 million with VR/MR/AR.
. The companies are rather satisfied with their VR/MR/AR-related business development
(value of 2.63 on a five-level Likert scale with 1 = very satisfied to 5 very dissatisfied). The
assessment is therefore more cautious than the public discussion surrounding VR/MR/AR
would suggest.
. However, the companies expect a significant improvement in the business prospects in the
next 18 months (value of 2.06, same scale).
Prof. Christian Zabel 8 of 92
Prof. Gernot HeisenbergVR, MR and AR in NRW
0.7. Evaluation of the NRW Location
. Only 40% of the companies surveyed generally assign an important or very import-
ant role to the location of their company for the success of VR/MR/AR activities.
By their own admission, the companies are nationally or internationally oriented in most
areas of their activities (customer acquisition, integration of suppliers, research facilities,
etc.). The exception is the recruitment of new employees, which takes place primarily at
regional level.
. For the specific location of North Rhine-Westphalia, good access to potential employees
is rated as important (value of 1.97 on a five-level Likert scale from 1 (very important) to
5 (absolutely unimportant)). This is followed by access to customers in the region (2.08)
and to freelancers for individual projects (2.21), networking with other local VR companies
via meetings and conferences (2.26) and the regional exchange of information via groups,
events or associations (2.28).
. Proximity to the creative and media industries is also regarded as significant (2.38). For the
companies based in Cologne, this is the most important factor (1.65).
. Also of relevance are proximity to research institutions (2.54), location promotion (2.64),
proximity to technical service providers (2.77) or other companies in the sector (2.82).
. For companies less than three years old, proximity to other startups (2.54) also plays an
important role.
Prof. Christian Zabel 9 of 92
Prof. Gernot HeisenbergVR, MR and AR in NRW
0.8. Development Needs of the Sector
. Initially, the intensification of cooperation between universities/research institutions and
industry is considered to be a priority (58%), including stronger cooperation in calls for ten-
der in scientific research projects with practical relevance. At the same time, universities
are important for recruiting employees (see above).
. 50% also see better regional networking with customers in the B2B environment as a
priority. First of all, the concrete knowledge of the application possibilities of VR/MR/AR
for ‘first-time buyers’ should be promoted, as should networking with customers already
active in this field.
. Exactly 50% would also like to see an expansion of education and training. Overall, the
training opportunities in NRW are good, but there are bottlenecks, for example with ‘cre-
ative coders’ or Unity/Unreal developers. In view of this rapid development, offers for fur-
ther vocational training of employees are also necessary.
. Finally, networking among companies (37%) and improved lobbying by industry associ-
ations are also considered important. Here, other locations such as Berlin or Hamburg
are currently perceived to be more effective. Ideally, initiatives in this respect would not
only consider individual cities, but also regions (especially Cologne-Düsseldorf) and other
value-added areas (e.g. the European region of Aachen/Belgium/Netherlands).
0.9. Recommendations for Action
. Stronger Networking with Universities and Research Institutions This could be achieved
by creating a forum modeled on the example of VDC Fellbach or the AVARE network in
Chemnitz, which brings together users, suppliers and research institutions. First initiatives
already exist here (e.g. at RWTH Aachen University). An expansion should reflect the varied
structures of the regional value-added areas.
. Training of Specialists at the Location: At first, the development of part-time training as
a ‘Digital Producer’ (especially with regards to media-related production) seems to make
sense. In addition, film and media students could be made more aware of the potential of
the medium during their studies, e.g. via pop-up movie theaters or VR arcades. Finally, the
establishment of a stronger cross-organizational exchange on specific specialist topics
(possibly in the context of established industry events, see below) could help to promote
Prof. Christian Zabel 10 of 92
Prof. Gernot HeisenbergVR, MR and AR in NRW
the acceptance and use of VR/MR/AR in companies themselves.
. Regional Networking with Customers via a Multi-step Approach: First, low-threshold
‘evangelization’ should be intensified through information events and programs, e.g.
through chambers of industry and commerce or industry associations. Test labs and view-
ing rooms should be created for initial collaborations/demonstrations. A model here is the
XR Lab of the Digital Hub in Cologne or the planned Center for Immersive Technologies at
the Cologne Game Lab/TH Cologne. The third element that is recommended is the targeted
contacting of customers at events and trade shows. In this respect, the establishment of a
leading regional trade show on the subject is advisable; the first steps have already been
taken with the Digility Conference. Finally, it would be worth considering strengthening
visibility by establishing a prize with international appeal, e.g. as part of the German Devel-
oper Award or the leading trade show.
. Networking within the Sector: Here, people should first be made more aware of low-thresh-
old offerings (e.g. meetups) of existing initiatives, with the addition of thematically focused
opportunities for professional exchange in the sense of a ‘community of practice’. It is also
advisable to set up a regionally focused industry association that will attract attention and
act as a forum for professional exchange and networking with science and customers.
. Dedicated Support Measures for Media-related Productions: While functioning val-
ue-added systems have already emerged in industrial applications, this applies only to a
very limited extent to media-related VR/MR/AR applications. It would therefore be worth
considering the introduction of a targeted support system to help productions or compa-
nies that are active in this field. This requires the creation of suitable framework conditions
for substantial, targeted and efficient support measures in the various sub-areas that are
relevant to VR/AR. For example, the NRW Film and Media Foundation's support program
for digital content, which has been running since 2011, would provide a suitable program
in this sense, although it would require access to greater funding. In addition, media-re-
lated support could address content-specific consulting needs that ‘general’ incubators,
co-working spaces, etc. can only accommodate to a limited extent. This could be achieved,
for example, through a dedicated specialist program on VR/MR/AR-specific aspects of
media production and distribution.
Prof. Christian Zabel 11 of 92
Prof. Gernot HeisenbergVR, MR and AR in NRW 1. PROBLEM & OBJECTIVE SETTING Prof. Christian Zabel 12 of 92 Prof. Gernot Heisenberg
VR, MR and AR in NRW

1.1. Initial Position
VR and MR applications have been the focus of companies working on innovative content and
services since the release of the first Google Glasses in 2012. These range from virtual fitness
applications, immersive games and film experiences to virtual showrooms and simulators
for training purposes. In the same way, augmented reality (AR) applications have triggered
storms of enthusiasm since the release of Pokémon Go and made mass use possible.

However, these technical approaches are nothing new. The beginnings of the technology go
back to the first Head-Mounted Displays (HMD), which came from military research in the
early 1990s and made industrial applications possible. The fact that this technology only
made the leap into use within the industry is due to the high costs for the necessary com-
puter technology at the time and the significant know-how requirements for operation, as
well as the low wearing comfort of the HMDs. The resulting rear projection-based systems
such as CAVEs and responsive workbenches, on the other hand, have at least contributed to
the spread of VR technology within the global automotive and aerospace industries. The VR
technology of the time never really made the leap into other industries.

AR applications have been researched very intensively in the context of national funding proj-
ects such as ARVIKA since their emergence at the beginning of the 2000s at the latest, and
their application in the field of simulation and support of industrial maintenance tasks has
been evaluated. (Friedrich, 2004). Here, too, the beginnings of AR technology were unsuited to
the mass market due to their elaborate use and high costs.

With the advent of powerful and easy-to-use smartphones, VR/AR technology now appears
to be suitable for the mass market:

.   With the aforementioned Pokémon Go, Google CardBoard as an output device or various VR
    gaming systems, popular applications for the masses are successful in the market.

.   In addition, companies see enormous potential in raising their customer communication
    to a new level. Various companies would like to use VR/MR/AR and offer their customers
    new 360-degree experiences.

.   Both technologies are also suitable for the preparation of media content – a number of
    high-quality showcases and applications have already been created so far.

.   Finally, VR and AR systems can be used to increase productivity and organize workflows
    more efficiently (e.g. in production, maintenance of complex machines).

Prof. Christian Zabel                                                                     13 of 92
Prof. Gernot Heisenberg
VR, MR and AR in NRW
As a result, in addition to established players, numerous new companies have been set up in
Germany and especially in NRW to satisfy the strong rise in demand for VR/MR/AR content
and services. However, this growth opportunity for the (media) economy in NRW has not yet
been investigated. Thus, apart from anecdotal evidence, it is not known which companies are
actually working on these technologies, which competences are available at the location and,
above all, what demands exist with regard to qualification, promotion and networking. These
questions form the core of this study.
The client is the Mediennetzwerk [Media Network] NRW. The research is dated from Novem-
ber 30, 2017.
1.2. State of Research
The present study can be classified as research on (media) clusters – a field
that has generated sustained scientific interest in recent years. (Boix, Hervás-Ol-
iver, & De Miguel-Molina, 2015: 753). A cluster can be fundamentally described as
“a geographically proximate group of interconnected companies and associated
institutions in a particular field, linked by commonalities and complementaries”
(Porter, 1990: 16).
Three fundamental reasons for the emergence of successful media clusters are discussed in
the literature (Moomaw, 1988):
. Urbanization advantages that arise from a ‘media-appropriate’ environment (culture,
nightlife, living space, etc.).
. Agglomeration advantages resulting from the proximity of companies to one another (e.g.
synergies/production networks, local talent pools)1.
. Localization advantages that arise from the binding of companies to a specific location (e.g.
connection to studio infrastructure or central anchor companies in the industry).
Today, with a view to the media industry, numerous case studies are available discussing the
success factors of individual clusters (for an overview, see Komorowski, 2017). The signifi-
cance of the individual factors varies depending on the sub-sector under consideration (e.g.
audiovisual media, new media, creative industry or print media), although media convergence
1 For example, a high density of companies, numerous suppliers and local customers all contribute to the success of
startups. (Pe’er & Keil, 2013).
Prof. Christian Zabel 14 of 92
Prof. Gernot HeisenbergVR, MR and AR in NRW
is making it increasingly difficult to distinguish between them. (Achtenhagen & Picard, 2014).2
Therefore, approaches that are based on industrial cluster research (Markusen, 1996) are
more promising when they focus on the dominant processes that shape the cluster (Gordon
& McCann, 2000).
The small and medium-sized (audiovisual) media companies in particular tend to benefit
from geographical proximity in a cluster, which facilitates personal exchange, for example in
the acquisition, recruitment or transfer of ‘tacit knowledge’. (Blackburn & Conway, 2008). This
is especially true since media content is mainly produced on a project-by-project basis. How-
ever, it is crucial that companies are not only close to one another. The effect of the cluster
depends to a significant degree on the intensity of the interactions within the group (Virta &
Lowe, 2017: 15). Here, the strength, connections and dependencies of the nodes within the
value creation network are particularly crucial (Håkansson & Ford, 2002).
The example of the creative industries also shows that individual sectors can often be found
at the same locations – this applies in particular to the film, video/music, software, culture,
video games, design, construction and architecture sectors. Finally, regional clusters can
work across countries (for an analysis at the European level based on business data, see
(Boix et al., 2015)).
The view ‘from the industry perspective’ is also particularly important for companies in the
‘new media’ sector. In the literature, it is assumed here that these work more strongly across
regions: “(they) do not have the well-defined but disintegrated production functions upon
which local concentration could be built” (Achtenhagen/Picard 2014: 230). In their study of
German multimedia clusters, Fuchs and Koch, for example, show that proximity to key cus-
tomers from the media industry was more important than the emergence of cooperative
networks between multimedia companies. (Fuchs & Koch, 2005). In the case of new media
clusters in Dublin and Sussex, on the other hand, no such effects could be demonstrated for
new media companies. (Bayliss, 2007; Blackburn & Conway, 2008).
1.3. Research Design
The state of research suggests that the factors for the establishment of new media com-
panies – including VR and AR companies – may differ from those in ‘traditional’ sectors. In
2 Komorowski proposes a definition of media clusters according to the seven criteria – place, proximity,
population, profile, path-dependency, policy, performance (Komorowski, 2017)
Prof. Christian Zabel 15 of 92
Prof. Gernot HeisenbergVR, MR and AR in NRW addition to a description of the virtual and augmented reality industry, it is therefore neces- sary to examine separately which aggregation factors play a special role for companies. All in all, a three-step analysis is to be carried out in this way. The first part examines how companies assess the long-term attractiveness of the VR and AR market. For this purpose, the companies will be asked about expected trends and strategic perspectives. Then, in a second step, it can be asked which specific expectations and requirements of the location exist. The findings can then provide important information for the further development of public sector support measures. The following three questions are to be posed: Q1: What is the status quo of the VR/AR sector in NRW and what are the strategic development perspectives (trends, potentials, risks) from the point of view of the market participants? Q2: How important are agglomeration, localization and urbanization effects for the choice of location and the success of companies in the VR/AR sector? Q3: What concrete funding/support needs are there in the industry? What measures could be suitable, specifically for NRW as a business location? In order to be able to answer the questions, the key players in the North Rhine-Westphalian VR/AR sector were identified by means of own research (desk research). The companies were then interviewed using a standardized online survey on activities, industry focus, com- pany data, strategies, perspectives and needs. In addition, guided expert interviews were conducted with 13 selected institutions in order to obtain high-quality primary material on strategies and needs as well as current and future VR, MR and AR cross-sectoral topics. Prof. Christian Zabel 16 of 92 Prof. Gernot Heisenberg
VR, MR and AR in NRW

The units of the population were recorded by means of manual research and modified
snowball sampling, since no registers or similar exist for this area. For this purpose, special
search tables with search terms linked by Boolean operators, which were also subjected to a
synonym check and an English translation, were used. If companies were identified in NRW,
the company's website, Wikipedia entries, any job advertisements on industry portals, etc.
were analyzed in closer detail in a subsequent step.

In addition to researching general information on the company (registered office, legal form,
year established, management, number of employees), the target industries and the forms of
VR/MR/AR offered were surveyed. A total of N=101 companies were identified and analyzed.
Thus, the basic population in NRW was surveyed as completely as possible.

The survey of all companies in the population was then carried out in a second step using a
standardized online questionnaire. The field phase of the survey ran from November 6 to 30,
2017. The companies were asked to take part in the survey in three waves. A total of 43 orga-
nizations responded,3 which corresponds to a pleasingly high response rate of approx. 43%.

Thirdly, selected industry experts and company representatives were interviewed for the
study (see Figure 1). The survey was conducted mainly in personal interviews, partly by tele-
phone on the basis of a partially structured interview guideline. The interviews were con-
ducted in October and November 2017 and lasted an average of 40-60 minutes.

3   The gross figure of 44 responses had to be adjusted for an organization that did not provide any
    usable data.

Prof. Christian Zabel                                                                                          17 of 92
Prof. Gernot Heisenberg
VR, MR and AR in NRW
Figure 1: List of Interview Partners
Name & Function Position Company
Clarissa Kyrion Marketing & Partnership Manager VIRE GmbH
Thomas Hallet Innovation Lab Director WDR
Frank Heineberg, Senior Manager Program Distribution CBC/RTL Group
Eckhardt Köberich Head of VR ZDF Digital
Maik Herrmann Client Service Director; Pixelpark AG
Dirk Krause Innovation Lab Director
Ulrike Stemmer Senior Strategic Planner Denkwerk GmbH
Prof. Torsten Kuhlen IT Center of RWTH Aachen, Director RWTH Aachen
Boris Kantzow Managing Director Weltenmacher GmbH
Arne Ludwig President EDFVR e.V.
Michaela Dierking Managing Director Virtalis GmbH
Kristian Costa-Zahn Head of Creation UFA Lab
Stephan Heininger Virtual Reality Director Telekom Deutschland GmbH
Prof. Björn Bartholdy Co-Director Cologne Game Lab Cologne Game Lab
Source: Own research
Prof. Christian Zabel 18 of 92
Prof. Gernot HeisenbergVR, MR and AR in NRW 2. DELIMITATION OF VIRTUAL, MIXED AND AUGMENTED REALITY Prof. Christian Zabel 19 of 92 Prof. Gernot Heisenberg
VR, MR and AR in NRW

Reifinger defines the distinction between Virtual Reality (VR) and Augmented Reality (AR) as
follows: “While VR completely separates the user from their real environment and replaces
it with a virtual environment, AR expands the user's real environment by adding a virtual
environment” (Reifinger, 2008: 10).

This definition is helpful, but the question arises as to whether this boundary should always
be drawn so sharply. Based on this question, Milgram et al. created a first definition back in
1995, which can be used to classify the different forms of virtual and augmented reality in a
continuum (Milgram, Takemura, Utsumi, & Kishino, 1995). This has now become an agreed
standard. Figure 2 shows the different terms and expressions in a so-called mixed reality
continuum.

Figure 2: The Reality-Virtuality/Mixed Reality Continuum

                                    MIXED REALITY (MR)

        REAL               AUGMENTET                AUGMENTET                   VIRTUAL
    ENVIRONMENT            REALITY (AR)           VIRTUALITY (AV)             ENVIRONMENT

                                                               Source: According to Milgram et al., 1995

The so-called mixed reality scale by Tom Saunter – a simplified version of the virtuality con-
tinuum – is helpful to better classify the current media forms (see Figure 3).

Prof. Christian Zabel                                                                          20 of 92
Prof. Gernot Heisenberg
VR, MR and AR in NRW
Figure 3: Mixed Reality Scale according to Tom Saunter
lit
y es
a ty a ga
m
y m ali rtu
lit ine dr
e
dv
i o y
ea n/
c
e e ide ea
lit
lr o nt nt t/v lr
sic
a isi e e ne ua
y lev gm gm er t
Ph Te Au Au Int Vir
The Real The Virtual
Source: http://digitalcortex.net/tag/table
In simple terms, Saunter distinguishes between the real and virtual worlds and shows where
television and cinema as well as the Internet and video games fall on the scale. This approach
is very useful when attempting to classify current media forms. Television and movies are
digitally recorded versions of the real world, whereas Internet sites or video games are com-
pletely virtual. The difference from virtual reality lies in the fact that in virtual reality, the
feeling of immersion is conveyed. Immersion is the illusion of being part of a virtual world.
On the Internet or in video games, this immersion can only be experienced to a very limited
extent, if at all. This delimitation disappears somewhat with the latest technology, but an
unbridgeable gap remains fundamentally on the immersion level.
This study focuses on the VR (virtual reality) and AR (augmented reality) media forms. The
mixed forms are recorded accordingly in MR (mixed reality).
Prof. Christian Zabel 21 of 92
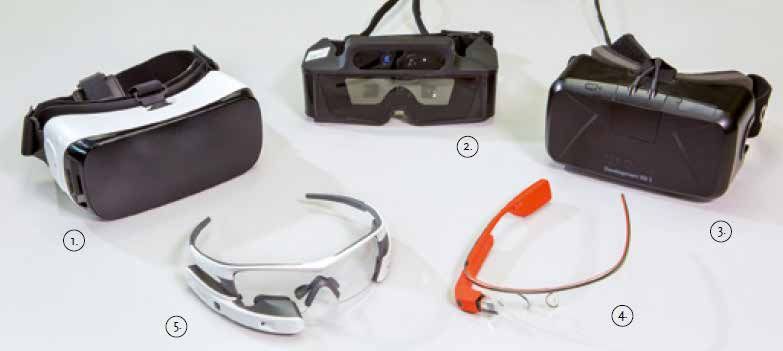
Prof. Gernot HeisenbergVR, MR and AR in NRW 2.1. Technical Delimitation The terms 360° and virtual reality are not sufficiently distinguished in literature and espe- cially on the web. However, they should be differentiated in the context of this study in order to allow for a meaningful evaluation, since the production and use of the media types differ greatly. This distinction results in different needs with regard to qualification and technolog- ical promotion. 360° videos are produced with real (e.g. concert recordings, nature films) or animated con- tent (e.g. the virtual reconstruction of Cologne Cathedral). In addition, there is often free spa- tial movement. This is relatively easy, especially with animated content. For 360° videos with real content, perspectives and the direction of movement are usually prescribed (e.g. roller coaster ride). Accordingly, 360° photos are not considered in the following, but moving image content is. 360° videos are often also referred to as VR videos; the term interactive video is also com- mon. However, this requires the viewer not only having the possibility to freely select the perspective and direction of movement, but also the possibility to influence the narrative of the video within an interactive framework. This is possible by means of projected control elements and can, for example, include influencing a plot line and also enable the selection of a scene change. It is important to emphasize that there are currently no agreed standards for the production of VR videos. 360° videos, which from a technical perspective are relatively easy to realize, are currently spreading via social networks as a new content format. AR videos also focus on interaction with the content. Here, virtual, graphic components are added to the perceived real world. In addition to scenic applications, interactive AR videos are often used as installation guides and as work support systems. The way in which 360° as well as VR and AR videos can be consumed and which of the above-mentioned properties of the media forms are accessible depends strongly on the type of output device, that is, the display. Basically, there are two classes of output devices: . Head-mounted display systems . Projection-based systems Video glasses represent the simplest form of a so-called Head Mounted Display (HMD). This consists of a head mount, one or two miniature screens, headphones and usually additional Prof. Christian Zabel 22 of 92 Prof. Gernot Heisenberg
VR, MR and AR in NRW

screens that allow video information to be viewed undisturbed by external optical stimuli.
Video glasses are mainly used in the private sector to watch videos from DVDs or TV pro-
grams and streams, as well as for computer games (see Figure 4). These are divided into bin-
ocular systems (1, 2 and 3 in Figure 4) and monocular systems (4 and 5). HMDs are available
as see-through (augmented reality) and non-see-through (virtual reality or 360°) variants
(Federal Institute for Occupational Safety and Health (BAuA), 2016).

Figure 4: Various Head-mounted Display Systems (HMD)

                                              Source: Federal Institute for Occupational Safety and Health, 2016

VR glasses contain additional sensors to detect the movement of the head, which are import-
ant for influencing perspective and/or direction of movement. Input devices are interaction
devices such as game controllers, gloves, 3D mice, etc. that are used to interact with the
content. Modern, contactless operation by means of gesture recognition via cameras or elec-
tromagnetic systems also enables seamless interaction with the displayed content.

In contrast to HMDs such as video glasses and VR glasses, AR glasses project virtual infor-
mation in front of the user's eyes, while its display is not visually shielded from the outside
world. Depending on the type of glasses (monocular or binocular) 2D videos or Internet pages
can be displayed (e.g. monocular Google Glasses) or 3D graphics can be projected into the
field of view (e.g. binocular Microsoft HoloLens).

Prof. Christian Zabel                                                                                  23 of 92
Prof. Gernot Heisenberg
VR, MR and AR in NRW As an alternative to the head-mounted variants of AR and VR, there are also projection-based variants. Currently, most common and also simplest form are the 3D-stereoscopic cinema films, which however are not VR applications in the literal sense due to the lack of interaction options. Projection-based systems include the so-called CAVEs (Cave Automatic Virtual Envi- ronment) as rear projection-based VR displays. CAVES are mainly used in research and for 3D prototyping in the automotive, aerospace and robotics industries. The illustrations in Figure 5 and Figure 6 give an impression of the possibilities and size of the projections. Figure 5: CAVE as Rear Projection-based Virtual Reality Display Source CC BY-SA 3.0: https://upload.wikimedia.org/wikipedia/commons/1/1e/Roboterbasierter_Flugsimulator_Grenzebach_FlightSim.jpg Prof. Christian Zabel 24 of 92 Prof. Gernot Heisenberg
VR, MR and AR in NRW
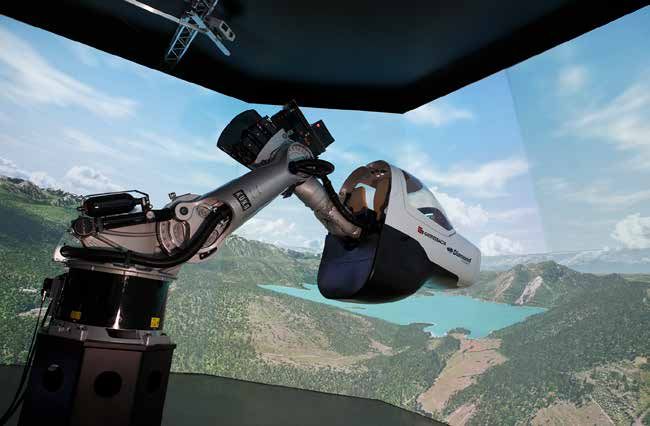
Figure 6: Projection-based Augmented Reality Solutions
Source: Own research from the BMBF Project: “Development of an augmented reality system for intraoperative navigation
using the example of individual graft design in oral and maxillofacial surgery”.
2.2. Industrial Economic Structure of the Sector
The VR/MR/AR sector describes a comprehensive ecosystem with numerous overlaps
between the individual sub-sectors. For a more detailed analysis, a grid will first be devel-
oped to structure the activities more precisely. In this context, it is advisable to group the
companies according to their position within the value creation chain. In addition, market-re-
lated target industries and the content/functionalities offered can then be defined.
Prof. Christian Zabel 25 of 92
Prof. Gernot HeisenbergVR, MR and AR in NRW
2.2.1. Breakdown Based on the Value Chain
Overall, a distinction must be made between different submarkets for VR, MR and AR, which
are each served at different stages of the value chain. In principle, the value chain of media
production can be used as the basis for a general description of the sector.
This shows that different emphases can be identified here. Established media players and
also large (Internet) corporations are trying to penetrate the market and thereby achieve
greater vertical integration. The example of the consumer VR segment (see Figure 7) shows,
for example, that social networks and data-driven online players are trying to largely occupy
the value chain, whereas traditional media companies tend to limit their activities to aggre-
gation and production.
Figure 7: Integration of Value Creation Stages in the B2C VR Market
Content Infrastructure Device
Aggregations CE retail
producers providers manufacturers
TV stations
Publishing companies
Game developers
Social networks
Data-driven
online/media players
TC network operators
Hardware manufacturers
Retailers
Source: BITKOM, 2016
BITKOM and Deloitte expect that “the ‘winner takes all’ principle that dominates the Internet
world and the associated oligopoly formation (...) will presumably also be continued in the
field of virtual reality" (BITKOM, 2016). Here, large players active at several stages of the value
chain have the advantage of occupying the market. With a view to the North Rhine-Westpha-
lian VR/MR/AR sector, none of these globally active companies are currently based locally.
Prof. Christian Zabel 26 of 92
Prof. Gernot HeisenbergVR, MR and AR in NRW
However, in the B2B market, there are players who play a similar role – albeit much more
specifically – and who themselves cover various stages of the value chain. However, this is
the exception rather than the rule.
The majority of the companies surveyed are active in the first two stages of the value chain.
Therefore, the value chain for this sector is broken down once again. This is based on a more
project-oriented perspective that covers the entire acquisition/production process (see also
the example of product development Berg & Vance, 2017: 11).
Figure 8: Value Creation Chains for VR-AR Projects
Acquisition of orders, e.g. as part of a
e.g. advertising agencies
1. Contracting marketing concept
Development of a content and interaction
2. Storyboard/ concept (360˚ video, interactive, e.g. production companies
Interaction Concept immersive experience…)
3D graphic modelling, animation, film
e.g. digital agencies
3. Design/Artwork material (content production)
Implementation on third-party frameworks;
implementation in proprietary software e.g. technical VR/AR providers
4. Programming
solutions is rare
Procurement of third-party hardware;
e.g. digital platforms, system
provision of proprietary hardware solutions
5. Hardware integrators
is rare (exclusively system integrators)
Refinancing by means of advertising,
e.g. media houses
6. Refinancing subscriptions etc.
Acquisition of new users (B2C) /
e.g. mobile agencies
7. Marketing & Sales sale of the solutions to the market (B2B)
Networking with other platforms, generation
e.g. advertising marketers
8. Networking of new value added
Source: Own research
By the time a contract is signed, an understanding of which issue requires a solution and the
customer’s value chain will typically have been established already. This basis is then used
Prof. Christian Zabel 27 of 92
Prof. Gernot HeisenbergVR, MR and AR in NRW
to develop the storyboard, whereby a particular focus is placed on the interaction concept.
Prominently included in this step will be a specification of how immersive and interactive
the experience should be. In particular, this will include a definition of the forms in which the
VR/MR/AR application will be offered. Implicitly, this determines the downstream stages 3, 4
and 5. Complex 3D animations and models are generated when producing the artwork and
design. The design is not focused exclusively on the look and feel of the content, but can also
extend to the user interface (especially as there is currently a lack of overarching standards
(cf. Chapter 3.3.3.).
Programming and hardware at stages 4 and 5 are frequently steps that can be outsourced
or purchased directly. In this case, the system integration phase for the sub-steps (content,
programming and hardware) acquires a particular significance. As presented here, program-
ming describes application programming that uses suitable frameworks for the purpose of
implementation. Given that some forms of VR/MR/AR applications tend to be designed for
the no-cost market, stage 6 of the value chain carries particular weight, as it deals with the
issue of identifying refinancing opportunities, e.g. through integrated advertising or in-app
purchases. Many forms offered in the B2B segment especially are custom builds, intended
to resolve an issue that is specific to an individual customer, so designing the product to be
suitable for resale is of considerable importance on the B2C and B2B markets. Connectivity
with other services, platforms and offerings is the final stage in the value chain.
2.2.2. Breakdown by Markets
Relevant literature currently distinguishes a number of core sectors in which virtual, mixed
and augmented reality content is used. For the sake of clarity, manufacturing industries are
grouped as one sector, although it encompasses a number of different sub-sectors (e.g. auto-
motive, aviation).
The individual sectors crop up to differing degrees in content offerings or application sce-
narios that can be implemented beneficially using virtual, mixed and augmented reality. In
essence, the distinguishing feature is whether they are intended for use in a B2B or B2C
context, although a certain overlap is identifiable. The various content/application forms can
be delimited as follows:
. Education/Information: This refers in particular to content produced by media providers,
for instance 360° videos on current affairs. In this context, the New York Times was an
Prof. Christian Zabel 28 of 92
Prof. Gernot HeisenbergVR, MR and AR in NRW
early adopter, offering its subscribers a free Google Cardboard viewer that could be used
to access published content.
. Entertainment: This area encompasses the plethora of showcases, especially sporting
events, in which widespread interest, personal investment and a willingness to pay are
most likely to coincide. Other application areas include concerts/music, although users
have not yet demonstrated a sufficient willingness to pay, despite the considerable success
of individual productions (EDFVR, 2017: 26). Gaming content is currently among the ‘killer
applications’ in this field. Sophisticated VR games for consoles and smartphone-based
applications are both becoming increasingly popular, as evidenced by Pokémon Go.
Figure 9: Target Market Content Matrix for Virtual and Augmented Reality
Manufacturing industry
Advertising/marketing
Live entertainment
Arts/architecture
Logistics
Medicine
Tourism
Gaming
Military
Media
Education/information
B2C
Entertainment (incl. gaming)
Assistance systems
B2B
(utility/wayfinding)
Experience/product presentation
Education/training
Maintenance/service/production
Design/simulation
Conferencing & collaboration
Source: Own research
. Assistance systems that enable spatial orientation represent a third application form.
Numerous consumer-oriented applications are available in this segment, e.g. in tourism
as well as among live entertainment providers (museums, amusement parks, etc.). Logis-
Prof. Christian Zabel 29 of 92
Prof. Gernot HeisenbergVR, MR and AR in NRW
tics companies are also active in the B2B segment, alongside companies that are keen
to optimize their internal warehousing/picking and to manage their flow of goods. For
instance, DHL was able to cut the time required for picking by 25% in a pilot project in the
Netherlands (Roth, Zanker, Martinetz, & Schnalzer, 2015: 21).
. Another hybrid use case that is of equal interest to consumers and business customers
alike is the design of product presentations, i.e. ‘experiences’. Numerous use cases cur-
rently exist on the B2C market. They range from apps that allow users to position furniture
in a virtual rendition of their homes, to mirrors that project possible outfits onto the cus-
tomers and even the virtual presentation of a customer’s new car at a trade show stand.
While these use cases are naturally crucial in the areas of marketing & promotion, they are
vital to providers in the fields of arts & architecture as well.
. In the area of education & training, VR, MR and AR applications allow course participants
to complete simulations or to obtain additional information on specific subject matter.
There is a particular need for this kind of application in the industrial sector, but also within
medicine and the armed forces, as upstream simulation of such complex and potentially
critical live situations offers significant advantages.
. Applications in the areas of maintenance/service/production follow the same logical prin-
ciples: They are mainly concerned with using augmented reality as a means of optimizing
workflows. Studies conducted in the aviation sector indicate that searching for printed
documents accounts for around 40% of the time expended on maintenance (Kluge, 2009).
In particular, a greater focus on information-assisted processing enables standardization
of workflows that in turn ensures more collaborative completion – with all the associated
optimization potential (Roth et al., 2015: 30).
. Design and prototype manufacturing is a specific category within the production pro-
cess. Industrial enterprises and the scientific community can benefit significantly from this
application. ‘Artistic’ applications would be conceivable as well.
. Finally, VR and MR applications in particular enable improved collaboration through virtual
conferences and data visualization, etc.
An overview by Deloitte indicates that different types of devices can be used in the various
scenarios (cf. Figure 10).
Prof. Christian Zabel 30 of 92
Prof. Gernot HeisenbergVR, MR and AR in NRW
Figure 10: Suitability of AR/MR/VR Types for Use Cases
Low-end VR Mobile VR Full feature VR Smart glasses NextGen AR/MR
Marketing, promotion
Product presentation,
virtual showrooms &
visualization
Seminars, training &
simulation
Design & product
development
Conferencing &
collaboration
Maintenance & repairs
Logistics & navigation
Production
Source: Deloitte, 2016
Prof. Christian Zabel 31 of 92
Prof. Gernot HeisenbergYou can also read