2021 Performance of New Photovoltaic System Designs - IEA-PVPS
←
→
Page content transcription
If your browser does not render page correctly, please read the page content below
Task 13 Performance, Operation and Reliability of Photovoltaic Systems
PVPS

 Performance of New
 Photovoltaic System
 Designs
 2021

 Report IEA-PVPS T13-15:2021
Task 13 Performance, Operation and Reliability of Photovoltaic Systems – Performance of New Photovoltaic System Designs

What is IEA PVPS TCP?
The International Energy Agency (IEA), founded in 1974, is an autonomous body within the framework of the Organization for Economic
Cooperation and Development (OECD). The Technology Collaboration Programme (TCP) was created with a belief that the future of energy
security and sustainability starts with global collaboration. The programme is made up of 6.000 experts across government, academia, and
industry dedicated to advancing common research and the application of specific energy technologies.

The IEA Photovoltaic Power Systems Programme (IEA PVPS) is one of the TCP’s within the IEA and was established in 1993. The mission
of the programme is to “enhance the international collaborative efforts which facilitate the role of photovoltaic solar energ y as a cornerstone
in the transition to sustainable energy systems.” In order to achieve this, the Programme’s participants have undertaken a variety of joint
research projects in PV power systems applications. The overall programme is headed by an Executive Committee, comprised of o ne
delegate from each country or organisation member, which designates distinct ‘Tasks,’ that may be research projects or activity areas.

The IEA PVPS participating countries are Australia, Austria, Belgium, Canada, Chile, China, Denmark, Finland, France, Germany , Israel,
Italy, Japan, Korea, Malaysia, Mexico, Morocco, the Netherlands, Norway, Portugal, South Africa, Spain, Sweden, Switzerland, Thailand,
Turkey, and the United States of America. The European Commission, Solar Power Europe, the Smart Electric Power Alliance (SEP A), the
Solar Energy Industries Association and the Cop- per Alliance are also members.

Visit us at: www.iea-pvps.org

What is IEA PVPS Task 13?
Within the framework of IEA PVPS, Task 13 aims to provide support to market actors working to improve the operation, the reliability and the
quality of PV components and systems. Operational data from PV systems in different climate zones compiled within the project will help
provide the basis for estimates of the current situation regarding PV reliability and performance.

The general setting of Task 13 provides a common platform to summarize and report on technical aspects affecting the quality, performance,
reliability and lifetime of PV systems in a wide variety of environments and applications. By working together across nationa l boundaries we
can all take advantage of research and experience from each member country and combine and integrate this knowledge into valuable
summaries of best practices and methods for ensuring PV systems perform at their optimum and continue to provide competitive return on
investment.

Task 13 has so far managed to create the right framework for the calculations of various parameters that can give an indication of the quality
of PV components and systems. The framework is now there and can be used by the industry who has expressed appreciation towar ds the
results included in the high-quality reports.

The IEA PVPS countries participating in Task 13 are Australia, Austria, Belgium, Canada, Chile, China, Denmark, Finland, France, Germany,
Israel, Italy, Japan, the Netherlands, Norway, Spain, Sweden, Switzerland, Thailand, and the United States of America.

 DISCLAIMER

 The IEA PVPS TCP is organised under the auspices of the International Energy Agency (IEA) but is functionally and legally autonomous. Views, findings and
 publications of the IEA PVPS TCP do not necessarily represent the views or policies of the IEA Secretariat or its individual member countries.

 COVER PICTURE

 Exemplary graphical overview of subtask 1.3 topics. (Sources: Fraunhofer ISE, ISFH, dhp technology, SPF Institute for Solar Technology, SERIS)

 ISBN 978-3-907281-04-8: Report IEA-PVPS T13-15:2021 Performance of New Photovoltaic System Designs
Task 13 Performance, Operation and Reliability of Photovoltaic Systems – Performance of New Photovoltaic System Designs

 INTERNATIONAL ENERGY AGENCY

 PHOTOVOLTAIC POWER SYSTEMS PROGRAMME

 IEA PVPS Task 13
 Performance, Operation and
 Reliability of Photovoltaic Systems

 Performance of New Photovoltaic System Designs

 Report IEA-PVPS T13-15:2021
 April 2021

 ISBN 978-3-907281-04-8
Task 13 Performance, Operation and Reliability of Photovoltaic Systems – Performance of New Photovoltaic System Designs

AUTHORS

 Main Authors
 Matthias Littwin, Institute for Solar Energy Research Hamelin (ISFH), Emmerthal, Germany

 Franz P. Baumgartner, Zurich University of Applied Science (ZHAW), Zurich, Switzerland

 Mike Green, Green Power Engineering, Ra'anana, Israel

 Wilfried van Sark, Utrecht University (UU), Utrecht, Netherlands

 Contributing Authors
 Cyril A. Allenspach, Zurich University of Applied Science (ZHAW), Zurich, Switzerland

 Evelyn Bamberger, SPF Institute for Solar Technology, Rapperswil, Switzerland

 Christof Biba, SPF Institute for Solar Technology, Rapperswil, Switzerland

 Christopher Deline, National Renewable Energy Laboratory, (NREL), Golden, CO, USA

 Roger French, Solar Durability and Lifetime Extension Research Center (SDLE), Case Western Reserve
 University (CWRU), Cleveland, OH, USA

 Daniel Gfeller, Bern University of Applied Science (BFH), Bern, Switzerland

 Sara M. Golroodbari, Utrecht University (UU), Utrecht, Netherlands

 Marc Köntges, Institute for Solar Energy Research Hamelin (ISFH), Emmerthal, Germany

 Christian Messner, Austrian Institute of Technology GmbH, Center for Energy (AIT), Vienna, Austria

 Urs Muntwyler, Bern University of Applied Science (BFH), Bern, Switzerland

 Rosmarie Neukomm, Bern University of Applied Science (BFH), Bern, Switzerland

 Daniel Riley, SANDIA National Laboratory (SNL), Livermore, CA, USA

 Davide Rivola, Scuola universitaria professionale della Svizzera italiana (SUPSI), Manno, Switzerland

 Joshua S. Stein, SANDIA National Laboratory (SNL), Albuquerque, NM; USA

 Max Trommsdorff, Fraunhofer Institute for Solar Energy Systems (ISE), Freiburg, Germany

 Editor
 Matthias Littwin, Institute for Solar Energy Research Hamelin (ISFH), Emmerthal, Germany

 Ulrike Jahn, TÜV Rheinland, Cologne, Germany

4
Task 13 Performance, Operation and Reliability of Photovoltaic Systems – Performance of New Photovoltaic System Designs

TABLE OF CONTENTS

Acknowledgements ......................................................................................................................................... 6

List of abbreviations......................................................................................................................................... 7

List of symbols................................................................................................................................................. 9

Executive summary ....................................................................................................................................... 12

1 Introduction........................................................................................................................................... 14

2 Standards and definitions ..................................................................................................................... 15

 2.1 Current standards for performance characterization of new system components ..................... 15

3 Performance characterization of new PV system components ............................................................. 16

 3.1 Specific characterization methods for system components ....................................................... 16

4 Performance characterization of complex new systems with PV .......................................................... 39

 4.1 Transient PV battery quotation according to the NESPRESSO TM-test ...................................... 39

 4.2 Using a dynamic system model to characterize a complex PV system ..................................... 40

 4.3 Hardware-in-the-Loop tests on complete systems with heat pumps and PV for the supply of heat
 and electricity ............................................................................................................................ 45

 4.4 Performance of PV storage systems ......................................................................................... 52

 4.5 Performance indices for parallel agricultural and PV usage ...................................................... 62

 4.6 Performance indices for double use installations of foldable PV generators ............................. 64

5 Performance of showcases of complex PV systems with multiple function ........................................... 68

 5.1 Performance of showcases of net integrated PV system with battery storage .......................... 68

 5.2 Performance of floating PV systems ......................................................................................... 72

 5.3 Performance of agrivoltaics systems: a showcase from Germany ............................................ 76

6 Conclusion............................................................................................................................................ 79

References .................................................................................................................................................... 81

 5
Task 13 Performance, Operation and Reliability of Photovoltaic Systems – Performance of New Photovoltaic System Designs

ACKNOWLEDGEMENTS

This paper received valuable contributions from several IEA-PVPS Task 13 members and other international experts.
Many thanks to:

Thomas Schott, Bern University of Applied Science (BFH), Bern, Switzerland

This report is supported by the State of Lower Saxony,

Swiss Federal Office of Energy (SFOE) under contract number 8100073, project number SI/501788 supporting the IEA
PVPS Task 13 actions,

Swiss competence centre for Energy research (future grids SCCER-FURIES),

United States Department of Energy Office (DOE),

Office of Energy Efficiency and Renewable Energy,

IEA-ISGAN SIRFN is being carried out as part of the IEA research cooperation on behalf of Austrian Federal Mini stry for
Climate Action, Environment, Energy, Mobility, Innovation and Technology (BMK),

The Netherlands Enterprise Agency (RVO), Green Power Engineering Ltd., Netherlands Ministry of Economic Affairs and
Climate (EZK) and

German Federal Ministry of Economic Affairs and Energy (BMWi) under grant number 0324304A, 0324304B, 0324304C
project “Joint project: Task13-3 - Management and participation in Task 13 'Performance, Operation and Reliability of
Photovoltaic Systems' Phase 2018 - 2021 within the Photovoltaic Power Systems (PVPS) Programme of the International
Energy Agency (IEA).

6
Task 13 Performance, Operation and Reliability of Photovoltaic Systems – Performance of New Photovoltaic System Designs

LIST OF ABBREVIATIONS

 Abbreviation Description
 AC Alternating current
 agri Agrivoltaics
 APV Agrivoltaics, or agrophotovoltaics
 ARENA Australian Renewable Energy Agency
 ASTM International, formerly known as American Society for Testing and
 ASTM
 Materials, is an international standards organization
 BAT2AC Discharge power path from the battery to AC
 BOS Balance of system, non-PV-module components in a PV system
 BSW German Solar Industry Association
 BVES German Energy Storage Association
 c-Si Crystalline silicon
 CCT Concise cycle test
 CEC California Energy Commission
 DC Direct current
 DHW Drink hot water
 German Commission for Electrical, Electronic & Information
 DKE
 Technologies
 DUT Device under test
 elec Electrical
 EMS Energy management system
 EN European Norm
 Research for Sustainable Development, funding framework of the
 FONA
 German Federal Ministry of Education and Research
 FPV Floating photovoltaic
 FTCC Floating, tracking, cooling, concentrating
 GCP Grid connection point
 GM Ground-mounted
 HHL Household load
 IEA International Energy Agency
 IEC International Electrotechnical Commission
 IR Infrared
 KPI Key performance indicator
 LED Light emitting diode
 LTM4611 DC/DC micro module regulator
 LV Low voltage

 7
Task 13 Performance, Operation and Reliability of Photovoltaic Systems – Performance of New Photovoltaic System Designs

 max Maximum
 MI Microinverter
 MIE Module integrated electronic
 MLPE Module level power electronic
 MOSFET Metal-oxide-semiconductor field-effect transistor
 MPP Maximum power point
 MPPT Maximum power point tracker
 MWT Metal wrap through technology for crystalline silicon solar cells
 nom Nominal
 OC Open circuit
 PAR Photosynthetic active radiation
 PAT Performance acceptance test
 POA Plane of array
 PV Photovoltaic
 PV2AC Power path PV power for direct load coverage and grid feed-in
 Power path PV power for battery charging (AC system PV2BAT consists
 PV2BAT
 of PV2AC and AC2BAT)
 PVC Polyvinyl chloride
 Software package for the study, sizing and data analysis of complete PV
 PVsyst
 systems
 Ref Reference
 SAS Solar array simulator
 SC Short cut
 SI String inverter
 SOC State of charge of a battery
 STC Standard test conditions
 UV Ultraviolet
 Software tool developed by Fraunhofer ISE, to simulate the overall
 ZENIT electrical yield of a photovoltaic system implementing chain of loss
 models

8
Task 13 Performance, Operation and Reliability of Photovoltaic Systems – Performance of New Photovoltaic System Designs

LIST OF SYMBOLS

 Symbol Description Unit
 AMa Airmass -
 C State of charge of a battery kWh
 Unitless empirical coefficient describing the linear relationship -
 C0 between the irradiance and the PV AC module output power,
 typical values near 1
 Unitless empirical coefficient describing the logarithmic -
 C1 relationship between the irradiance on the PV AC module
 output power
 Energy the battery storage system supplied during the coffee kWh
 EBat
 making process
 Econsumption Total energy consumption kWh
 Egrid-feed-in Electric energy supplied to the grid kWh
 Egrid-purchase Electric energy from the grid kWh
 Rnet Grid purchase ratio %
 EHH Household electricity (without heat pump). kWh
 ENAC Measured AC electrical generation of the PV system kW
 ENespresso Energy totally used for coffee making by the coffee machine kWh
 Broadband POA irradiance incident upon the module which W/m²
 reaches the active PV material. EPOA is estimated from
 EPOA measured broadband POA irradiance by accounting for the
 module losses due to specular reflection and/or acceptance of
 diffuse irradiation.
 EPV-yield Produced PV electricity, measurement on the DC and AC kWh
 lines; the AC current measurement is used for the energy
 balance.
 Eref Reference POA irradiance W/m²
 Esupplied Amount of energy fed into the system kWh
 Amount of energy from PV used to cover the load and fed into kWh
 Eused
 the grid
 Total useful energy demand for household electricity, domestic kWh
 Euse
 hot water and space heating
 Empirical unitless function which modifies the PV AC module -
 f1 output power as a function of absolute (pressure corrected)
 airmass relative to the reference absolute airmass
 GPOA Measured plane of array irradiance W/m²
 2
 GSTC Irradiance at standard test conditions (1 000 W/m ) W/m²
 i a given point in time -
 I Current A

 9
Task 13 Performance, Operation and Reliability of Photovoltaic Systems – Performance of New Photovoltaic System Designs

 LER Land equivalent ratio -
 LL Land losses -
 M Voltage boost ratio -
 N Total number of DC/DC optimizers in a system -
 ng Number of solar cells in a cell group NG -
 NG Number of cell groups in a PV module -
 P Power W
 P1 PV AC module power in typical operation state W
 P2 PV AC module power in self-limiting state W
 P3 PV AC module power in low-irradiance state W
 PAC,max Maximum AC output power of a PV AC module W
 Charge condition-dependent maximum charge power for AC- W
 PBat,AC
 coupled battery systems
 PBat,AC’ AC-side excess PV power W
 Charge condition-dependent Maximum charge power from PV W
 PBat,PV
 for DC-coupled battery systems
 PBat,PV’ DC-side excess PV power W
 PBAT2AC Discharge power from the battery to cover the Load W
 PGrid Exchange power with the grid W
 PLoad Electrical load at grid connection point W
 PLOAD,DC Required DC PV power to cover the load W
 Pmax Maximum power W
 PNT Consumed active AC power by an PV AC module W
 Pout,mean,N Mean output power of all N DC/DC optimizers in a system W
 Pout,Opt Output power of the DC/DC optimizer Opt W
 PPV,AC’ Possible invertible PV output W
 PPV,DC Output of the PV generator W
 PPV2Bat PV power for battery charging W
 PPV2Bat,AC Excess PV power consumed by the AC-coupled battery W
 PPV2Bat,DC Excess PV power consumed by the DC-coupled battery W
 PPV2LOAD Direct load coverage W
 PR Performance ratio %
 PSPV Battery losses W
 Summation of installed modules’ power rating from flash test W
 PSTC
 data
 Power consumption of the PV inverter, battery converter and W
 PVB
 power meter at the Grid Connection Point
 QDHW Domestic hot water energy demand kWh
 QSH Space heating energy demand kWh

10
Task 13 Performance, Operation and Reliability of Photovoltaic Systems – Performance of New Photovoltaic System Designs

 Rgen Ratio of PV yield to total electrical energy consumption %
 Rself-con Self-consumption ratio %
 Rsuff Level of independence from the external power grid %
 SMF Shade mitigation factor %
 TC Cell temperature of the PV AC module °C
 T0 Reference cell temperature of the PV AC module, usually 25°C °C
 U Voltage V
 AC Response of the PV AC module’s power output to change in 1/°C
 cell temperature
 εself-consumption Share of self-consumption %
 εself-sufficiency Degree of self-sufficiency %
 η Conversion efficiency %
 ηavg,wgt Average weighted efficiency %
 ηAC2BAT Conversion efficiency from AC to battery %
 ηBAT2AC Conversion efficiency from battery to AC %
 ηDC/AC Conversion efficiency from DC to AC %
 ηDC/DC EURO & %
 EURO and CEC conversion efficiency from DC to DC
 CEC

 ηDC/DC,max avg Maximum averaged conversion efficiency from DC to DC %
 ηDC/DC,power wgt Power weighted conversion efficiency from DC to DC %
 ηOpt Efficiency of the DC/DC optimizer Opt %
 ηPV2AC Inverter efficiency from PV to AC %
 ηPV2BAT Conversion efficiency from PV to battery %
 ηSys System efficiency %
 ηTotal max avg Maximum averaged conversion efficiency of a total system %
 ηTotal power wgt Power weighted conversion efficiency of a total system %
 ηTotal EURO & CEC EURO and CEC conversion efficiency of a total system %

 11
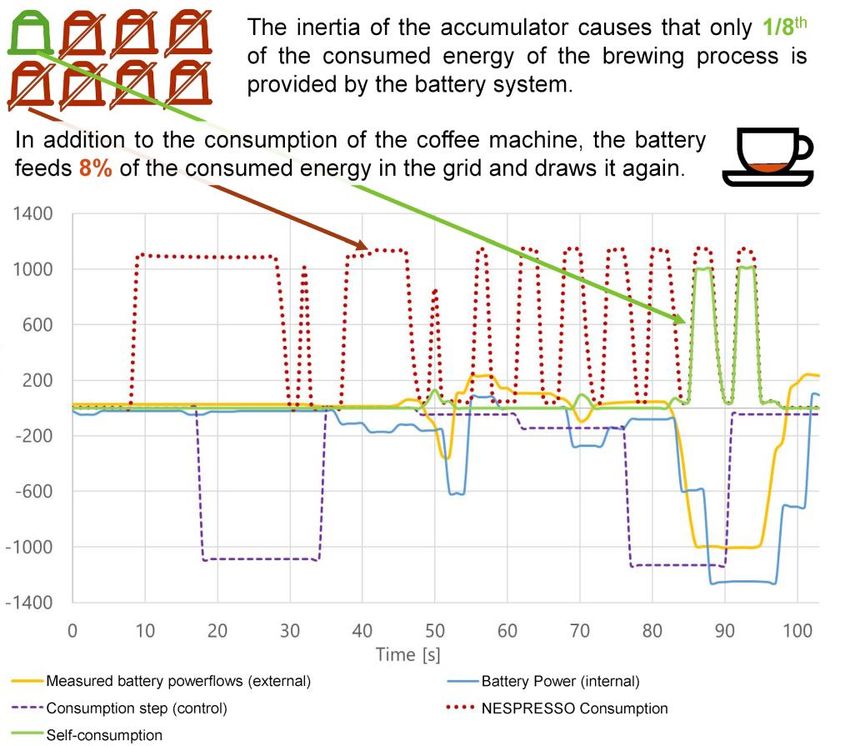
Task 13 Performance, Operation and Reliability of Photovoltaic Systems – Performance of New Photovoltaic System Designs

EXECUTIVE SUMMARY

The goal of this document is to provide a compendium of new performance characterization methods for new photovoltaic
(PV) system designs as a reference. New methods are described and explained by laboratory tests up to case studies.
While performance characterization is more than evaluating efficiency of a component or a system in certain operating
points, the results account for multi-dimensional usage and benefits. These assessments are intended to provide well-
founded and comparable key figures in order to enable new PV system designs to move faster into new fields of
application.

This report gives a short introduction into current standards and definitions regarding performance characterization of PV
systems as a starting point. New PV system components and complex new systems with PV are then described with their
respective performance characterization methods. Where currently no performance characterization methods for complex
PV systems particularly with multiple functions exist, their design and their performance, energetically and regarding multi-
dimensional usage benefits, are presented and described by means of showcases.

PV systems are not only PV modules and PV inverters in an optimally oriented system which produce as much electrical
energy as possible. Current PV systems may provide a dual or even a triple use. However, as varied as the use of each
system and each PV installation is, as different is the approach of performance evaluation.

The market of PV system components for special applications e.g. partially shaded operating conditions, or foldable or
floating PV is growing. For all kinds of these PV systems, the Performance Ratio (PR) can be calculated. This PR in the
PV sector just relates the energy yield of ideal PV systems to the real energy yield of real PV systems operated at a certain
place. The PR cannot rate non-energy benefits of PV systems, components or installations.

Then again, the key performance indicator KPI for PV installation investment decisions often is the energy yield respecting
PR only because, measurement schemes are unknown or do not exist to evaluate the multiple benefits of the PV system.
In the design phase of a certain PV installation the PV energy yield can only be calculated via simulation if the PV
components’ behaviour under different operating conditions is known. However, manufacturers of Balance of System
(BOS) components often provide less meaningful performance figures in their datasheets which are not appropriate input
data for a PV component or PV system simulation.

Starting from this point, this report provides measurement protocols to characterize single new PV system components
with the goal of providing simulation models, figures for the model parameterization and the go al of obtaining meaningful
performance indicators besides the PR. For multi-Maximum-Power-Point-Tracker (MPPT) inverters, a measurement
protocol is proposed based on existing standards for the efficiency assessment of string inverters. In the new measureme nt
protocol adjustments for the existing protocol are introduced and validated. In the case of PV Module Level Power
Electronics (MLPE), their performance under different representative shaded operating conditions of their respective PV
module is more meaningful than their weighted EURO or California Energy Commission (CEC) efficiency. For the PV
module micro inverter, DC/DC optimizer, or in general, MLPE equipped PV system installations and particularly shade
resilient PV module designs measurement protocols and figures as a performance indicator to rate their specific beneficial
operation are presented. They enable the comparison of new PV system components and designs with their advanced
functions and benefits.

The PV battery system characterization is discussed in four steps. At first, with a simple test showing the inertia of a PV
battery storage system the need of more meaningful performance indicators besides the nominal storage capacity and
maximum efficiency is demonstrated. In the second step, the efficiency guideline for PV storage systems is discussed.
Here, a measurement protocol is introduced which enables to systematically assess performance relevant figures from
PV battery storage systems. In a third step, a dynamic PV battery storage simulation model is introduced which can be
parameterized by the performance relevant figures assessed, according to the previously introduced efficiency guideline.
All of these figures enable to parameterize PV battery system simulation models in a more sufficient way than the often-
found figures of the maximum efficiency or the maximum capacity in datasheets. In the fourth step, simulations with that

12
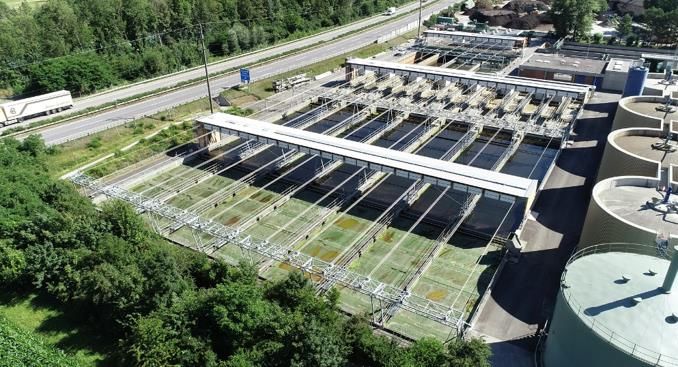
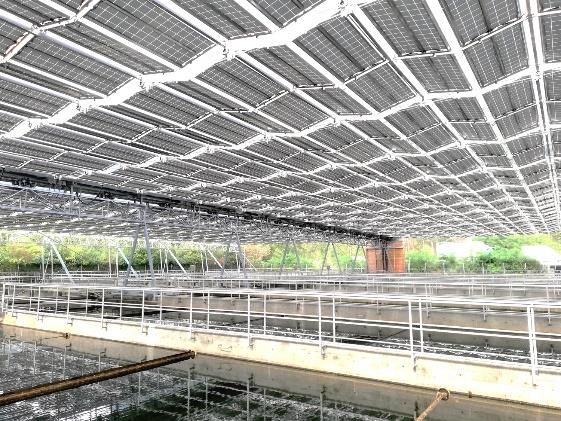
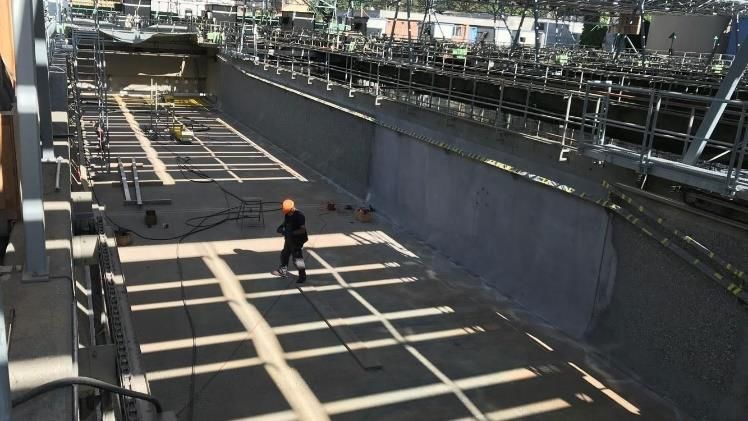
Task 13 Performance, Operation and Reliability of Photovoltaic Systems – Performance of New Photovoltaic System Designs

way parameterized dynamic PV battery storage model enables for individual PV system performance assessment by
means performance indicators established in the sector of PV battery storage system.

Furthermore, the concise cycle test (CCT) a measurement protocol for the performance assessment of whole energy
supply systems for single family or semi-detached houses in a Hardware-in-the-Loop testbench is introduced. This CCT
allows for a performance assessment in a reasonably short time of six days without any previous examinations of the
devices to be tested. Finally, we introduce the new key performance indicator grid purchase ratio. It allows a system
assessment even if inefficient electric applications are used in the system under test.

Performance indicators for complex new systems with PV have to consider their multiple -usage benefits, e. g. additional
yield or benefit, economically or regarding social acceptance. The performance indicators are as manifold as the multiple -
usage of a certain PV system installation may be. As an example, in the area of parallel agricultural and PV usage (APV)
the Land Equivalent Ratio (LER) shall be mentioned here. It indicates how efficient the parallel double-usage of a field is
compared to two parallel single usage fields with the same total area.

For foldable PV systems, the multiple-usage performance can be rated, for example by the amount of steel and respective
CO2 emissions saved by its light weight structure, as operation during heavy wind or snow load conditions is avoided. A
showcase with a foldable PV installation over wastewater treatment basins with respective performance indic ators is given
in the report. The variety of multiple-usage of foldable PV makes it difficult to determine a certain set of performance
indicators which can be generally applied.

For floating PV (FPV) systems also, the multiple-usage benefits depend on their environmental operating conditions (e. g.
reduced algal growth). A KPI is the PV module operating temperature which, besides the irradiation, is influenced by the
wind speed. However, the pure presence of a waterbody beneath the PV modules does not imply lower PV module
operating temperatures compared to land-based PV systems in the same area. Currently, there is no commonly applicable
use case for rating an FPV performance characterization. Further research has to be carried out to find valid use cases
and performance indicators for FPV.

For all performance characterization methods and performance indicators introduced in this report no standards exist
currently. Although, some are closer to an existing standard multi-MPPT inverter) or on the way to a standardization
process (PV storage systems). In the case of floating PV and foldable PV research and development are just at the
beginning of the way to standardized performance characterization.

The work on this report has shown, that the development of a uniform performance indicator for all kinds of new PV
components or new complex systems with PV will hardly be possible. Nevertheless, a framework should be developed
which allows to normalize different performance indicators to make them comparable.

 13
Task 13 Performance, Operation and Reliability of Photovoltaic Systems – Performance of New Photovoltaic System Designs

1 INTRODUCTION

New photovoltaic (PV) system designs are being developed to increase the value of the energy produced by either lowering
the installation costs, increasing the efficiency or adding functions to the system. Some of these innovations include
advanced power electronics to optimize the performance ratio of PV systems. Some new PV systems have additional
functions, such as coupling PV energy with storage and power grid, including storage for electromobility, agricultural PV,
and floating PV systems. For most of the mentioned new system components and double function systems, no standards
exist on how to characterize and normalize the performance of the system or parts in the PV system. The International
Energy Agency Photovoltaic Power Systems Technology Collaboration Programme’s Task 13 (IEA PVPS Task 13 Subtask
1.3 group with over 15 PV experts from six countries) addresses these performance aspects. Performance is a measure
of how well something meets expectations compared to a reference. We present new characterization methods for “New
PV System Designs” to determine performance factors and indicators for the performance and the usability of new systems
or new system parts. Where no methods are available on the performance, pros and con s will be explained by case
studies. In these case studies, performance experiences with innovative PV systems are collected and summarized. The
characterization methods and case studies cover not only technical but also economic aspects.

The energetic performance of a system is always defined as a ratio of energy input and output of a component or a system.
In general, it is not possible to give one figure for the performance. Typically, the performance is a function of external a nd
internal conditions and time. In some cases, the definition of a performance factor is possible, if the component or system
is depending on well-known internal or external factors but without time dependence. In this case, a typical distribution of
the conditions is used to calculate a performance factor. However, the more the performance is depending on not well
known external or internal conditions or even on foregoing external or internal conditions, it becomes more and more
complex to define a useful performance of the system. Additional complexity is gained if the performance cannot only be
expressed by energetic units because other values should be considered in parallel. In these cases, multiple key
performance factors become necessary if the performance of a system has partially opposing optimization targets or
multiple typical applications exist.

Table 1: Definitions and applicability assessment of performance definitions.

 Name Description Allows for
 Calculation for Comparison of
 one use case one use case
 Performance Relation between output to input for X X
 factor one special use case.
 Performance Relation between output to input for X
 indicator one use case with an unknown
 additional factor or monotonically
 increasing (decreasing) function.

The aim of a key performance factor is to characterize and compare a component or system for a typical use case and
one important optimization goal. Therefore, (key) performance factors are only useful if they robustly describe the energetic
(usability, cost) performance of a system. To do this, they must meet a number of conditions. Firstly, the performance must
be assessed in situations that describe the typical technical application as close as possible. Secondly, the factors must
be as robust as possible against deviations in the application. The key performance factor must represent the input to
output ratio of a given application. This avoids complex simulations of the systems for energetic or even usability
comparisons. If this is not possible we try to give key performance indicators (KPI) which at least allow statements such
as the higher/lower the performance indicator is the more useful (better), see Table 1.

14
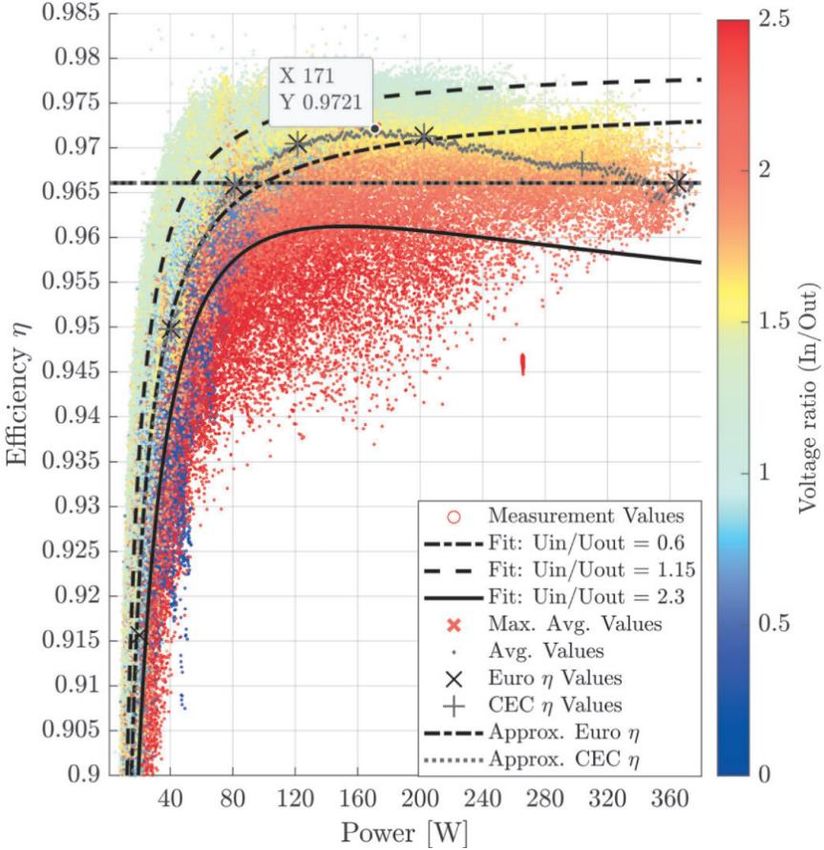
Task 13 Performance, Operation and Reliability of Photovoltaic Systems – Performance of New Photovoltaic System Designs

2 STANDARDS AND DEFINITIONS

2.1 Current standards for performance characterization of new
 system components
2.1.1 Component level
For planning decisions of PV systems, the definition of a meaningful efficiency is important to characterize the components.
The standards EN 50530 [1] and IEC 61683 [2] are examples for efficiency definitions of PV inverters. The EN 50530
specifies a measurement procedure to determine the weighted EURO efficiency of grid-connected PV (micro)inverters as
well as the IEC 61683 specifies the California Energy Commission (CEC) efficiency. If new components like multi -
maximum power point tracker (MPPT) string inverter or PV AC-modules are to be investigated new and extended methods
must be applied as introduced in chapter Erreur ! Source du renvoi introuvable..

2.1.2 Performance definition for PV systems with additional function
In the following we present the most important performance definitions used in this report. On system level several ratios
can be considered to rate a PV system´s performance. As an example, the performance ratio PR of a standard PV system
is given by

 (1)

with

 • ENAC = measured AC electrical generation (kW)

 • PSTC = summation of installed modules’ power rating from flash test data (kW)

 • GPOA = measured irradiance in the plane of array (POA) (W/m 2)

 • i = index of a set of measurement results at the same time

 • GSTC = irradiance at standard test conditions (STC) (1000 W/m 2) [3].

For net coupled PV systems with or without battery the degree of self-consumption is given by

 (2)

and the degree of self-sufficiency (autarky) is given by

 (3)
 .

The system efficiency ηSys describes the PV energy used Eused to cover the load and fed into the grid in relation to the
amount of energy fed into the local (e.g. household) system Esupplied

 (4)
 .

 15
Task 13 Performance, Operation and Reliability of Photovoltaic Systems – Performance of New Photovoltaic System Designs

3 PERFORMANCE CHARACTERIZATION OF NEW PV
 SYSTEM COMPONENTS

3.1 Specific characterization methods for system components
3.1.1 New performance characterization methods for multi-MPP PV inverters
The current standard for characterization of the overall efficiency of PV inverters [1] was first released in 2010. At that
time, multi-MPPT (maximum power point tracker) PV inverters were not widely-used. Therefore, the standard did not focus
on the specific characteristics of PV inverters with more than one MPP (maximum power point) tracker. Today however,
multi-MPPT PV inverters have become a market standard. To obtain a complete characterization of these devices, new
test methods are necessary. Therefore, new test profiles for multi-MPPT PV inverters are proposed [4].

A good multi-MPPT PV inverter should be able to track the MPP on each input even if these MPPs have completely
different voltage or current values. To characterize this feature, the proposed test profiles emulate heterogeneous input
conditions on the inverter's MPP trackers. They are based on the linear ramp profiles for the characterization of the
dynamic MPPT efficiency according to EN 50530 [1]. However, the ramps on the different inputs are not synchronous.
With this approach, it is possible to simulate the whole range from completely homogeneous to very inhomogeneous input
conditions in a reasonably short amount of time. The ramps simulate a change in irradiance between 100 W/m2 and
800 W/m2 in 150 seconds, which results in a gradient of 4⅔ W/(m2∙s).

The simulated P-U characteristics are also modelled according to EN 50530 [1]. They are scaled so that the MPP at
Standard Test Conditions (STC) would be at the rated voltage and power of the corresponding MPP tracker (which do not
necessarily have to be the same on each of the inverter's inputs). The cell temperature is assumed to be constantly at
25°C. At first, there is a lead time of 300 seconds with 800 W/m2 of simulated irradiance, which allows the inverter under
test to turn on and stabilize on the MPP. Then, the simulated irradiance at the first MPP tracker falls to 100 W/m2 in 150
seconds. It remains at this level for 150 seconds and then rises back to 800 W/m2 in another 150 seconds. The simulated
irradiance on the second MPPT follows the same course, but with a delay of 300 seconds. This means that the simulated
irradiance on the second MPPT starts to fall at the same time as the simulated irradiance on the first MPPT starts to rise
again. Consequently, the profile on each following MPPT (if present) will follow his previous MPPT's profile with a delay of
300 seconds. This test sequence is done twice. Figure 1 shows the proposed test profile for four MPPTs.

If the inverter under test has more than four MPP trackers, to keep the test short, the profile of the first MPP tracker will
also be applied to the fifth MPP tracker, the profile of the second MPP tracker will also be applied to the sixth MPP tracker
and so forth. The test can therefore be extended to an arbitrary number of MPP trackers. As the size of the simulated PV
array is defined in relation to the nominal power of the corresponding MPP tracker, the test procedure is even flexible
enough for inverters with MPP trackers of different sizes.

Even though the proposed test is simple and short, it allows a good characterization of the inverter under test in situations,
when one MPP tracker runs with a power much lower than the others.

16
Task 13 Performance, Operation and Reliability of Photovoltaic Systems – Performance of New Photovoltaic System Designs

Figure 1: Test profile for PV inverters with four MPP trackers [4].

In fact, it could already be shown that under inhomogeneous conditions, the conversion efficiency of a multi -MPPT PV
inverter is considerably smaller compared to a situation, when all inputs operate at the same voltage. This loss of efficiency
occurs because under homogeneous input conditions, the device under test bypasses its input stages and performs the
MPP tracking by modulation of the common DC link voltage. However, if the MPP voltage of the attached strings is no
longer identical, the inverter activates its input stages which allows an individual MPP tracking on each input. Due to the
additional power stages, the conversion losses are increased, and the conversion efficiency is reduced. Figure 2 shows
an actual measurement of this situation, performed on an inverter with three MPP trackers.

During the first 300 seconds of the measurement, the simulated irradiance has been equal on all three MPP trackers. It is
clearly visible that in this phase, the measured voltages on each MPP tracker are perfectly congruent. After this, the
simulated irradiance of the first MPP tracker started its linear ramp. Shortly thereafter, the first MPP tracker tries to
compensate for the now reduced MPP voltage. From this moment on, the three input voltages are no longer congruent,
and the efficiency drops by about 0.4%. At t = 350 s, the inverter under test tried one last time to bypass the input stages
and the efficiency went up again for about 15 s. After that, the simulated MPP voltage on the first MPP tracker has drifted
far enough that a common MPP tracking is no longer possible, and the inverter tracks the three inputs individually.

A loss of efficiency of 0.4% might not sound too bad. However, considering that the manufacturers of PV inverters fight
for every tenth percent of efficiency, this is already a serious loss – a loss which cannot be detected by the current test
standards. It also means that the devices conversion losses go up by 25% (2% instead of 1.6%). Consequently, the power
dissipation is also increased by 25%, which leads to a considerable heating of the components. In this case, the heatsink
of this passively cooled PV inverter under full load became too hot to be touched by bare hand even if the ambient was at
room temperature! A higher temperature will always have a negative impact on the device's lifetime. Therefore , it is
imperative that such effects must be unveiled by tests which aim to obtain a good characterization of such devices.

 17
Task 13 Performance, Operation and Reliability of Photovoltaic Systems – Performance of New Photovoltaic System Designs

Figure 2: Efficiency loss under inhomogeneous conditions [4].

The proposed test profiles adjust existing test methods [1] to make PV inverter efficiency a reliable performance indicator
also for multi-MPPT PV inverter.

3.1.2 Characterization methods for DC/DC smart modules
The measurement of PV modules under standard test conditions is governed by IEC 60904 -1 [5], allowing for indoor flash
testing and outdoor / continuous illumination characterization. The embedding of module -level or sub-module DC/DC
optimizers into the junction box of modules was initially proposed to improve performance under partial shading conditions
[6]. However, market adoption followed more swiftly as a response to updated building electrical codes designed to
improve safety of emergency personnel responding to rooftop fires [7]. In many situations where the module-level DC
power optimizer is an integral part of the module either embedded in the PV laminate or in parallel with b ypass diodes in
the junction box, characterization of the module without the effects of the DC/DC converter is impossible.

Figure 3: Buck converter DC response [8].

The response of a smart module depends in part on the power converter topology (e.g. buck, buck/boost), which describes
the range in which the conversion is active. For a ‘buck’ converter, a constant-power regime is entered for module voltage

18
Task 13 Performance, Operation and Reliability of Photovoltaic Systems – Performance of New Photovoltaic System Designs

< UMPP, until a maximum current limit is reached, shown in Figure 3. Other practical limits such as current, voltage and
power maxima affect the DC/DC response range. A ‘buck-boost’ converter will respond similarly, except with a second
constant-power range for operating voltage > UMPP to the maximum voltage limit of the device [9].

Figure 4: The IU curve of the Maxim VT8012 smart module in ‘flash mode’ [10].

This type of characteristic makes it difficult to extract useful module parameters, e.g. for factory characterization and
binning of modules. Therefore, some DC/DC devices include a ‘flash mode’ allowing indoor flash measurements, assumi ng
the sweep direction occurs from UOC to ISC. Although the characteristic looks closer to a normal I-U-sweep, as discussed
by [8] high frequency noise is typically present which requires filtering and linear fits to extract ISC, UOC and PMPP values,
see Figure 4.

Figure 5: High-frequency response between 625 kHz – 4 MHz of the smart module under outdoor illumination [10].

In this case, application of ASTM E1036 [11] was successful, which calls for linear fits for U < 0.2 UOC and I < 0.2 ISC, along
with a 4th order fit to the P-U curve between 0.75 UMPP < U < 1.15 UMPP. This was successful in filtering out the effects of
the 625 kHz frequency of the buck converter Figure 5. Other characterization requirements for smart modules include
efficiency assessment of the DC/DC optimizer itself. This can be conducted largely according to the methods outlined for
inverters in EN 50530 / IEC 62891 [1], [12].

However, for DC/DC converters an important free parameter that impacts conversion efficiency is voltage boost ratio M.
Typically stated maximum efficiency values are for conditions M = 1, however operation in practice depends on module

 19
Task 13 Performance, Operation and Reliability of Photovoltaic Systems – Performance of New Photovoltaic System Designs

string length and fixed DC link voltage of the inverter depicted in Figure 6 [13]. This factor is overlooked in the conversion
efficiency standards mentioned above, and merits consideration.

A final consideration concerns measuring the energy gain of DC/DC optimizer under partial-shade conditions. No standard
exists to describe and quantify the impact of DC/DC optimizers under shade conditions. Therefore, a protocol has been
developed to compare field results under controlled shading conditions both with and without DC/DC optim izer [14], [15].
In this procedure, a 62% opaque mesh screen is drawn across two side-by-side systems in 1.5-cell increments, measuring
the relative performance for both a string-inverter and MLPE-equipped system (Figure 7 (a)).

Figure 6: Conversion efficiencies of SolarEdge module power optimizers. Courtesy of SolarEdge, data from [16].

During this procedure the relative performance for both an only string-inverter (Reference) and an additionally DC/DC
optimizer-equipped system (Maxim) is measured. Each system has two portrait-oriented PV module strings which are
connected in parallel to a single MPP tracker. The Maxim PV modules integrate six DC/DC optimizers, one per PV module
substring. Both in parallel connected module strings of each system are shaded after each other. Figure 7 (b) shows the
resulting performance of this shading process and compares the difference in shading loss between the two systems at
each shading condition. The red line shows the shade dependent performance of the reference system, the blue line
represents the Maxim system.

To rate the benefit of the DC/DC optimizer equipped string the shade mitigation factor (SMF)

 (5)

was introduced. Eunshaded represents the energy yield of a PV module in unshaded operation. ERef represents the energy
yield of a shaded standard module and EDUT represents the energy yield of PV module with DC/DC optimizers.

 (a) (b)

20
Task 13 Performance, Operation and Reliability of Photovoltaic Systems – Performance of New Photovoltaic System Designs

Figure 7: (a) Two side-by-side systems, one connected to a conventional string inverter and one with DC/DC
optimizer installed. Shading with 62% opaque fabric. In the foreground one of two PV module strings equipped
with DC/DC optimizers and shaded is shown. (b) Difference in performance loss for the two system configurations
with and without substring wise DC/DC optimizer under two portrait-oriented PV module strings subsequent
shaded in 1.5 cell increments [14].

A final composite shade mitigation score is calculated via the frequencies of each shade configuration. Typical Shade
Mitigation Factors of 30% - 40% are calculated, indicating that for typical residential shading, roughly ⅓ of the shading
loss can be recovered by the investigated DC/DC smart modules [17], [14].

A measurement protocol for characterizing the performance of DC/DC optimizers under shading conditions has been
developed. Also, the Shade Mitigation Factor (SMF) was introduced to quantify the impact DC/DC operation under shading
conditions. Input data measurement data from specific use cases or simulation data from specific use cases. There are
no standardization processes regarding this topic, yet.

3.1.3 New performance characterization methods for AC modules
The use of microinverters provides flexibility of installation and safety due to lower system voltages to PV installers and
owners, particularly in small residential systems. When used as distinct components in a system, the PV module and
microinverter may be characterized individually with methods such as IEC 61853 [18] and EN 50530 [1].

An AC Module fully integrates the PV module with a microinverter such that there are no external DC connections. This
integration of PV module directly with microinverter eliminates or hinders the ability to characterize each component
separately. Instead, the fully-integrated AC Module must be characterized as a whole. In 2015, Sandia National
Laboratories developed a method for testing, characterizing, and modelling AC Modules [19].

At any given time, the AC module operates in one of three distinct states; the low-irradiance state, the self-limiting state,
or the typical operation state.

The AC module operates in a low-irradiance state whenever there is insufficient irradiance to power the inversion
electronics and the module may consume a small amount of active power from the electrical grid. The power in this state,
P3, is determined as

 (6)

Here, PNT is the consumed active AC power in watts, and the power P3 is always negative to indicate that the AC module
consumes power in this low irradiance state. PNT may be obtained by specification sheets or determined empirically by
measuring power consumption when the module is not illuminated.

 21
Task 13 Performance, Operation and Reliability of Photovoltaic Systems – Performance of New Photovoltaic System Designs

The microinverters within PV modules generally have some output power level at which they begin to limit their output;
this state is commonly known as “clipping”. In this self-limiting state, the output AC power remains constant despite
changes in irradiance which allow the PV panel to produce more DC power. The power produced in this state is determined
as

 (7)

The value of PAC,max may be reported on a specification sheet or, preferably, determined empirically.

While the self-limiting power of the AC module is presented as a constant, if the modeler determines that the self -limiting
power of the AC module is a function of other input variables, the self-limiting power equation may be replaced with a more
accurate model.

While operating in the typical operation state the active power of the AC module changes as a function of irradiance, PV
cell temperature, and solar spectrum. While operating in this state, the active AC power is represented as the product of
a reference power and a series of normalized scaling factors.

 (8)

where:

 • PACref is the AC power under reference conditions Eref, AMaref, and T0, in watts

 • f1 is an empirical unitless function which modifies the PV AC module output power as a function of absolute
 (pressure corrected) airmass relative to the reference absolute airmass

 • C0 is a unitless empirical coefficient describing the linear relationship between the irradiance and the PV AC
 module output power, typical values near 1

 • C1 is a unitless empirical coefficient describing the logarithmic relationship between the irradiance on the PV
 AC module output power

 • EPOA is the broadband POA irradiance incident upon the module which reaches the active PV material, in
 W/m2. EPOA is estimated from measured broadband GPOA irradiance by accounting for the module losses due to
 specular reflection and/or acceptance of diffuse irradiation.

 • Eref is the reference POA irradiance in W/m 2

 • AC is the PV AC module’s power output dependency to change in cell temperature in units of 1/°C

 • TC is the cell temperature of the PV AC module in °C

 • T0 is the reference cell temperature of the PV AC module, usually 25°C

Thus, in the typical operation state, the power is modelled as a function of incident transmitted irradiance, cell temperatur e,
and absolute airmass. Each of these factors is based on an underlying sub-model which are described in more detail in
[19]. The use of normalized scaling factors to adjust a reference power allows for further development of the model to
include other inputs that are not considered in this work or to utilize different sub-models to obtain more accurate scaling
factors.

With the performance of the AC module defined in three distinct operating states, the model then simply determines the
state in which the module is operating and uses the power model for that state.

 (9)

22
Task 13 Performance, Operation and Reliability of Photovoltaic Systems – Performance of New Photovoltaic System Designs

To determine the reference conditions, reference performance, and sub-model performance parameters, Sandia
measured the module’s active power production in outdoor conditions over a period of several weeks with the AC module
mounted on a 2-axis solar tracker. A series of tests, designed to isolate the performance parameters of each specific sub-
model, are performed on each AC module. While testing is explained in [19], we present a summary of the tests here.

 • Thermal test to determine module temperature coefficients. The module power is measured as it is cooled to
 ambient temperature and then allowed to heat via solar irradiance while remaining normal to the sun.

 • Self-consumption test to determine the amount of active power consumed by the module in low irradiance
 conditions. The module power is measured during low irradiance conditions.

 • Angle-of-incidence test to determine the effect of solar incident angle on module power production. The
 module power and solar incident angle are measured while the module is rotated away from the sun.

 • Electrical performance test to determine the effect of changing solar irradiance, solar spectrum, wind speed,
 and ambient air temperature. The module is tracked normal to the sun for several days to weeks as its power
 is measured. A range of different weather conditions are desired.

This testing allowed for the AC module to be measured under a wide range of incident irradiance, spectra, and temperature
to derive model parameters that predict AC module active power to within ±2% which Figure 8 and Figure 9 confirm.

Figure 10 shows the measured and modelled power from an AC PV module on a cold, breezy, partly clouded day. Prior
to sunrise, the module operates in the low-power state, where the AC module consumes approximately 0.6 watts of active
power. As the sun rises and illuminates the AC module, it begins producing active AC power according to the incident
irradiance and module temperature. In the middle of the day, the AC module is limiting its output power, producing a
constant amount of power, regardless of increasing incident irradiance.

Figure 8: PV AC module model residuals on data used within the parameter estimation data set [19].

 23
Task 13 Performance, Operation and Reliability of Photovoltaic Systems – Performance of New Photovoltaic System Designs

Figure 9: Histogram of model power residuals over 9 days for a fixed-tilt PV AC module, daytime data only [19].

While Sandia National Laboratories conducted performance testing outdoors, indoor performance testing of AC modules
may be possible. However, due to the lag and self-consumption of power within the attached microinverter, a continuous
light source would be required and some performance characteristics could need to be estimated if they could not be
measured directly via indoor testing.

The testing and analysis produce a performance model for each AC PV module. The models developed by Sandia were
tested and validated over 9 days, during which the AC module was held at a fixed tilt while its power was measured. During
the validation period, the model produced a (daytime) root mean square error (RMSE) less than 1% and predicted the
total power generation within 1.4%.

The described measurement protocol and simulation model for PV AC modules enables to conduct simulations for specif ic
use cases. With the generated results like time series of the PV AC module´s AC power or the energy yield performance
indicators for the specific use case can be calculated.

24
Task 13 Performance, Operation and Reliability of Photovoltaic Systems – Performance of New Photovoltaic System Designs

Figure 10: Measured and modelled power from a fixed-tilt PV AC module on a cold, breezy, partly cloudy day [19].

3.1.4 Module-level Power electronics under indoor performance tests
Due to the electrical wiring of conventional PV systems with string inverters and their centralized maximum power point
tracking (MPPT), partial-shading conditions have a great impact on the reduced performance of those systems. Module-
level power electronics (MLPE) e.g. microinverters or power optimizers (DC/DC-converter) apply individual MPPT for each
PV module. Thus, the annual system performance will increase, if the total MLPE efficiency for the unshaded events is
not significantly lower compared to sting inverter. Claims of two-digit number percentage of performance gain of MLPE
relative to standard string inverters could not be verified by intensive indoor lab test at ZHAW for typical roof shading
conditions.

Figure 11 shows the simulated system with the PV module placement on the roof and a dormer, throwing a shadow on
two PV modules in the late morning for instance. The roof inclination is 30° with a south facing module plane.

Figure 11: Simulated system with the PV module placement on the roof with a dormer [20].

The origin of the corresponding daily course of DC output of ten rooftop PV modules facing typical shading conditions of
a dormer are a measurement run of a real system. Detailed ray tracing shading models calculate the time series of the
DC current and voltage output of one individual PV module, with a spatial resolution of a single solar cell within the standard
PV module of 60 cells and three bypass diodes.

Figure 12 show the I-V curves of one module and the graphical representations of three different shading situations with
a 1%, 47% and 50% shading of one cell (marked in red).

 25
Task 13 Performance, Operation and Reliability of Photovoltaic Systems – Performance of New Photovoltaic System Designs

 (a) (b) (c)

Figure 12: I-V curve of one module and graphical representation of three different shading situations with (a) 1%,
(b) 47% and (c) 50% shading of one cell at 1:26 pm, 1:38 pm and 1:41 pm.

The indoor test setup uses ten serials connected commercial MLPE devices feeding the commercial DC/AC inverter. An
overview of the used laboratory hardware setup is visualized in Figure 13. Ten solar array simulators (SAS) individually
controlled powering each MLPE device. To assess the performance of the power optimizer system over one day, the SAS
devices received the values for IMPP, ISC and UMPP, UOC every 5 seconds, based on precalculated I-V curve values of a PV
module from the system simulation. The testing was performed over 12.5 hours.

26
You can also read