2016 Capital Economic Outlook - Tshwane
←
→
Page content transcription
If your browser does not render page correctly, please read the page content below
Capital Economic Outlook
                                              2016

                           T S HWANE Capital Economic Outlook 2016   1
Economic Intelligence Unit
Office of the Executive Mayor

                              Who we are
                              A research-oriented unit in the Office of the Executive Mayor, headed by the Chief
                              Economist.

                              Services we offer
                              • Advisory Services: Qualitative and quantitative research and analysis on micro and
                                macroeconomic conditions affecting decision-making. Deliverables include annual,
                                quarterly and monthly publications, research papers and position papers.
                              • Consultancy Services: Policy and strategy development, planning, analysis, research
                                across a number of areas.
                              • Support Services: Collaborative partnership on projects and stakeholder management
                                co-ordinate the programmes of the City and to establish protocols in a manner that
                                enables it to respond to Council’s oversight requirements.

                              Our Mandate
                              The core function of the Economic Intelligence Unit is to conduct economic policy research
                              aimed at contributing towards appropriate economic policy formulation processes and
                              advise the City accordingly.

                              Authors
                              Shaakira Karolia (Chief Economist), Refiloe Jala, Ntandokabawo James, Matshepo Kanye,
                              Henri Labuschagne, Moeresi Mabe, Ntombizodwa Mabena, Tumiso Maitisa, Lardo Stander,
                              Lodie Venter

                              Contributors
                              Namugaya Kisuule

                              Research Assistants
                              Ayabonga Kolo, Tshepang Modisakoana, Carone Madzhiga, Nancy Rabuma

2   TSHWAN E Capital Economic Outlook 2016
Table of Contents
Foreword by the Executive Mayor                                    6

OUR BACKGROUND                                                     7
Overview                                                           8
Our Projects                                                       9
   City of Tshwane Township Revitalisation                         10
   Free Wi-Fi                                                      10
   Tshwane Rapid Transit (TRT)                                     11
   Tshwane House                                                   11

OUR ECONOMY                                                        12
Our Global Economy                                                 13
   Global sector analysis                                          14
   Global Inflation trends                                         15
Our Country Economy                                                15
   National sector analysis                                        17
Our Provincial Economy                                             18
Our City Economy                                                   25
   Structure of Tshwane’s economy                                  27
   Tshwane’s 7 Regional Economic Overview                          28

OUR PEOPLE                                                         32
City of Tshwane Population                                         33
City of Tshwane Youth Profile                                      34
Education                                                          35
Labour Market                                                      36

OUR ENVIRONMENT                                                    38
Introduction                                                       39
Electricity                                                        39
Water                                                              40
Sanitation                                                         41
Refuse removal                                                     42
Housing                                                            43
Transport System in the City of Tshwane                            43
Bus Rapid Transit                                                  44
Non-motorised transport                                            45
Passenger Rail System                                              46
Sustainability interventions                                       46
    Introduction                                                   46
    Milestones                                                     47
    Projects                                                       48

OUR RESEARCH                                                       49
Land Value Capture                                                 50
Incentive framework and incentive policy                           51
Financing capital expenditure                                      51
Highlights from the water scarcity study                           55
   Introduction                                                    55
   Background                                                      56
   Current Water Sources And Demand                                57
Business intelligence for alternative develoment futures           60
   Introduction                                                    60
   Accuracy of population projections                              61
   Shrinking Cities                                                61
   New Cities and Ghost Towns                                      62
   Tshwane: Mega and still Growing                                 63
   Ensioning for Alternative Development Futures                   65
Tshwane Real Estate trends                                         65

                                                           T S HWANE Capital Economic Outlook 2016   3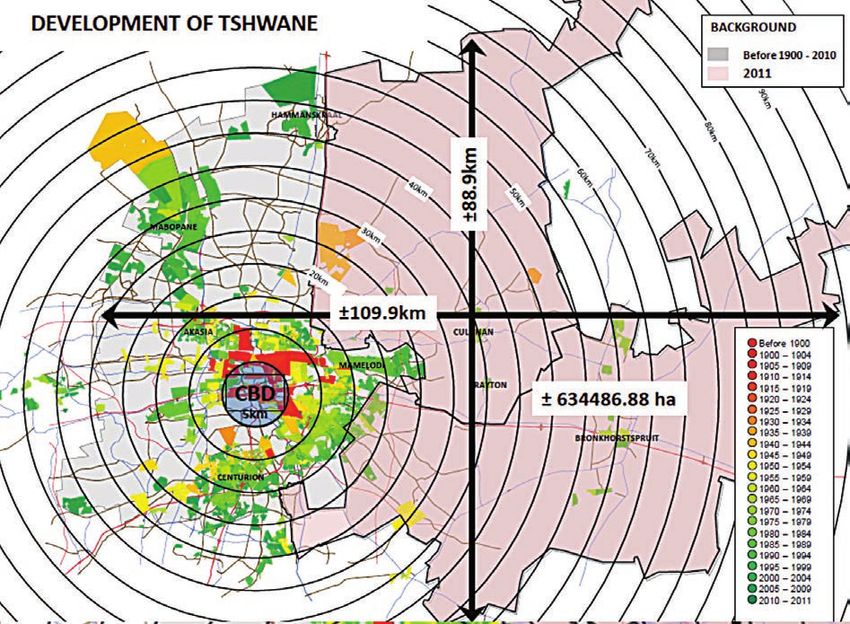
References

                               Figures
                               Figure 1:     Tshwane Free Wi-Fi In Numbers                                                     10
                               Figure 2:     Growth of World Gross Product and Gross Domestic Product by                       13
                                             Country Grouping, 2007–2017
                               Figure 3:     Global Inflation Trends                                                           15
                               Figure 4:     Real Gross Domestic Product, 2010-2015                                            16
                               Figure 5:     GDP By Sector (Percentage Of GDP At Current Prices)                               17
                               Figure 6:     Gauteng’s Contribution to GDP & Other Provinces, 2005-2015                        19
                               Figure 7:     Real GDP Growth Rate & Real GDP, 2005-2015                                        20
                               Figure 8:     Economic Performance Of Gauteng Metros                                            20
                               Figure 9:     Economic Performance Of Gauteng District Municipalities                           21
                               Figure 10:    Contribution To GVA At 2010 Prices                                                22
                               Figure 11:    Tshwane GVA Growth Trend 1996 To 2014                                             23
                               Figure 12:    Sectors Prioritised By Gauteng City Region Economic Development Plan              23
                               Figure 13:    Inflation Levels For Gauteng And Its Three Metros, Jan-Oct 2015                   24
                               Figure 14:    Economic Overview – GVA And GVA Growth                                            26
                               Figure 15:    Contribution To GVA At 2010 Prices                                                27
                               Figure 16:    Sectors Prioritised by SIGS                                                       27
                               Figure 17:    Proportion Of Tshwane GVA-R By Region, 2004 And 2014.                             28
                               Figure 18:    GVA Per Capita Per Region, 2005 And 2015 (Constant 2010 Prices)                   31
                               Figure 19:    Tshwane Population And Growth Rate 2005 – 2015                                    33
                               Figure 20:    Tshwane Population Group Growth Rates 2005 - 2015                                 33
                               Figure 21:    Tshwane Population Pyramid, 2014                                                  34
                               Figure 22:    Functional Literacy (15 Years + Population), 2015                                 35
                               Figure 23:    Tshwane Population By Level Of Schooling, 1996 - 2015                             36
                               Figure 24:    South Africa’s Labour Market Performance, 2008 – 2015                             36
                               Figure 25:    City Of Tshwane Employment (Y/Y Percentage Change), 2005 - 2015                   37
                               Figure 26:    Number Of Households With Electricity Connections From 2005-2015                  40
                               Figure 27:    Number Of Households With Piped Water In The Yard And Inside Dwelling             41
                               Figure 28:    Share of households with flush toilets                                            42
                               Figure 29:    Share of households with formal refuse removal                                    42
                               Figure 30:    Household by type of dwelling                                                     43
                               Figure 31:    Status Quo of NMT in Tshwane – Modal Split for all trips                          46
                               Figure 32:    Solar Water Heater                                                                48
                               Figure 33:    Building Light (T5 fluorescent tubes)                                             48
                               Figure 34:    Traffic Lights (9W LED )                                                          48
                               Figure 35:    Streetlights (70 W HPS)                                                           48
                               Figure 36:    Municipal Capital Funding Instruments (R Million), 2010/11 – 2016/17              52
                               Figure 37:    Capital Financing Instruments By Metropolitan Municipality                        53
                               Figure 38:    Water Scacity by Country in 2040                                                  56
                               Figure 39:    Tshwane regions and water demand                                                  56
                               Figure 40:    Mapping of CoT scenarios against WRP requirements                                 58
                               Figure 41:    Water requirements mapped High Growth Scenarios                                   58
                               Figure 42:    Water system and supply mapping 2012 - 2050                                       59
                               Figure 43:    Water system mapping High Growth scenario 2012 - 2050                             60
                               Figure 44:    UN forecasts of the world populations in the year 2000 and the percentage error   61
                               Figure 45:    Composition of Tshwane 2001                                                       63
                               Figure 46:    Development of Tshwane before 1900-2011                                           64
                               Figure 47:    FNB Market Strength, Demand and Supply                                            66
                               Figure 48:    Municipal Index                                                                   66
                               Figure 49:    Gauteng Metro Average House prices                                                67
                               Figure 50:    Tshwane house prices                                                              68

4   TSHWAN E Capital Economic Outlook 2016
Maps
Map 1:     The Percentage Contribution Of Agriculture, Industry and Services           14
           of Total Global GDP
Map 2:     Tshwane Rapid Transit (TRT) route                                           44

Tables
Table 1:   Gauteng’s CPI Group Indices, Weights And Percentage Change                  26
Table 2:   Varying Approaches To Financing Municipal Capital Expenditures              54
Table 3:   Selection of Shrinking Cities according to Rank                             62

                                                                               T S HWANE Capital Economic Outlook 2016   5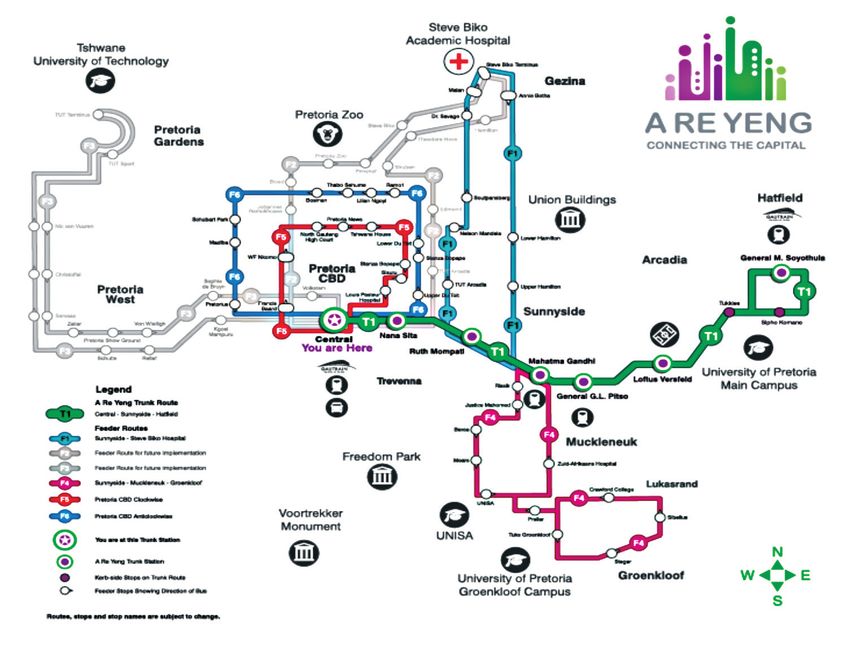
Foreword by the Executive Mayor

2016 Capital                   2016 was a tumultuous year. Significant global events elevated political uncertainty to
                               levels last seen during the Great Recession. The world started the year on the back of
Economic                       wide-spread terror attacks in Europe; the Presidents of major global economies like Brazil
Outlook                        and South Korea, being impeached; the unforgettable June vote of the United Kingdom
                               to leave the European Union; the continued economic slowdown in China; and lastly the
                               unexpected and unprecedented victory of President Donald Trump in the United States of
                               America. Crucially, as political uncertainty continues rising, the future expectation of
                               economic growth keeps on falling.

                               We have started seeing evidence of the effect of political uncertainty on the world economy
                               when OPEC countries announced cutting oil production in an attempt to arrest the almost
                               two-year freefall we observed in oil prices; we saw the Federal Reserve in the US hiking
                               their prime interest rate for only the second time in the last decade; we have witnessed the
                               rise of a new age of ‘nationalism’ in response to the perceived imperfections of
                               globalisation; the worrying rise of extremism in many different forms across the globe and
                               global economic growth performance is at its worst since the start of the new millennium.

                                               The world we face today is quite different to the one we lived in a mere five
                                                   years ago.

                                                        Notwithstanding a very bleak economic picture, we believe that
                                                         for any economy to thrive, one needs essentially three
                                                          ingredients: people, who can perform an array of different jobs
                                                           exceedingly well; businesses which can employ these skills
                                                            and in turn, produce output effectively and competitively; and
                                                            a conducive and enabling environment within which a
                                                            people-business relationship is allowed and stimulated
                                                            to flourish.

                                                            Therefore, our annual Capital Economic Outlook (the CEO)
                                                           is deliberately compiled to not only present a snapshot of the
                                                          immediate past of our economy, but more importantly to also
                                                         present a forward-looking approach to our City’s economy.
                                                            Enjoy the read!

6   TSHWAN E Capital Economic Outlook 2016
O U R B A CKGROUND

                     T S HWANE Capital Economic Outlook 2016   7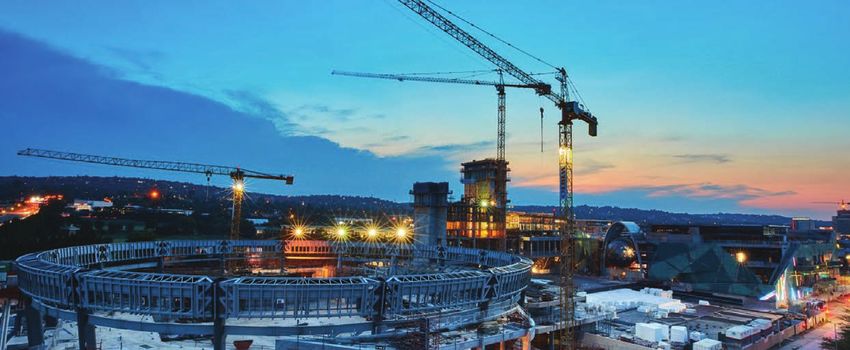
Overview
                               The City of Tshwane is classified as a Category A Grade 6 urban municipality by the
                               Municipal Demarcation Board in terms of section 4 of the Local Government Municipal
                               Structures Act, 1998 (Act 117 of 1998). The Municipality was established on 5 December
                               2000 through the integration of various municipalities and councils that had previously
                               served the greater Pretoria regime and surrounding areas.

                               On 28 May 2008, a proclamation through the Government Gazette was made to
                               incorporate the former Metsweding District Municipality, including Dinokeng tsa Taemane
                               (Cullinan) and Kungwini (Bronkhorstspruit) into the borders of City of Tshwane. The
                               incorporation, which gave birth to the new City of Tshwane in May 2011 after the local
                               government elections, was in line with the Gauteng Global City Region Strategy to reduce
                               the number of municipalities in Gauteng by the year 2016.

                               The new City of Tshwane has a Mayoral Executive System combined with a ward
                               participatory system in accordance with section 2 (g) of the Determination of Types of
                               Municipality Act, 2000 (Act 1 of 2000), and section 2(1) (c) (vii) of the North-West
                               Municipal Structures Act, 2000 (Act 3 of 2000); it has 107 wards, 214 councillors and about
                               3,1 million residents, and is divided into seven regions. It covers 6 368km² of Gauteng’s
                               19 055km² and stretches almost 121 km from east to west and 108 km from north to south
                               making it the third-largest city in the world in terms of land area, after New York and
                               Tokyo/Yokohama.

                               As the administrative seat of Government and hosting a number of Embassies, City of
                               Tshwane has proven to be a leader on the African continent in providing affordable industrial
                               sites, various industries, office space, education and research facilities.

                               An estimated 90 percent of all research and development in South Africa is conducted in
                               the City of Tshwane by institutions such as Armscor, the Medical Research Council, the
                               Council for Scientific and Industrial Research, the Human Sciences Research Council and
                               educational institutions such as the University of South Africa, the University of Pretoria and
                               Tshwane University of Technology.

8   TSHWAN E Capital Economic Outlook 2016
Our Projects

In a quest to fulfil the objectives of the NDP, the City has embarked on numerous
projects aimed to improve living standards of the local public. A series of projects have
been strategically rolled out across the municipal jurisdiction as a means to contribute
towards mitigating the triple challenges facing the country, both on a national and
local scale.

Significant progress has been made in all flagship projects initiated by the City, which will
culminate with transformation of the nation’s capital. Conceptualisation of these projects
are in line with council policies in pursuit of spatial transformation and economic growth.

Some of these projects encompass:
   • Free Wi-Fi,
   • A Re Yeng,
   • Township Revitalisation,
   • Tshwane House

                                                                                  T S HWANE Capital Economic Outlook 2016   9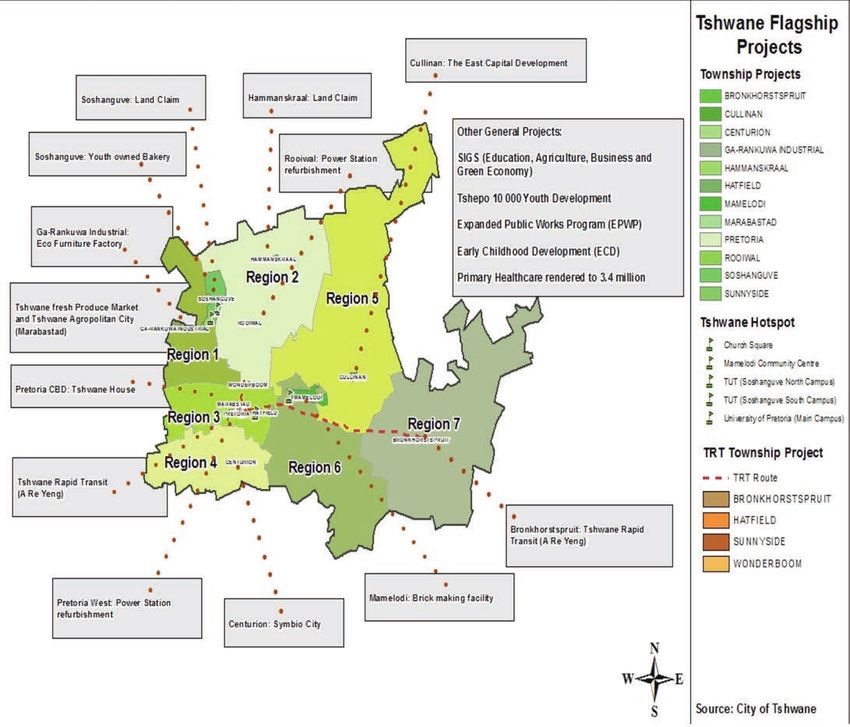
City of Tshwane Township Revitalisation
                                In line with the NDP and the Gauteng Province’s revitalization of the township economy
                                strategy, the City of Tshwane has rolled out numerous programmes aimed at promoting the
                                equal redistribution of wealth. In order to accelerate growth of township economies, the
                                City has undertaken core projects which in turn will contribute towards poverty alleviation
                                and job creation.

                                The breakdown of the 2015/16 financial year achievements and plans are as follows:
                                     • Eco-Furniture Factory Ga-Rankuwa: R1.5 million towards rental and utility
                                         services;
                                     • Youth-owned township bakery facility worth R3.8 million was launched in
                                         Soshanguve in the 2015/16 financial year;
                                     • A R6.6 million first car wash facility will be implemented;
                                     • Brick-making facility in Mamelodi has been allocated R4.9 million;
                                     • A budget of R3 million has been set aside for construction of a paper towel
                                         manufacturing facility;
                                     • Fresh produce facility will receive an amount of R13.5 million over the next
                                         3 years, which includes R3 million in 2015/16 for construction in Marabastad.

             Free Wi-Fi
                                The pilot project launched in late 2013, with 5 key sites identified and then enabled as Free
                                Internet Zones (FIZ). Aligning to Tshwane’s academic stronghold status, WiFi was initially
                                rolled out at 3 key educational institutions and in 2 high-traffic community centres: Tshwane
                                University of Technology Soshanguve Campus, University of Pretoria Hatfield Campus,
                                Tshwane North College, Mamelodi Community Centre and Church Square in the Pretoria
                                CBD.

                                The second phase of implementation saw a further 213 FIZs begin to bring public spaces
                                in the City’s sprawling township communities - Soshanguve, Mamelodi and Atteridgeville
                                - online. In April 2015, Tshwane celebrated as Project Isizwe breached the half a million
                                mark.

FIGURE 1:                       To date, Project Isizwe has deployed more that 750 FIZs across the City with an additional
TSHWANE FREE WI-FI              700 planned for the Capital City by the end of 2016. FIZ locations are carefully selected
IN NUMBERS                      public spaces like schools, healthcare facilities and community centres.

                                                                        Like any big city, people in Tshwane are on the
 Unique Users                                         268 8095
                                                                        move. In 2014, Project Isizwe switched on WiFi
 Total Sessions                                       176 492 742
                                                                        Bus, which delivers a free experience to 350 000
 Total Downloads                                      3 300.92 TB       connected commuters. Working in partnership
 Total Uploads                                        396.11 TB         with RADWIN, Project Isizwe is able to provide this
 Average Capped users per day                         7%                world-first in mobile connectivity - vehicular mobile
 Average Unique users per day                         91 635            units on the busses connect to specialised high
 Average Sessions per day                             240 308           capacity base stations along the route to ensure
                                                                        uninterrupted connectivity.

10   TSHWAN E Capital Economic Outlook 2016
Tshwane Rapid Transit (TRT)
An initiative aimed at transforming public transport and that will improve commuters’
experience of mobility. The project uses a concept known as Bus Rapid Transit (BRT),
A Re Yeng, Light Rail Tram (LRT), Non-Motorized Transport (NMT), Tshwane Bus
Services and Wonderboom Airport.
The City added 12 more buses with
free Wi-Fi access in the existing fleet
during the 2015/2016 financial year.
20 compressed natural gas (CNG)
buses were delivered in Nov and
Dec 2015.
Status: A pre-feasibility study has
been done to introduce a Light Rail
Tram (LRT) into the local transport
system. The City advocates for public
forms of transportation and
discourages private motorised
transport, and thus the improvement
and integration of public transport
systems.
Tshwane House
The Tshwane House is set to be the seat of the city council and will be representative
of the old and the new since it will be located on the site of the demolished municipal
headquarters, the Munitoria. It will be home to the legislative and executive branches of
the city. Construction is almost complete on Madiba, Pretorius and Thabo Sehume streets
and Tshwane House is envisaged to be ready for occupation by mid-2017. This is slightly
behind schedule as per the plans and initial project life progress.
T S HWANE Capital Economic Outlook 2016 11O UR ECONOM Y
REVI TALI SE
12 TSHWAN E Capital Economic Outlook 2016Our Global Economy
Recent data shows that global economy continued to expand during 2015 at a moderate
and uneven pace, as the protracted recovery process from the recent global financial
crisis was still saddled with uncompleted and in some instances, fragmented post-crisis
adjustments. In the second quarter of 2015, the global economy recorded modest
growth, despite divergence in the performance of major individual economies. Global
recovery has also been confronted with some new challenges, including a number of Figure 2 depicts global and
unexpected shocks, such as the intensifying geopolitical conflicts in various areas of the developing country growth
world and the humanitarian impact thereof as well as growing cyber insecurity across prospects from 2007 to 2017.
developed and emerging market economies. Despite a modest recovery in
high-income countries, global
Global growth again fell short of expectations in 2015, slowing to 2.4 percent from growth slowed in 2015, as
2.6 percent in 2014. The disappointing performance was mainly due to a continued developing-country growth
deceleration of economic activity in emerging and developing economies amid dipped to a post-crisis low.
weakening commodity prices, global trade, and capital flows. Going forward, global Weakening prospects are
growth is projected to edge up, but at a slower pace than envisioned in the June 2015 most visible among key
forecast, reaching 2.9 percent in 2016 and 3.1 percent in 2017-18. The forecast is commodity exporters,
subject to substantial downside risks, including a sharper-than-expected slowdown in pointing to a significantly
major emerging and developing economies or financial market turmoil arising from a lower contribution to global
sudden increase in borrowing costs that could combine with deteriorating fundamentals growth than in the past.
and lingering vulnerabilities in some countries. (IMF World Economic Outlook, 2015). China’s gradual slowdown
and rebalancing continued.
The economic performance of the world’s two largest economies is indicative of growth Low-income countries
divergences in 2015 among major economies throughout the world. The United States continued to show some
economy is gradually powering up, while China’s economy is gradually powering down resilience, but a rising share
or at least tapering off (World Bank, 2015). Countries like United Kingdom and India fared of the world’s extreme poor
fairly well, while Brazil and Russia remain in deep recession. Most countries, such as live in countries with slowing
Canada for instance, growth.
however, fall into the FIGURE 2:
‘moderate growth’ GROWTH OF WORLD GROSS PRODUCT AND GROSS DOMESTIC PRODUCT BY
performance category. COUNTRY GROUPING, 2007–2017
For many countries, the
negative trade impact of
the Chinese economic
slowdown has far
outweighed the positive
impact of the
resuscitation of the U.S
economy and increased
trade. Most major
developing and emerging
market economies have
been acutely hit by China’s
slowing growth,
particularly in Africa.
Source: World Bank 2016.
T S HWANE Capital Economic Outlook 2016 13Global sector analysis
According to a 2015 report by the Food and Agriculture Organisation (FAO) of the United
Nations, real global value-added in the Agriculture, Forestry and Fisheries (AFF) sector rose
from $0.7 trillion to $1.9 trillion between 1970 and 2013, although the sector’s contribution
to real GDP fell from 4.3 percent to 3.3 percent. It is important to note that these
measures, however, ignore the crucial role of the sector in the agro-industry value-chain,
natural resource use, environmental impacts, and food security.
In 1970, the main contributors to global agriculture value added were Asia and the Pacific
as well as Europe, accounting for 34 percent and 27.5 percent of global output a
respectively. By 2013, Asia and the Pacific account for almost half the worlds value-added
in agriculture at 49.8 percent. According to the World Bank, services’ correspond to ISIC
MAP 1: (International Standard Industrial Classification) divisions 50-99, which include value added
THE PERCENTAGE in wholesale and retail trade (including hotels and restaurants), transport, and government,
CONTRIBUTION OF financial, professional, and personal services such as education, health care, and real
AGRICULTURE, INDUSTRY estate services. This sector also includes imputed bank service charges, import duties, and
AND SERVICES OF TOTAL any statistical discrepancies noted by national compilers as well as discrepancies arising
GLOBAL GDP from rescaling. Accounting for about 63.5 percent of total global wealth, the services sector
is the largest sector of
the world. The United
States accounts for the
largest share of the
services sector in the
global economy, which
boasts around 13.5
trillion USD. The services
sector is the largest
sector of 194
countries, with more
than 30 countries reliant
on this sector for more
than 80 percent of
their GDP.
Source: http://chartsbin.
com/view/1002
14 TSHWAN E Capital Economic Outlook 2016Global Inflation trends
FIGURE 3:
Global inflation remains moderate, despite elevated inflation rates in about a dozen GLOBAL INFLATION
developing countries and economies in transition, and some developed economies in TRENDS
the euro area that are
confronted with the
risk of deflation.
Average inflation for
developed economies
is estimated to have
decreased from 1.3
percent in 2014 to 1.1
percent in 2015 (mainly
due to the slowdown
in consumer prices in
both Japan and the
US), inflation in the EU
is estimated to have
decreased from 0.4 per cent in 2014 to almost 0 per cent in 2015 due to several factors Source: IMF, 2016
including a sizeable output gap coupled with a slow-paced recovery. A fall into deflation is
considered a downside risk for several euro area countries because if persistent, deflation
could potentially lead to greater reluctance by households and businesses to increase
their current spending, thus weakening aggregate demand.
The average inflation rate for the economies in transition is estimated to have decreased
by 1.0 percentage points in 2015. Average inflation for developing economies is expected
to fall slowly over the outlook period. In Africa, inflation should decrease significantly to
almost 8.3 percent in 2017, as a result of increasingly prudent monetary policies as well
as moderating import prices, after increasing substantially between 2015 to 2016.. While
inflation for East Asia is expected to remain around the recent levels of 3–5 per cent over
the outlook period, a significant decrease is projected for South Asia due to falling inflation
in almost all countries, especially in India and Iran. In Western Asia, inflationary pressures
have been well contained, with the exception of the Syrian Arab, Republic, Turkey and
Yemen. In Latin America and the Caribbean, average regional inflation has continued to
increase in 2015, driven by Argentina and Venezuela, however, it is expected that will
decrease moderately to 8.8 percent in 2015.
Our Country Economy
Real economic growth in South Africa turned positive in the third quarter of 2015.
Following a contraction of 1.3 per cent in the second quarter of 2015, growth in real gross
domestic product accelerated to an annualised rate of 0.7 per cent in the third quarter.
This turnaround in growth reflected increases in the real value added by both the
secondary and tertiary sectors.
T S HWANE Capital Economic Outlook 2016 15By contrast, the real value added by the primary sector declined at a slightly faster pace
over the period. (SARB, 2016). In its Medium Term Budget Policy Statement, the South
African National Treasury projected that the domestic economy will grow at about 1.7 per
cent in 2016. This projected growth rate signals a considerable fall from the projections
made in the annual budget speech (which takes place February), when Treasury
optimistically envisaged a 2 percent growth rate for 2015 and 2.4 per cent in 2016. The
IMF also projects a decline in growth for 2016 (National Treasury, 2015). According to
National Treasury, the factors that contributed to the review of the growth rate, which has
FIGURE 4: resulted in growth forecasts being adjusted lower, include electricity supply constraints,
REAL GROSS DOMESTIC falling commodity prices and lower confidence levels. All of which have resulted in South
PRODUCT, 2010-2015 Africa’s growth forecasts being revised downwards.
The public sector wage
bill, however has been
increasing while growth
has been very slow.
Persistent shortages in
electricity have had a
knock-on effect on the
economy and occurred
concurrently with the
worst drought in two
decades, which
continues to devastate
agriculture whose real
proportion of GDP has
been reduced
by 16.2%.
Source: South African Reserve Bank
The Rand (ZAR) depreciated by more than 30% between December 2014 and December
2015 against the US Dollar (USD), making it one of the worst performing currencies for the
2015 period.
Consumer price index (CPI) inflation remained within the target range of 3% to 6% year-on-
year in 2015, owing to the continued currency depreciation and the ongoing drought, with
pressures on the CPI likely persisting in 2016.
Limited electricity supply, although more predictable than over the preceding 4 year period,
high electricity cost and new capacity energy infrastructure that has been delayed for more
than 4 years, have also weighed down manufacturing, mining and service-sector activity.
National government revenue increased by 8.4% to reach ZAR 955 billion (24.8% of GDP),
mainly due to higher collection of personal income tax, taxes on property and value added
taxes. National government expenditure increased by 8% to reach ZAR 1.13 trillion (29.4%
of GDP). Monetary policy has been tightened with the repurchase rate reaching 5.75%
during 2015 to respond to the rising inflation risk. Despite the increased rate, demand for
credit by the private sector rose by 8.6% in August 2015 compared to 8% in June.
Unemployment remains persistently high at 25.3%, and is particularly pervasive among the
youth, at 52.5% in 2015. High unemployment, especially among black South Africans, is
16 TSHWAN E Capital Economic Outlook 2016the main cause of the widening income inequality, as shown by a Gini coefficient of 0.69,
which is one of the highest in the world. To resolve these challenges, the government
unveiled a nine-point plan to kick-start economic growth, increase investment and
create jobs:
• Resolving the energy challenge;
• Revitalising agriculture and the agro-processing value chain;
• Advancing beneficiation or adding value to the mineral wealth;
• More effective implementation of a higher impact Industrial Action Policy
Action Plan (IPAP);
• Encouraging private-sector investment;
• Moderating workplace conflict;
• Unlocking the potential of SMMEs, cooperatives, townships and rural
enterprises;
• Boosting the role of state-owned companies, information and
communication technology infrastructure and broadband roll-out, water,
sanitation and transport infrastructure; and
• Operation Phakisa, which is aimed at growing the ocean economy and
other sectors.
National sector analysis
The diversification of a country’s economic structure has proven to be a critical aspect
of growth, particularly in the event of internal and external shocks. Historical data and
current growth trends indicate that the existence of more than one or two major sector
or subsectors allow economies to transition better when anticipated and unanticipated
shocks occur.
According to the South African Reserve Bank, the real valued added by primary sector in
the second quarter of 2015 contracted significantly. Despite a promising start of an
increase of 3.3 percent in the first quarter of 2015, measured over a year, the real output
of the primary sector declined at a rate of 9.3 percent in the second quarter as
production levels in both agriculture and the mining sector declined over the period.
FIGURE 5:
GDP BY SECTOR
(PERCENTAGE OF GDP AT
CONSTANT PRICES)
Source: Data from domestic authorities
T S HWANE Capital Economic Outlook 2016 17Although the manufacturing sector continues to occupy a significant share of the South
Africa economy, despite its relative importance declining from 19 percent in 1993 to about
17 percent in 2012 in real terms (Statistics South Africa, 2015), a downward trend was
recorded for the second quarter in the manufacturing sector. Contracting at a rate of
2.4 percent in the first quarter, real value-added by the manufacturing sector shrank even
more in the second quarter, with a reported decline of 6.3 percent. Production declines
were recorded across sub-sectors with the larger declines recorded in the sub-sectors that
supply basic iron and steel, non-ferrous metal products, petroleum and chemical products.
The downward trend in these subsectors has been attributed to decreased demand from
China specifically, as well as dwindling domestic demand, falling commodity prices, energy
constraints and higher production costs. A significant contraction has also been recorded
in the food and beverages subsector, and this is due to lower domestic and regional
demand. Consequently, according to the South African Reserve Bank, the utilisation of the
production capacity in the manufacturing sector has thus contracted slightly to
80.7 percent in the second quarter of 2015 from 81.5 percent in the first quarter.
Although the increasing economic activity in the construction sector has been playing an
increasingly significant role in the secondary sector, thanks to major private and public
infrastructure development projects, growth in the real value-added by the construction
sector has moderated in second quarter of 2015.
The economic importance of services in the South African economy has grown
considerably in the growth story of South Africa since the dawn of democracy. Not only
has it become a major contributor to real GDP, but the sector has played a major role in
job creation, attracting investment and increasing trade flows as an input to manufacturing
and as well as a highly tradable component of the economy.
In spite of a slowing growth in the tertiary sectors, the service sector has grown in contrast
with the manufacturing sector. Growth in real output by government accelerated, while the
economic performance of the transport, communication, finance, insurance, real-estate
and business services grew at a slower rate in the first and second quarter of 2015.
The National Development Plan aspires to ensure economic growth of more than
5 percent per year to achieve the envisaged employment, economic and social
transformation objectives. This essentially means that the economy will have to grow by
two percentage points more than the average growth rate over the past couple of decades.
The government has made great strides in redressing the unequal access to services and
facilities by is investing partly in redressing the inherited underinvestment in infrastructure
through the National Infrastructure Plan, which will result in additional infrastructure
investment over the coming years to the extent of a quarter of 2013 GDP. The vast majority
of this investment is in electricity generation and transport infrastructure.
Our Provincial Economy
The Gauteng economy is the driving force behind the South African economy as it is the
major contributor to the national GDP. Furthermore, Gauteng remains the economic and
industrial hub of South Africa and the SADC region and a significant player in Africa’s rising
economic fortunes. Gauteng accounts for more than 10 percent of Africa’s GDPand since
2010 has been the most popular foreign investment destination for projects in Africa.
18 TSHWAN E Capital Economic Outlook 2016During the 2015 State of the Province Address (SOPA), Premier David Makhura
emphasized that the Gauteng City Region should be integrated globally as a
competitive city region where economic activities of different parts of the province
complement each other in consolidating Gauteng as economic hub of Africa and an
internationally recognised global city region. The key elements of radical economic and
decisive spatial transformation, which will help in addressing the structural problems of the
provincial and national economy as outlined by SOPA (2015) are as follows:
• Changing ownership patterns to bring black people into the economic
mainstream and creating black industrialists;
• Changing the current industrial structure of our economy to privilege
manufacturing and industrialisation through the processing of rich mineral
resources and other raw materials locally;
• The development of new modern, innovation-driven industries in the areas of
high-tech, biotechnology, the green economy and blue economy;
• Investing in skills development to change the skills profile of the citizenry in line
with the new strategic sectors and modern industries;
• Changing income distribution to ensure equity and decent living standards for all;
• Transforming the apartheid spatial economy and human settlement patterns to
integrate economic opportunities, transport corridors and human settlements;
• Growing the SMME sector as a key driver of growth and revitalising and
mainstreaming the township economy;
• Strengthening the capacity of the state to direct economic development and
enhance the competitiveness of strategic economic sectors;
• Significant investment in economic infrastructure as the key stimulator of growth
and investment; FIGURE 6:
• Transformative partnerships between the private and public sector in addressing GAUTENG’S
the developmental challenges outlined in the NDP CONTRIBUTION TO GDP
& OTHER PROVINCES,
In July 2015, the province released the Gauteng City Region Development Plan 2005-2015
(2015-2020). This plan provides a comprehensive overview of the economy, sets policy
direction for a sustainable,
balanced and equitable
economic development.
The implementation of this
plan and other associated
strategies aims to
contribute to the
diversification of the
provincial economy. The
subsequent monitoring
and evaluation of these
strategies will further
contribute to enhancing
and sustaining national
economic output.
Source: IHS Global Insight, 2016
T S HWANE Capital Economic Outlook 2016 19This section provides an analysis of the provincial economic performance, the structure as
well as the outlook for the province’s economic sectors. Contributions towards the GVA
(gross value added) are made by the province’s three metropolitan municipalities namely:
the City of Johannesburg (CoJ), the City of Tshwane (CoT) and Ekurhuleni, and three
district municipalities: Metsweding, West Rand and Sedibeng. The metropolitan
municipalities are made up of large urbanised city regions while districts are relatively rural
FIGURE 7: in nature. Furthermore, metros cover smaller area of land in comparison to districts, but
REAL GDP GROWTH are bigger in terms of population and constitute higher levels of economic activity. This
RATE & REAL GDP, section entails economic analysis in terms of GVA and GDP performances of the three
2005-2015 Gauteng Metros and two districts.
Given its major
contribution to the GDP,
Gauteng has always
played a significant role
in the national economy.
For the period 2005 to
2015, Figure 6 shows
Gauteng’s contribution to
GDP and compares this
to average contributions
by other provinces. From
34.0 percent in 2005, the
province’s relative
contribution increased
steadily to 35.21 percent
Source: IHS Global Insight, 2016 in 2015. The relative
contribution of the Gauteng province to the national economy is more than one third over
the entire review period. Although not shown in the figure above, the Gauteng provincial
economy is not ony the power house of the South African economy, but also of the SADC
region and indeed, the whole of Africa.
The economy of the province has diversified significantly since the early 1990s when it
was dominated by activities in the mining and manufacturing sector. Currently community
services, finance and business service subsectors have become the major contributors to
the province’s GVA
FIGURE 8:
ECONOMIC
PERFORMANCE OF
GAUTENG METROS
Source: IHS Global Insight, 2015
20 TSHWAN E Capital Economic Outlook 2016The City of Johannesburg contributes more to South Africa’s gross domestic product
(GDP) than any other city, which accounts for 15 percent of the South African economy
and 42 percent of the economy of Gauteng province and its top three sectors include
finance, community service and trade. The CoJ’s Growth and Development Strategy 2040
(GDS 2040) acknowledges the ever-changing economic and social forces that
affect South Africa and the vital role that cities play in creating an enabling environment
for private business to confidently invest in job-creating sectors. In line with its GDS 2040
plan and the broader theme of building a more inclusive, faster-growing and sustainable
economy a number of sectors have been prioritised for investment. These include
Agribusiness, BPOs and ICT, Creative Industries, Green Economy, Infrastructure,
Manufacturing, Mining Beneficiation and Tourism.
Tshwane plays an important role in the economy of Gauteng, some of the best performing
sectors include community services, finance and transport. The City contributes 9 percent
to the South African economy and 25 percent to the economy of Gauteng Province. The
City of Tshwane 2030 Sustainable and Inclusive Growth Strategy (SIGS) has been
initiated by the City to create specific actions in order to realise the aspirations of the City
– in conjunction with the Province and National activities. Four sectors have been
identified, in which the City will focus its efforts over the next fifteen years.
The four sectors are:
• Education and the Knowledge Economy;
• Agriculture and Agro-processing;
• Business and Diplomatic Tourism; and
• Green Economy.
The City will continue to support traditional sectors, such as the automotive, mining, retail,
finance and support services sectors, which already have strong plans and strategies and
remain core assets of the City’s economy.
Ekurhuleni’s GVA accounts for 8 percent of the South African economy and 22 percent of
the Gauteng Province economy. The top three sectors in Ekurhuleni are manufacturing,
construction and transport. In the State of the Ekurhuleni Address, the Executive Mayor,
Cllr. Mondli Gungubele stressed that although manufacturing displayed a steady decline in FIGURE 9:
its contribution to employment since 1996, it remains central for employment goals in the ECONOMIC
municipality. In an effort to strengthen Ekurhuleni’s economy, and to achieve the PERFORMANCE OF
socio-economic goals of creating employment, reducing poverty and inequality, the GAUTENG DISTRICT
municipality has out Growth and Development MUNICIPALITIES
Strategy (GDS) themes.
One of these themes,
highlights the metros
objective to Re-industralise.
Under this ambit,
Ekurhuleni aims at
revitalising the manufacturing
sector and the regeneration
of township economies.
Source: IHS Global Insight, 2015
T S HWANE Capital Economic Outlook 2016 21The Sedibeng District Municipality accounted for about 3.8 percent of Gauteng’s GVA
in 2004, but this has increased to 5.7 per cent in 2015, the district also contributed 2.0
percent nationally in 2015. The current size of Sedibeng District Municipality is R61,5 Billion
(constant prices 2010). This may partly be as a result of the declining contribution of the
manufacturing sector. The Sedibeng District Municipality is one of the five most important
centres of high-value mass production manufacturing in South Africa. Manufacturing
FIGURE 10: contributed 31.4 percent to the local economy in 2015, making it the single biggest
CONTRIBUTION TO GVA contributor to the municipality’s GVA. This is dominated by the fabricated metal
AT 2010 PRICES (ArcelorMittal) and chemical (SASOL) sectors.
West Rand accounted for
5.3 percent of the
province’s economic output
in 2004 and this declined
to 4.6 per cent in 2015.
The current size of West
Rand District Municipality
is R49.9 billion (constant
2010 prices). Economic
activity in the region is led
by the mining & quarrying
sector, despite posting a
steady decline in recent
years.
Source: IHS Global Insight, 2016
Gauteng’s economic structure is dominated by service sectors. From an economy originally
dominated by mining, the province has grown in diversity. Gauteng was established with
the establishment of Pretoria in 1855 and the establishment of Johannesburg thereafter in
1886 as gold mining towns the sectoral contribution and composition of Johannesburg’s
economy demonstrates the dominance. However, today the sectoral contribution and
composition of Gauteng’s economy demonstrates the dominance of finance, community
services and manufacturing. Combined, these sectors accounted for a 65.5 percent of
GVA in 2015.
The structure of Gauteng’s economy has not changed substantially over the last 10 years,
however several sectors have shown promising growth over the past decade. These
include community services, which at 4.3 percent recorded the highest growth increase,
followed by finance with a 2.0 percent increase and electricity with 1.2 percent increase in
the growth rate. According to Gauteng City Region Economic Development Plan (2015-
2020), given its current economic structure, the province will have to be biased towards the
service sectors, especially community services, finance and transport relative to productive
sectors such as manufacturing, transport and construction. Nonetheless, if Gauteng is to
create jobs in the productive sectors, which traditionally absorb a relative high labour force,
the province will need to take bolder steps to arrest the de-industrialisation dilemma, which
will require having a higher employment multiplier and innovative strategies for creating
new wealth. The manufacturing sector should be at the centre of economic growth and
development, hence the need to invest skills in various sub-sectors of the economy and
addressing the high barriers of entry characterised by monopoly, oligopoly in critical
22 TSHWAN E Capital Economic Outlook 2016industries with high growth potential such as agro-processing (maize, flour and wood
related industries) and steel. The concerted reducing of high barriers of entry will be a
significant driver for new emerging businesses (enterprises) that are trying to gain access
into the mainstream economy. Such an approach would have high multiplier effects in
terms of inclusion.
FIGURE 11:
TSHWANE GVA GROWTH
TREND 2005-2015
Source: IHS Global Insight,
2016
FIGURE 12:
Over the period 2005 to
SECTORS PRIORITISED
2015, the economy of
BY GAUTENG CITY
Tshwane registered the
REGION ECONOMIC
highest growth among the
DEVELOPMENT PLAN
metropolitan municipalities
in South Africa, averaging
Source: Gauteng City
3.9 percent per annum.
Region Development Plan
The growth trend over this
(2015-2020)
period was quite volatile,
reaching both lows of -0.9
percent and highs of +6.2
percent over the 11-year
period. Tshwane’s economy
outperformed both
provincial and national
growth averaging at a
growth rate of 4.2 percent
compared to 3.4 percent in
Gauteng and 3.0 percent in
South Africa.
T S HWANE Capital Economic Outlook 2016 23In a quest to achieve the goals set out in the NDP, the Gauteng Province has prioritised
eleven industrial sectors which will be supported extensively to in order to maximise on the
potential employment/development multiplier, as well as on the backward and forward
linkages identified in these sectors. This sectoral strategies support labour intensive
industries that largely consume skilled, semi-skilled labour by leveraging highly skilled
workers in the province.
The principal objective of the eleven Industrial sector strategies is to provide the Gauteng
Provincial Government and its partners with a structured approach and actionable plans to
stimulate, revive and sustain the economic sectors that would positively affect the
industrialisation, transformation and modernization of the economy. The sector strategies
aim to drive the Gauteng economy in a new trajectory with the following outcomes:
• An economy that is modern in that it promotes in that it promotes the
diversification of the industrial structure;
• An economy that is inclusive in that it contributes to the revitalisation of township
economies and to spatial development;
• An economy that is inclusive that it expands opportunities for greater ownership
and control by previously disadvantaged groups;
• An economy that is inclusive in that promotes equality through high income
distribution; and
• An economy that is inclusive in that it creates more employment
FIGURE 13:
INFLATION LEVELS FOR
GAUTENG AND ITS
THREE METROS,
JAN-OCT 2015
Source: Statistics
South Africa-CPI,
2015
24 TSHWAN E Capital Economic Outlook 2016The inflation rate of the three metropolitan municipalities in Gauteng are compared in TABLE 1:
the figure 2.38 from January to October 2015. The monthly inflation rate for Tshwane GAUTENG’S CPI GROUP
remained constant at 4.9 percent between September and October 2015 whereas the INDICES, WEIGHTS AND
inflation rate for both City of Johannesburg, Ekurhuleni and Gauteng increased over the PERCENTAGE CHANGE
same period by 0.1 percentage points.
Percentage Change
Index Description Weight Month-on-month Year-on-Year
Food & non-alcoholic beverages 13.06 0.5 6.1
Alcoholic beverages and tobacco 5.21 0.7 6.9
Clothing and Footwear 3.16 0.4 5.5
Housing and utilities 23.74 0 5.1
Household contents and services 4.67 0.4 2
Health 1.6 0.5 5.8
Transport 18.52 -2.6 -1.9
Communication 2.6 0 -1.8
Recreation and culture 3.68 0.4 3.1
Education 3.23 0 9.1
Restaurants and hotels 3 0.1 8.9
Miscellaneous goods and services 15.9 0.6 7.5
All Items 100 -0.2 4.3
Table 1 shows that the main determinants of inflation in Gauteng based on the respective Source: Statistics South
weighting of the items and the determinants are prices changes in housing and utilities, Africa-CPI, 2015
transport, miscellaneous goods and services food and non-alcoholic beverages. These
four broad determinants, in terms of weighting, contributes more than 71 percent to the
level of inflation and inflation movements in the province.
Among the 12 group indices, the annual inflation rate of education (9.1), restaurants and
hotels (8.9), miscellaneous goods and services (7.5) alcoholic beverages and tobacco
(6.9), food & non-alcoholic beverages (6.1), health (5.8), clothing and footwear (5.5),
housing and utilities (5.1) were higher than the national rate of 4.7 perecent. Transport and
communication accounted for negative contribution of 1.9 and 1.8 respectively.
The annual increases of the five indices out of twelve indices were above the upper limit of
the inflation target zone of 6 percent.
Our City Economy
Globally, cities are the driving force for economic development and social progress, and in
the South African context it is at the level of local government that the actual realisation of
the ideals of the Freedom Charter, the Constitution, the RDP and the NDP is driven.
Indeed, the country’s Metros account for more than 60 percent of South Africa’s
economic output.
In reality, cities have historically driven growth in South Africa. According to Turok (2012),
Cities have consistently outpaced the rest of the country in terms of economic and
employment growth. This is because they tend to be more productive in terms of the
T S HWANE Capital Economic Outlook 2016 25value of the goods and services they generate and the efficiency with which they are
produced. According to the World Bank (2009) this partly reflects the ‘agglomeration
economies’ that benefit large concentrations of economic activity, including: matching
business requirements for labour, premises and other resources; sharing infrastructure,
services and information; and mutual learning between firms and other institutions.
This implies that city-regions will have an even more relevant role as engines of economic
growth and social cohesion. Tshwane, like other capital cities around the globe, is a core
driver of national growth and development. Tshwane’s economy will have to grow massively
if it is to fulfil the NDP targets of eliminating poverty.
The City of Tshwane is home to a range of higher-value functions such as corporate
headquarters, financial and business services and manufacturing, and high-order
public services, such as national departments, universities and major hospitals. To be more
specific, the City accommodates more than 30 Johannesburg Stock Exchange (JSE) listed
FIGURE 14: companies, home of national government departments, three Universities, hosts 134
ECONOMIC foreign embassies and missions and 26 intenrational organisations, giving it the largest
OVERVIEW – GVA AND concentration of diplomatic and foreign missions in the world after Washington DC in
GVA GROWTH the USA.
Source: IHS Global Insight, 2016
The City of Tshwane, as one of the major economic hubs in the country, has not been an
exception to this trend. The economic output of the City of Tshwane has expanded at an
annual average of 3.9 percent per annum over the last five years, outstripping the national
GDP growth average by at least one percentage point between 2010 and 2015. Overall, no
city in the Gauteng City Region outperformed the growth rates recorded by the CoT in the
last five years.
The City of Tshwane is the fourth biggest municipality in South Africa and second biggest
in Gauteng in terms of gross value added by region with gross value add of R245.1 billion.
In 2015, City of Tshwane contributed 25 percent to the provincial economy. Moreover,
Tshwane accounted for 9 percent of the Country’s economic compared as compared to
15 percent for the City of Johannesburg.
26 TSHWAN E Capital Economic Outlook 2016According to the City of Tshwane’s Sustainable and Inclusive Growth Strategy, the City
has considerable potential to grow its economy and significantly increase employment
levels over the next 15 years. Tshwane has the potential to double the size of its economy
and its workforce over this period, generating an additional R330 billion in GVA, together
with 1.2 million additional jobs
Structure of Tshwane’s economy
Tshwane has a diversified, emerging as a vibrant economy with significant community
services, finance and transport. Tshwane has a large government sector (community FIGURE 15:
services), reflecting the presence of national and provincial departments and parastatals. CONTRIBUTION TO GVA
The sector recorded 32.3 percent contribution to Tshwane’s GVA in 2015. The five main AT 2010 PRICES
sectors in 2015 were community services (32.3 percent), finance (25.1 percent), transport
(12.2 percent), Trade (12.4
percent) and manufacturing
(9.5 percent). Overall, the
significant sectors of growth
in Tshwane include
government, social and
personal services,
construction, trade, transport
and finance with the green
economy and research and
innovation and development
representing crucial
multi-dimensional and
dynamic sectors of growth.
Source: IHS Global Insight, 2016
In particular, for the City of Tshwane to achieve total additional GVA or in other words the
added-value required to meet NDP targets, the City needs to more than double the size FIGURE 16:
of its economy (from ZAR 232.7 billion in 2013 to ZAR 645 million in 2030 ) and create SECTORS PRIORITISED
almost one million jobs. The City’s economy is concentrated around non-tradable BY SIGS
sectors, which made up
almost 70 percent in 2015.
The challenge with
non-tradable sectors (such
as subsistence agriculture,
telecommunications,
transport, and retail, etc.)
is that they only grow in
reaction to economic
developments and
population growth trends,
and cannot achieve growth
independently.
Source: IHS Global Insight, 2016
T S HWANE Capital Economic Outlook 2016 27Tshwane’s Sustainable and Inclusive Growth Strategy (SIGS), which advocates for
development in sectors with the greatest potential to grow in terms of GVA. These are to
be developed against the backdrop of the green economy concept and principles.
Education and the knowledge economy, agricultural production and agro-processing,
tourism and the green economy could contribute up to 770,000 jobs and ZAR 110 billion
to GVA by 2030, accounting for 65 percent and 26 percent of NDP targets respectively.
These high potential sectors also represent a great opportunity for citizens with different
levels of skills to find a job in the near future.
For these sectors, the City is well positioned to drive growth. Achieving this sustainable
and inclusive growth will require focus and proactive actions, as well as the collaboration
of other stakeholders (national and provincial government, private-sector investors, donors
and academia).
Tshwane’s 7 Regional Economic Overview
The City of Tshwane is divided into seven administrative and functional regions that have
been created to assist with a multidimensional approach to improve service delivery. The
Regionalization Model has assisted the City to better organise, coordinate and align the
interaction between government and the people.
FIGURE 17:
PROPORTION OF
TSHWANE GVA-R BY
REGION, 2004 AND
2014.
Source: IHS Global
Insight, 2016
Figure 17 above summarises the GVA and contribution by all regions in the City of Tshwane,
this figure further illustrates the change in GVA contribution in 2005 and 2015.
It can be noted from the figure that the Regional contribution to Tshwane’s GVA only
changed marginally over the period. Region 3 is still relatively dominant in Tshwane in terms
of GVA contribution with a 30 percent contribution, although this has decreased from 34
percent from 2005. Region 6 is the second largest contributor at 25 percent, this contrition
has changed slightly over the last ten years.
Region 5 (old Nokeng tsa Taemane) and Region 7 (old Kungwini) are the regions with the
lowest contributions to Tshwane’s economy, the regions contributed 2 and 3 percent
respectively.
Government, Community and Personal Services
The sector includes a wide variety of government, social and personal services delivered by
the public and private sectors, including public administration, education, health and social
work, recreational and sporting activities and other personal service activities.
28 TSHWAN E Capital Economic Outlook 2016This sector is predominantly determined by the City budget and the budget of other
spheres of government who implement projects within the City’s boundaries. As such,
the sector has an impact on individuals and households beyond what can be captured in
traditional economic data sets (such as the impact of child support grants over and above
their monetary value).This sector is crucially important in terms of the services it provides,
and also as an employer and as a contributor to the City’s overall growth.
In 2015 the government, community and personal services sector contributed 40.7
percent in Region 1, 32.0 percent in Region 2, 35.3 percent in Region 3, 31.4 percent in
Region 4, 26.8 percent in Region 5, 33.3 percent in Region 6 and 20.4 percent in Region
7. Region 1 is dominated by community services while Region 7 has the lowest GVA
contribution in this sector, lower contribution is positive, as economic growth in the area is
being generated by the private sector and reflects the re-distributive nature of government
spending.
Finance
The finance sector includes all financial intermediation, real estate, renting and
leasing, computer and related activities, research and development and a range of
‘”other” business service activities. When we compare all 7 seven regions in the City,
Region 4 outperforms all other regions with a GVA contribution of 30.7 percent followed
by Region 3 with 28.6 percent and Region 6 with 27.5 percent.
Transport and communication
The transport and communication sector is highly diverse, and includes land, water and
air transport as well as transport via pipeline, all auxiliary transport activities (such as travel
agents, logistics companies, etc.) and postal and telecommunications services. The
sector’s contribution to GVA is 11.4 percent in Tshwane, region 1 has the highest
contribution in terms of transport and communications with 13.3 percent followed by
region 2 with 12.7 percent. Region 7 had the lowest contribution in 2014 with just 9.3
percent increase. The City recently implemented the BRT system to enhance public
transport in the City. The BRT systems enhance bus efficiency through segregated bus
lanes, designs that make boarding and exiting buses quick, bus priority at intersections
and effective coordination at stations and terminals. According to the Department of
Transport (2015), the concept of a modern Bus Rapid Transit System (BRT) is critical to
the success of South Africa’s transport systems. Local transport cannot work if it does
not incorporate a good bus service that is accessible, affordable and attractive to a broad
range of people across society. This will increase the GVA contribution of the sector and
support households with lower disposable income as the cost of public transport drops.
The contribution of communication is expected to increase across the City due to the
implementation of Tshwane Free Wi-Fi. The City has successfully rolled out the first phase
of its free Wi-Fi project to residents and students in Tshwane at open public spaces in
line with its long-term plan to provide free Wi-Fi to all government educational institutions
in Tshwane by 2016, and to embrace digital technologies for the purposes of education
and economic upliftment. The roll-out of the second phase makes the City of Tshwane
the largest provider of free Wi-Fi in South Africa with capacity for 1 million users in public
spaces at 213 schools in Soshanguve, Mamelodi and Atteridgeville.
T S HWANE Capital Economic Outlook 2016 29You can also read