Georgia: Towards Green and Resilient Growth - ECA Sustainable Development Environment, Natural Resources & Blue Economy - Open ...
←
→
Page content transcription
If your browser does not render page correctly, please read the page content below
Public Disclosure Authorized
Public Disclosure Authorized
Public Disclosure Authorized
                               Georgia: Towards Green
Public Disclosure Authorized   and Resilient Growth
                               ECA Sustainable Development
                               Environment, Natural Resources & Blue Economy

                                                                November 2020
© 2020 The World Bank
1818 H Street NW, Washington DC 20433
Telephone: 202-473-1000; Internet: www.worldbank.org

Photo: amazing mountain landscape of Georgia on a sunny summer day. Alpine green meadow in the Caucasian
highlands. Idyllic valley in the Svaneti mountains.
Author: Dzmitrock
Georgia: Towards Green
 and Resilient Growth

          ECA Sustainable Development
  Environment, Natural Resources & Blue Economy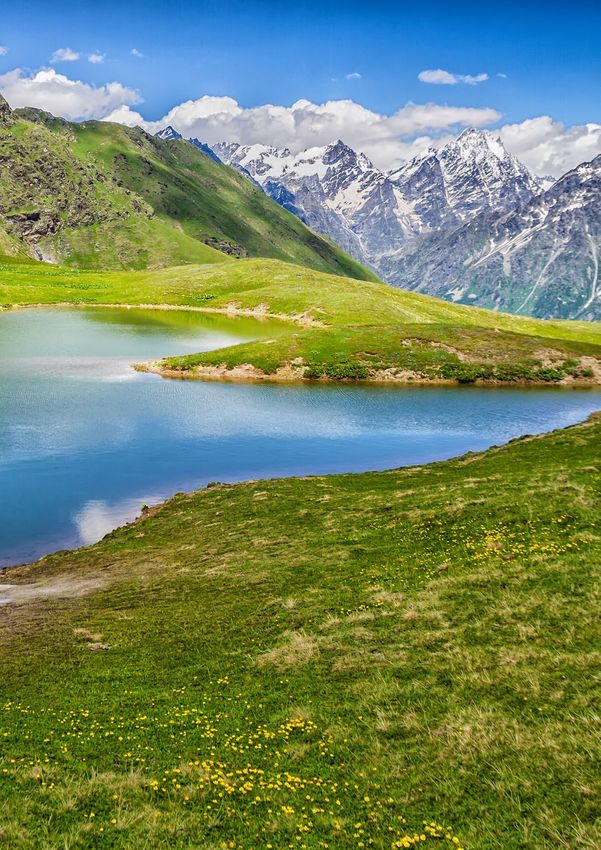
© 2020 The World Bank
1818 H Street NW, Washington DC 20433
Telephone: 202-473-1000; Internet: www.worldbank.org

Some rights reserved

This work is a product of the staff of The World Bank. The findings, interpretations, and conclusions expressed in
this work do not necessarily reflect the views of the Executive Directors of The World Bank or the governments
they represent. The World Bank does not guarantee the accuracy of the data included in this work. The boundaries,
colors, denominations, and other information shown on any map in this work do not imply any judgment on the
part of The World Bank concerning the legal status of any territory or the endorsement or acceptance of such
boundaries.

Rights and Permissions

The material in this work is subject to copyright. Because The World Bank encourages dissemination of its
knowledge, this work may be reproduced, in whole or in part, for noncommercial purposes as long as full
attribution to this work is given.

Attribution

Please cite the work as follows: “World Bank. 2020. Georgia: Towards Green and Resilient Growth. © World Bank.”

All queries on rights and licenses, including subsidiary rights, should be addressed to World Bank Publications,
The World Bank Group, 1818 H Street NW, Washington, DC 20433, USA; fax: 202-522-2625; e-mail: pubrights@
worldbank.org.
Georgia: Towards Green and Resilient Growth III
Contents
Acknowledgements��������������������������������������������������������������������������������������������������������������������������������������������V
Acronyms������������������������������������������������������������������������������������������������������������������������������������������������������������ VI
Executive Summary �������������������������������������������������������������������������������������������������������������������������������������� VIII
1. Introduction������������������������������������������������������������������������������������������������������������������������������������������������������ 2
1.1. Economic, Social and Environment Context �������������������������������������������������������������������������������������� 2
1.2. COVID-19 and Increased Uncertainty��������������������������������������������������������������������������������������������������6
1.3. This Report: Towards Green and Resilient Growth �������������������������������������������������������������������������� 7
2. The Cost of Environmental Degradation: Overview����������������������������������������������������������������������������������9
3.Land Degradation, Deforestation and Ecosystem Services���������������������������������������������������������������������12
3.1.1. On-site Land Degradation�����������������������������������������������������������������������������������������������������������13
3.1.2. Off-site Land Degradation ���������������������������������������������������������������������������������������������������������13
3.1.3. Deforestation and Ecosystem Services ���������������������������������������������������������������������������������� 14
3.2. Social Impact of Land Degradation ���������������������������������������������������������������������������������������������������15
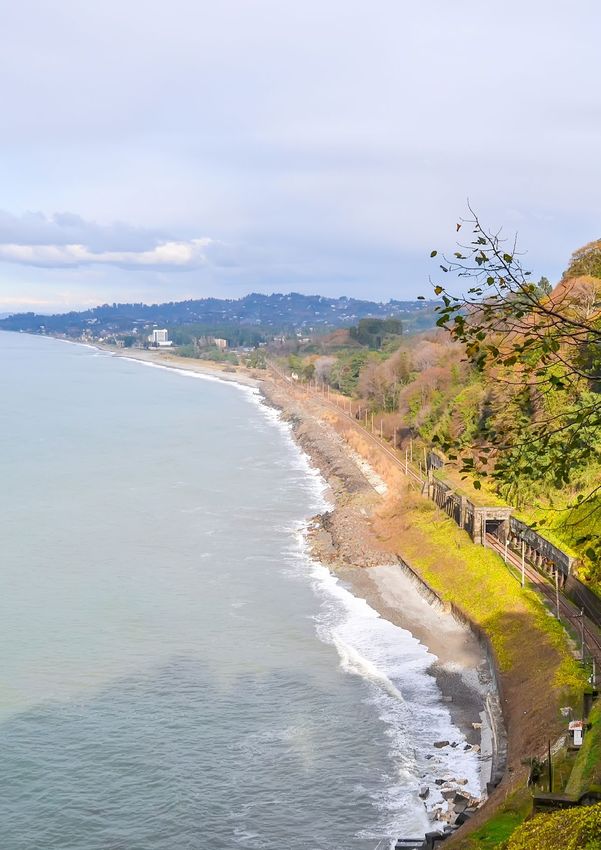
4. Coastal Zone Degradation ���������������������������������������������������������������������������������������������������������������������������17
5. Pollution ���������������������������������������������������������������������������������������������������������������������������������������������������������21
5.1. Air Pollution �������������������������������������������������������������������������������������������������������������������������������������������21
5.2. Exposure to Lead���������������������������������������������������������������������������������������������������������������������������������� 25
6. Government Response and Financing ������������������������������������������������������������������������������������������������������ 29
6.1. Current Legislation and Institutions ������������������������������������������������������������������������������������������������ 29
6.2. Implementation Efficiency ���������������������������������������������������������������������������������������������������������������� 32
6.3. Financing �������������������������������������������������������������������������������������������������������������������������������������������� 33
7.Enhancing Natural Capital: a Case-Study in the Forest Sector �������������������������������������������������������������� 36
8. The Way Forward������������������������������������������������������������������������������������������������������������������������������������������ 43
8.1. Sustainable Forest Management and Watershed Restoration���������������������������������������������������� 43
8.2. Reducing Coastal Vulnerability �������������������������������������������������������������������������������������������������������� 45
8.3. Pollution Reduction����������������������������������������������������������������������������������������������������������������������������46
8.4. Harnessing the Private Sector ���������������������������������������������������������������������������������������������������������� 47
8.5. Green Growth Strategy����������������������������������������������������������������������������������������������������������������������49
8.6. Sustainable COVID-19 Recovery������������������������������������������������������������������������������������������������������� 50
References���������������������������������������������������������������������������������������������������������������������������������������������������������� 52
Annexes�������������������������������������������������������������������������������������������������������������������������������������������������������������� 57
IV                                                                                             Georgia: Towards Green and Resilient Growth

List of figures
Figure 1.1      GDP Composition in Georgia (%, 2018) ���������������������������������������������������������������������������������������� 3
Figure 1.2 Natural Capital in Georgia�������������������������������������������������������������������������������������������������������������� 3
Figure 1.3 Sensitivity to Climate Change of Population Below the Poverty Line ������������������������������������ 4
Figure 1.4 Agricultural Productivity in Selected Former Soviet Union Countries (2000–2016) ������������ 5
Figure 1.5 Poverty Rate Trends in Georgia, 2008-2016 ��������������������������������������������������������������������������������6
Figure 3.1 Land Use in Georgia (% of land cover type in 2016) �������������������������������������������������������������������12
Figure 4.1 Coastal Zone in Georgia�����������������������������������������������������������������������������������������������������������������17
Figure 4.2 Estimated Cost of Environmental Degradation in the Coastal Zone ������������������������������������ 19
Figure 5.1 Annual Ambient PM2.5 Levels in Georgian Cities – International Comparison������������������� 22
Figure 5.2 Annual Mortality by Cause and Age Group Attributed to PM2.5 Concentration in 2018���� 23
Figure 5.3 Annual Mortality Due to PM2.5 Concentration – International Comparison���������������������� 23
Figure 5.4 Welfare Loss Associated with Exceedance of WHO Guideline
                in Selected Countries, 2018���������������������������������������������������������������������������������������������������������� 24
Figure 5.5 Blood Lead Level in Georgia, 2018������������������������������������������������������������������������������������������������ 26
Figure 5.6 The Annual Cost of Exposure to Lead (% GDP by the administrative region) ���������������������� 27
Figure 6.1 National Environmental Expenditures �������������������������������������������������������������������������������������� 33
Figure 6.2 Contribution to Environmental Expenditures from Development Partners������������������������ 34
Figure 7.1 Fiscal Impact of Sector Reforms (taxes and fees, 2019–2023)������������������������������������������������ 41

List of tables
Table 2.1       Estimated Annual CoED in Georgia (2012) ����������������������������������������������������������������������������������9
Table 2.2       Estimated Annual CoED in Georgia (2018) �������������������������������������������������������������������������������� 10
Table 5.1       Annual Welfare Loss of Ambient and Indoor Air Pollution Exceeding WHO Guideline������� 24
Table 5.2       Annual Impact of Lead Exposure ������������������������������������������������������������������������������������������������ 26
Table 6.1       Environmental Laws in Georgia in 2014-2020 ��������������������������������������������������������������������������30
Table 7.1       Forest Restoration by Method (1995-2017, ha)�������������������������������������������������������������������������� 38
Table 8.1       Target Areas and Synergies between Different Options��������������������������������������������������������� 50
Table 8.2       Options for Mainstreaming Sustainability into COVID-19 Recovery �������������������������������������51

List of boxes
Box 7.1         The ‘Social-Cut’ System in Georgia���������������������������������������������������������������������������������������������� 37
Box 7.2         Forest and Landscape Restoration Commitments in Georgia’s NDC������������������������������������39
Box 8.1         Blue Economy in the Black Sea Basin���������������������������������������������������������������������������������������� 46
Box 8.2         Public Policies and Private Sector Development: the Case of
                Sustainable Wood Energy ����������������������������������������������������������������������������������������������������������� 48
Georgia: Towards Green and Resilient Growth                                                                        V

Acknowledgements
This report was prepared by a World Bank team led by Tuukka Castrén (Senior Forest Specialist) and Elena
Strukova Golub (Senior Economist), and included Darejan Kapanadze (Senior Environmental Specialist), Adriana
Jordanova Damianova (Policy and Operations Consultant), Camilla Sophie Erencin (Economic Consultant),
Blerian Ania (Voice Secondee), Nato Alhazishvili (Budgeting and Public Expenditure Consultant) and Irakli
Kaviladze (Environmental Law and Regulations Consultant). The background paper on the Cost of Environmental
Degradation of the Coastal Zone used in this report is authored by Paola Agostini (Lead Natural Resources
Management Specialist), Darejan Kapanadze (Senior Environmental Specialist), Sergio Vallesi and Riccardo
Scarpa (Consultants). Administrative support to the team rendered by Grace Aguilar and Linh Van Nguyen is
gratefully acknowledged. Special thanks go to the following peer reviewers for their advice and comments that
enriched the analysis: Berengere Prince (Lead Natural Resources Management Specialist), Tijen Arin (Senior
Environmental Economist), Klas Sander (Senior Environmental Economist), Madhavi Pillar (Senior Natural
Resource Management Specialist), Craig Meisner (Senior Environmental Economist) and Giovanni Ruta (Senior
Environmental Economist). Advice and feedback from Abdulaziz Faghi (Program Leader), Steven N. Schonberger
(Regional Director), Thomas Farole (Lead Economist), and Dorota Nowak (Country Program Coordinator) are
gratefully acknowledged.

The team would like to thank Ms. Kseniya Lvovsky, Practice Manager, Environment, Natural Resources and
Blue Economy for the Europe and Central Asia Region, and Sebastian-A Molineus, Regional Director for South
Caucuses who provided valuable guidance to the team.

The team is grateful for the support, information and insights provided by officials of the Ministry of Environmental
Protection and Agriculture of Georgia, and all stakeholders in Georgia who participated in the consultations.
VI                                                           Georgia: Towards Green and Resilient Growth

Acronyms

 AAP        Ambient Air Pollution

 ADB        Asian Development Bank

 AFD        Agence Française de Développement

 AIIB       Asian Infrastructure Investment Bank

 BAU        Business as Usual

 BLL        Blood Lead Level

 BSEC       Black Sea Economic Cooperation

 CEA        Country Environmental Analysis

 CO2        Carbon Dioxide

 COPD       Chronic Obstructive Pulmonary Disease

 COVID-19   Coronavirus Disease 2019

 DPO        Development Policy Operation

 ECA        Europe and Central Asia

 EGD        European Green Deal

 EIA        Environmental Impact Assessment

 ENPI       European Neighborhood Partnership Instrument

 ESF        Environmental and Social Framework

 EU         European Union

 FDI        Foreign Direct Investment

 FLEG       Forest Law Enforcement and Governance

 FY         Fiscal Year

 GBD        Global Burden of Disease

 GDP        Gross Domestic Product

 GEL        Georgian Lari

 GFCM       General Fisheries Commission for Mediterranean

 GHG        Greenhouse Gas

 GP         Global Practice

 HAP        Household Air Pollution

 HPP        Hydropower Plant

 IHD        Ischemic Heart Disease

 IMF        International Monetary Fund

 IQ         Intelligence Quotient
Georgia: Towards Green and Resilient Growth                                 VII

 IUCN              International Union for Conservation of Nature

 KfW               Kreditanstalt für Wiederaufbau

 LRI               Lower Respiratory Infection

 MEPA              Ministry of Environmental Protection and Agriculture

 MW                Megawatts

 NDC               Nationally Determined Contributions

 NEA               National Environmental Agency

 NEAP-3            Third National Environmental Action Program

 NFA               National Forest Agency

 NFC               National Forest Concept

 NGO               Non-Governmental Organization

 NO2               Nitrogen Oxide

 NTFP              Non-Timber Forest Product

 O3                Ozone

 OECD              Organization for Economic Cooperation and Development

 PAF               Population Attributable Fraction

 PM                Particulate Matter

 PM2.5             Particulate Matter with a diameter of less than 2.5 μm

 PM10              Particulate Matter with a diameter of less than 10 μm

 PPP               Purchasing Power Parity

 RR                Relative Risk

 SCD               Systematic Country Diagnostic

 SME               Small and Medium Enterprises

 SO2               Sulfur Dioxide

 TA                Technical Assistance

 TDM               Tons of Dry Matter

 TEEB              The Economics of Ecosystems and Biodiversity

 USDA              United States Department of Agriculture

 US$               United States Dollar

 VSL               Value of Statistical Life

 WHO               World Health Organization

 WTP               Willingness-to-pay

 WWF               World Wildlife Fund

 μg/m3             Microgram per Cubic Meter
VIII                                                                          Georgia: Towards Green and Resilient Growth

Executive Summary
Background and Context

Georgia has made remarkable progress in terms of economic growth and poverty alleviation. Over the
past 20 years, the country posted an impressive 5.4 percent growth in annual gross domestic product (GDP),
with the tourism sector booming. In 2019, the country became an upper middle-income country. Poverty has
declined overall, and a combination of new economic opportunities and favorable social policies has spurred
welfare improvements. Yet, challenges persist as poverty and inequality remain high, especially in rural areas.
The COVID-19 induced global recession has affected important sectors of the economy, including tourism and the
travel industry. Real GDP growth is projected to drop sharply in 2020 in this challenging external environment.

Georgia’s endowment of natural resources is a significant source of national wealth and has the
potential for accelerating inclusive socio-economic development. This report fills knowledge gaps in the
upstream importance of environment and natural assets, and highlights areas for aligning national strategies
with sustainable recovery from the COVID-19 pandemic. In so doing, the report aims to inform national policies
by which Georgia has commitments to “greening” sector developments aligned with the provisions of the EU–
Georgia Association Agreement. The analysis underlying the report includes updates to the cost of environmental
degradation (CoED) published in 2015.1 It also reflects the new government priorities and options for addressing
specific challenges in forest management, land and coastal degradation, and air pollution. The recommendations
of this report are designed for a wider audience, including the Government of Georgia, as well as development
partners and broader society.

Cost of Environmental Degradation

The analysis of the CoED points to trends of unsustainable resource use in Georgia. The updated CoED
on agriculture and forest land, air quality, lead exposure, and Georgia’s coastal zone indicates negative effects
on the country’s economy,2 with costs that include both direct costs and the lost economic opportunities from
compromised future resource production potential. Land degradation leads to lower agricultural productivity
and reduced potential for hydropower generation. The welfare losses associated with air pollution and lead
exposure reduce human capital and negatively affect economic growth. The CoED results highlight the need for
course-correction to address the systemic challenges of the depreciation of natural assets, while mitigating the
socio-economic impacts of COVID-19.

1
    World Bank. 2015. “Georgia – Country environmental analysis: institutional, economic, and poverty aspects of Georgia’s
    road to environmental sustainability (English).” Washington D.C.: The World Bank.
2
    The annual CoED are measured in terms of percentages of GDP in 2018 to provide an “order of magnitude” information.
    The CoED estimates of impact areas cannot be added or compared directly, because of differences in methodological
    approaches and data availability.
Georgia: Towards Green and Resilient Growth IX
Estimated Annual CoED in Georgia (2018)3
Estimated of national GDP
Impact area
Annual Cost in 2018
– US$ million – –%–
Land Degradation
- agricultural land 111 0.6
Loss in agricultural productivity (croplands and pastures), loss
of irrigated lands, sedimentation of hydroelectric power plant
reservoirs, measured as productivity loss
- forestland 16 0.1
Loss in forest ecosystem services, applying forest values from the
study in the Adjara region
Pollution
- ambient air pollution 180 1.0
Impact of ambient air pollution (PM2.5) in exceedance of the World
Health Organization’s guideline on health, valued with welfare loss
methodology
- household air pollution 380 2.2
Impact of household air pollution (PM2.5) on health, valued with
welfare loss methodology
- lead exposure 530 3.0
Loss in cognitive ability in children, valued with the loss of lifetime
income
of coastal GDP in
2018
–%–
Coastal Zone Degradation4
- fluvial flooding 56 2.8
Damage to assets and economic productivity, valued with benefit
transfer
- coastal flooding 27 1.4
Damage to assets and economic productivity, valued with benefit
transfer
- coastal erosion 7 0.4
Damage to infrastructures, residential houses, tourism and other
businesses, due to severe waves, storms and sea surges, valued at
restoration cost
- waste 3 0.2
Damage due to uncollected municipal waste, damage due to
inappropriate disposal of municipal waste, valued at the annual loss
of property values
- land degradation 4 0.2
Loss of agricultural productivity and forest ecosystem services in the
coastal zone
n4
3
All currency amounts in this report are given in US Dollars, unless otherwise stated.
4
The estimates are based on World Bank. 2020d. “The Cost of Coastal Zone Degradation in the Country of Georgia. A tool
for the Coastal Zone Climate Adaptation Plan and the Nationally Determined Contributions.” Background technical
paper. Forthcoming. Washington DC: The World Bank.
GDP percentage estimates for the coastal zone are adjusted to 2018 using a different methodology. Therefore, percentage
estimates may differ from the World Bank technical background paper (World Bank. 2020d).X Georgia: Towards Green and Resilient Growth
The direct economic impact of land degradation is estimated at 0.7 percent of national GDP in 2018,
which emphasizes the importance of mitigation actions. Agriculture and forest-based economic activities
generate 7 percent of the country’s GDP, while providing 39 percent of total employment in 2018.5 A high
level of land degradation is caused by the absence of an integrated approach, extensive land use and a lack of
investments. The adverse effects of this impact both land and water users, and the biophysical conditions of
landscapes, resulting in stagnant agricultural productivity, which is lower in Georgia than in any other country of
the former Soviet Union.6 The annual cost of land degradation reduced agricultural GDP by 8 percent in 2018; it is
estimated that the poverty gap for the population in the lowest income quintile would narrow by six percentage
points if landscapes were to be restored in Georgia.
Coastal ecosystems that are important for the tourism sector have been affected by substantial
environmental degradation. The economic cost of degradation in the eight coastal municipalities of Georgia
is equivalent to 5 percent of the GDP produced in the coastal zone in 2018. The high economic cost of coastal
degradation is associated with floods, pollution, loss of physical assets (including buildings, and transport and
hospitality infrastructure) and damage to critical ecosystems (including beaches, forests, and river deltas). People
residing on the coast are directly affected by coastal degradation that erodes land and agricultural topsoil, and
damages dwellings and commercial buildings. Climate change and the increased variability of coastal weather,
characterized by rising sea levels and more frequent and violent storms, exacerbate such impacts.
Solutions to air pollution will be particularly critical as life returns to its normal course in the post-pandemic
economy. Georgia has a chance to chart a different course in reducing air pollution, which continues to have significant
impacts on human health. The annual mortality attributable to ambient and indoor air pollution in 2018 is estimated
at about 4,000 people, corresponding to a welfare loss of US$560 million,7 an equivalent of 3 percent of national GDP
in 2018. Annual average concentrations of fine particulate matter (PM2.5) are higher than those considered safe for
human health. Emissions from transportation, and dust from construction and other fugitive sources pollute ambient
air in cities. People in rural areas continue to burn polluting fuels in their homes for cooking and heating. Exposure is
particularly high among women, young children, and the elderly, who spend the most time indoors.
More attention is needed to understand the causes of lead contamination and act to address them.
Based on one study available on the lead content in children, the economic cost of lead exposure could be as high
as 3% of the national GDP. Lead has several health impacts, but a particularly significant one is reduced cognitive
ability in children. Cognitive ability loss leads to reduced productivity and has long-term consequences for those
affected. Given that Georgia banned the use of leaded gasoline in 2000, possible current sources of lead pollution
and the persistence of children’s exposure to legacy pollution need to be further understood in order to develop
an effective strategy of impact mitigation.
Climate change impacts in Georgia are seen in temperature increase and reduction of precipitation,
with significant variability from year to year. The risk to the population’s wellbeing from climate change is
estimated at an equivalent of 1.5-6.6 percent of Georgia’s national GDP.8 The likelihood of severe droughts will
increase, particularly for the central areas of the country. Frequent occurrences of extreme weather will result
in increased landslides, floods, avalanches, and mudflows that will affect agriculture, water resources, forests,
coastal areas, public health and infrastructure. The southern and eastern regions are the areas expected to be
hardest hit by high temperatures and prolonged heat waves. The rural population is most affected in the areas
where climate change impacts further increase the costs of environmental and natural resource degradation.
5
Geostat. 2020c. “Employment and Unemployment.” https://www.geostat.ge/en/modules/categories/38/employment-
and-unemployment. (accessed on August 19, 2020).
6
USDA. 2019. “International Agricultural Productivity.” https://www.ers.usda.gov/data-products/international-
agricultural-productivity/.
7
The economic cost of ambient and indoor air pollution reflects health impacts from exceeding World Health Organization
(WHO) guidelines for fine particles (PM2.5).
8
Hallegatte, S., A. Vogt-Schilb, M. Bangalore, and J. Rozenberg. 2017. “Unbreakable: Building the Resilience of the Poor in
the Face of Natural Disasters”. Climate Change and Development Series. Washington DC: The World Bank.Georgia: Towards Green and Resilient Growth XI
The Way Forward
Georgia has made significant progress in updating and reforming its national environmental legislation.
However, more policy improvements will be needed to support increased investments and institutional
development, including for “effective adaption and implementation of key environmental legislation”.9 The
effective enforcement of environmental laws requires supporting regulations and norms, as well as enhanced
implementation capacity and clear institutional mandates, primarily from the Ministry of Environmental
Protection and Agriculture (MEPA). Furthermore, increased technical and financial capacities of the public
and private sectors for adherence to environmental regulations is needed. Some aspects of environmental
management have benefited from financial support from state and local authorities as well as from international
development partners, the latter estimated at 39-47 percent of total environmental expenditures at the national
level. Most of these funds were allocated for solid waste management. Other sectors responsible for most of the
annual CoED received less attention from international and bilateral donors, as preliminary analysis suggests.
Putting Georgia on the path of sustainable and greener development will require a targeted mix of enabling
policies, incentives, and public investments. These are needed both to address the structural challenges in the
Georgian economy and to support post-COVID-19 recovery. The CoED analysis indicates a loss of economic activity
and potential fiscal revenue that can be avoided by addressing market failures and strengthening natural resource
management policies and practices. The study focuses on four areas where public actions could reduce bottlenecks
and mitigate the pressure on resources while contributing to green growth transition:
1. Strengthening forest and landscape management;
2. Sustainable development of the coastal zone;
3. Pollution management; and
4. Building a multisectoral approach to sustainable development, engaging the private sector and green
recovery from COVID-19 pandemic.
Government programs for forest and landscape management could target mutually reinforcing and
complementary interventions, including institutional development and watershed restoration. Firstly,
the support to national and local forest institutions, forest management, forest-base livelihoods, and sector
reform at national level will have to enable the implementation of the newly adopted Forest Code (May 2020).
Secondly, these programs need to facilitate geographically more targeted interventions for the rehabilitation
and improved management of degraded watersheds, particularly in the eastern parts of the country. Addressing
environmental degradation, especially in lagging regions, would improve socio-economic opportunities and
development outcomes. Support for rehabilitation and improved management of degraded watersheds would
require investments in land management, landscape restoration, management capacity and small-scale
infrastructure to improve the environmental services provided by the region’s watersheds.
To reduce impacts of natural hazards and minimize economic losses, coastal zone development plans need
to focus on the diverse environmental issues of Georgia’s Black Sea coast. The allocation of Government
resources needs to be consistent with climate change adaptation and planning priorities for coastal Georgia, with a
focus on reducing the impacts of extreme weather events. This should include hazard identification, risk assessment
and analysis, and the development of modern prevention and monitoring systems. A “climate resilient” coastal zone
development program would consist of targeted investments that would support flood and other natural hazard
management and mitigation, prevention of coastal erosion, landscape restoration and waste management. The
key reference point for designing such investment programs would be the National Action Plan for climate change
adaptation in coastal areas, developed with assistance from the Nationally Defined Contribution Support Facility
(NDC SF).10 The estimated investment needs of the coastal area adaptation program are about US$600 million.
9
World Bank. 2020a. “Analysis of Gaps between National Legislation of Georgia and World Bank Environmental and Social
Framework.” Washington DC: The World Bank.
10
NDC SF grant administered by the World Bank.XII Georgia: Towards Green and Resilient Growth
Addressing air pollution and reducing lead exposure could improve human health and generate economic
gains. Air pollution contributes to multiple negative health impacts, including ischemic heart diseases and
stroke. Lead exposure has a detrimental impact on the cognitive abilities of children. By supporting a major survey
to identify blood led level in children, Georgia has taken an important step towards improving the monitoring of
ambient air pollution (AAP) and identifying hazards from lead exposure. The next steps are to establish major
sources of pollution, separately for each contaminated zone; develop locally specific short-, medium-, and long-
term measures to reduce pollution; and adopt policy and institutional reforms to align pollution levels with
internationally accepted standards. As most institutions are sector-based, policies and institutional reforms
should enhance cross-sectoral capacities and measures, while investments to control pollution must be based
on an inclusive and cross-sectoral strategy.
Georgia can enhance productivity-led growth based on the sustainable use of natural resources,
strengthened environmental management and inclusiveness. Growth in Georgia is not fully inclusive,
and poor rural communities do not enjoy its benefits in the same way as the urban population. A large part
of the population is involved in low-productivity agriculture: 39 percent of total employment is in agriculture
though only 8 percent of GDP stems from agriculture, forestry and fishery.11 Tourism employed around 150,000
people in 2019, contributing about 7 percent of national GDP12 but is also one of the sectors most affected by
the global COVID-19 pandemic. Nature-based tourism depends on sustainable natural resource and landscape
management. Likewise, coastal tourism in Georgia depends on maintaining the essential ecological functions of
the Black Sea and coastal areas.
Georgia will benefit from developing a “Green Growth Development Policy” that is climate-resilient and
based on sustainable natural resource use, high productivity, and the circular economy. The government
of Georgia has an ambitious yet incomplete environmental agenda. On the one hand, a “whole-of-government”
approach to sustainability would focus on low carbon development that creates jobs and provides co-benefits
in reducing waste and pollution, congestion, and improving health outcomes. On the other hand, the approach
would be aimed at protecting biodiversity and ecosystem services to sustain the natural resource base of the
economy. It would need to cover traditionally relevant “environmental” sectors (e.g. nature protection, pollution
management, landscape and natural resource management), as well as all aspects of public policy (e.g. taxation
and subsidies, public procurement, infrastructure design and business development). The private sector plays
an essential role in employment generation, and it is essential that a well-managed environment and reduced
degradation are recognized as essential elements for a conducive business environment. This does not apply only
to “green” natural resource-based businesses, but to all economic sectors.
The COVID-19 pandemic reinforced the importance of reducing the vulnerability of the population and
economy and facilitating sustainable recovery. Initially, Georgia handled the spread of the virus well, yet
its economy is significantly affected by the impacts of lockdown, global demand shocks and travel restrictions.
The pandemic is not over to fully assess its impacts. The International Monetary Fund (IMF) estimates that
Georgia’s real GDP growth will fall by 4 percent by end of 2020 before seeing a recovery of 3 percent in 2021.13
During the economic downturn, Georgia adopted a national anti-crisis package focusing on social support
(US$330 million), stimulating economic growth (US$680 million) and strengthening the healthcare system
(US$110 million) to fight the pandemic. Yet, beyond this direct post-pandemic crisis response, all nature-based
sectors may benefit from initiating a transformational green recovery and adapting to the challenge of climate
change. Environmental risks remain a substantial concern, with persistently problematic areas of the country
where environmental degradation has reached unsustainable levels. After COVID-19, economic growth could
resume and even accelerate by preserving and enhancing the country’s natural capital. Georgia is well positioned
to establish a foundation for growing back greener by rebooting its economy for sustainable future.
11
Geostat. 2020c.
12
Geostat. 2020c.
13
IMF. 2020. “Georgia.” https://www.imf.org/en/Countries/GEO (accessed on August 28, 2020).Koruldi Lakes in the Caucasus, Georgia Author: Milosz Maslanka
2 Georgia: Towards Green and Resilient Growth
1. Introduction
1.1. Economic, Social and Environment Context
Georgia has made impressive strides in economic growth and poverty alleviation. Over the past 20 years, Georgia’s
economy grew at an average of 5.4 percent of GDP annually, with foreign investment and domestic demand both
playing a prominent role. Georgia transitioned from a lower-middle income country to an upper-middle income
country in 2019.14 Thanks to bold policy reforms, Georgia has one of the lowest corruption levels in the Europe
and Central Asia (ECA) region.15 Improvements in public service delivery and the business climate have attracted
significant amounts of foreign direct investment (FDI), spurring growth and positive net job creation.16 Poverty
has declined, with over half a million Georgians leaving poverty between 2010 and 2015. However, rural poverty
remains higher than in urban areas and many people in rural areas remain vulnerable to adverse developments,
like the current COVID-19 pandemic.
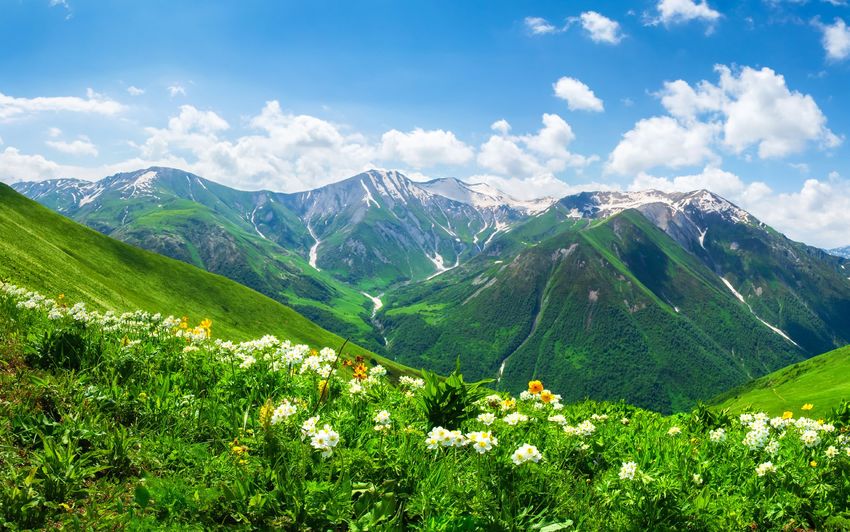
Georgia is endowed with natural resources, including vast forests, a beautiful coastline, majestic mountainous
landscapes, and abundant water resources. Georgia has many different climate zones, from humid sub-tropical
climate to permanent snow and glaciers zone. About 40 percent of Georgia’s land is forested and another 30
percent covered by pastures and mosaic landscapes. The country has exceptionally rich and diverse flora and
fauna. Many economic sectors depend on these resources which, if sustainably managed, can form the basis of
a green and prosperous Georgia.
Currently, the service sector, including tourism, is the engine of economic development in Georgia (Figure 1.1).
Tourism is a fast-growing sector and contributes 7 percent of GDP. However, tourism-driven development is still
fragmented and incomplete, and other branches of the economy like agriculture and renewable energy, that
could be connected to tourism activities, do not enjoy the same level of growth. Tourism expansion is vulnerable
to potential demand shocks – like the travel disruptions caused by the COVID-19 pandemic, and global recessions.
Economic growth in Georgia is not fully inclusive and poor rural communities do not enjoy its benefits in the
same way as the urban population. A large part of the population is involved in low productivity agriculture:
39 percent of all employed are in agriculture, although only 8 percent of GDP is generated through agriculture,
forestry and fishery; 8 percent are employed in industry, with 11 percent of GDP created in manufacturing; and 6
percent in construction, which accounts for 9 percent of GDP).
14
See the World bank historical classification of countries by income at https://datahelpdesk.worldbank.org/
knowledgebase/articles/906519-world-bank-country-and-lending-groups.
15
Transparency International. 2020. “CPI 2019: Eastern Europe & Central Asia.” https://www.transparency.org/en/news/
cpi-2019-eastern-europe-central-asia#.
16
World Bank. 2018b. “Georgia – Country partnership framework for the period FY19-FY22 (English).” Washington
DC: The World Bank. https://documents.worldbank.org/en/publication/documents-reports/documentdeta
il/588751525364587100/undefined.Georgia: Towards Green and Resilient Growth 3
Figure 1.1 GDP Composition in Georgia (%, 2018)
Agriculture, hunting and forestry; fishing
8%
1% Manufacturing
11 % Processing of products by households
Hotels and restaurants
3%
2% Other services
55 %
9% Mining and quarrying
Electricity, gas and water supply
3%
8% Construction
Transport
Source: Geostat. 2020a.
Natural capital is declining in Georgia – a trend which is most clearly seen in the natural resource-based sectors.
Natural resources, which form the backbone of the Georgian economy, posted a decline of 8 percent in constant
value between 1995 and 2014 (Figure 1.2).17 Despite leaving out many vital services provided by nature - like air and
water filtration, flood protection, carbon storage, pollination for crops, and the provision of habitats for fisheries
and wildlife - the National Wealth Accounting confirms a declining trend in Georgia’s natural capital. Most of this
devaluation originates from a sharp drop or stagnant productivity in croplands and pasturelands.
Figure 1.2 Natural Capital in Georgia
45 000
40 000
constant 2014 US$, millions
35 000
30 000
25 000
20 000
15 000
10 000
5 000
0
1995 2000 2005 2010 2014
Forests Protected areas Cropland
Pastureland Fossil fuel energy Minerals
Source: World Bank. 2020b.
17
Lange, G., Q. Wodon, and K. Carey. 2018. “The Changing Wealth of Nations 2018: Building a Sustainable Future”.
Washington DC: The World Bank.4 Georgia: Towards Green and Resilient Growth
Georgia is vulnerable to climate change, observed in the increased intensity and frequency of extreme weather
events. Climate change is projected to increase temperatures by the end of the century and water availability is
expected to diminish across Georgia. Under a high-emission scenario, projections show a likely increase of monthly
temperatures of 4.5oC for the 2080–2099 period, with a possible increase of over 7oC by 2099 in Tbilisi and Telavi,18
and in the key agricultural areas of Imereti, Kvemo Kartli and South Georgia.19 Additionally, both the quantities and
the distribution of precipitation are projected to change. While on average a reduction in precipitation is expected for
Georgia (monthly precipitation is projected to decrease steadily by 1.3mm per month from 2040-2059), some areas
may also experience flooding due to increased intensity of rainfall, especially in the coastal areas (including Batumi
and Sokhumi), the low-lying areas in the center of the country (including Kutaisi and Gori), and in key river basins.
Projected temperature increases and reduction of precipitation will impact Georgia’s agrarian, forestry, and water
sectors, and the poor population will be affected most. The likelihood of severe drought will increase particularly for
the central areas of the country.20 According to the third National Communication to the United Nations Framework
Convention on Climate Change (2015),21 the intensification of extreme weather events will result in increased
landslides, floods, avalanches, and mudflows, with adverse impacts on agriculture, water resources, forests, coastal
areas, public health, and infrastructure. Risks to the wellbeing of the population caused by climate change are
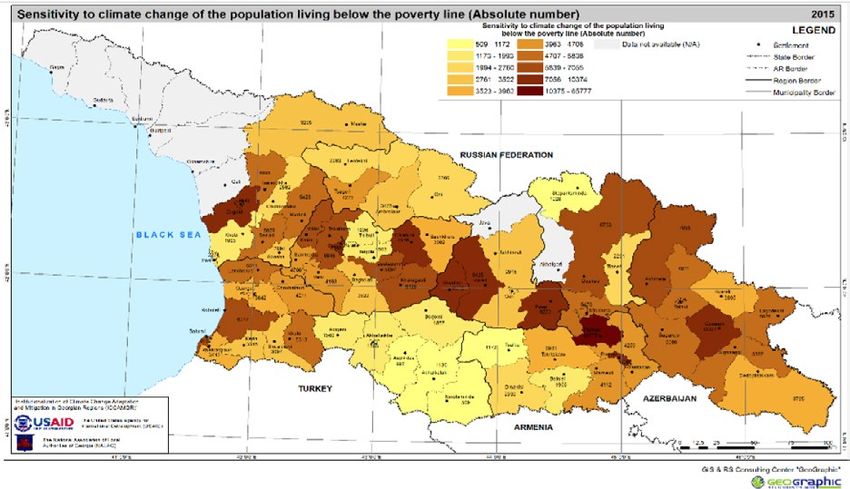
estimated at a level equivalent to 1.5–6.6 percent of GDP. 22 Figure 1.3 maps the sensitivity to climate change of the
population below the poverty line in different municipalities in Georgia. People living below the poverty line will be
hardest hit by climate change in central Georgia and in the Northeast (see dark brown areas in Figure 1.3).
Figure 1.3 Sensitivity to Climate Change of Population Below the Poverty Line
Source: As appears in USAID. 2016.
18
Elizabarashvili, M. et al. “Georgian climate change under global warming conditions.” Annals of Agrarian Science, 15(1): 17-25.
19
ENVSEC. 2016. “Climate Change and Security in the South Caucasus. Republic of Armenia, Azerbaijan and Georgia-
Regional Assessment.”
20
Ministry of Environment and Natural Resources Protection of Georgia. 2015. “Georgia’s Third National Communication to
the UNFCCC.”
21
Ministry of Environment and Natural Resources Protection of Georgia. 2015.
22
Hallegatte, S., A. Vogt-Schilb, M. Bangalore, and J. Rozenberg. 2017. “Unbreakable: Building the Resilience of the Poor
in the Face of Natural Disasters”. Climate Change and Development Series. Washington DC: The World Bank. http://
documents.worldbank.org/curated/en/512241480487839624/Unbreakable-building-the-resilience-of-the-poor-in-the-
face-of-natural-disasters.Georgia: Towards Green and Resilient Growth 5
Changes in the quality and stock of natural capital explains the low labor productivity in agriculture, forestry
and fishery (Figure 1.4). A large part of the Georgian population is involved in low productivity agriculture: 39
percent of all Georgians employed are in agriculture, while only 8 percent of GDP is generated by agriculture,
forestry and fishery combined. Based on the estimates of the United States Department of Agriculture (USDA),
agricultural productivity23 in Georgia is lower than in any other of the former Soviet Union countries. It is 20-30
times lower than in the EU-member countries Estonia, Lithuania and Latvia, 10-20 times lower than in Belarus,
Russia and Ukraine, and 2-4 times lower than in Armenia and Azerbaijan. Consequently, Georgia has not been
able to increase overall economic productivity relative to other countries.
Figure 1.4 Agricultural Productivity in Selected Former Soviet Union Countries (2000–2016)
18
2006-2008 Constant US$/hectare ‘000
16
14
12
10
8
6
4
2
0
2000 2002 2004 2006 2008 2010 2012 2014 2016
Latvia Armenia Azerbaijan Georgia Belarus Ukraine
Source: USDA. 2019.
Despite Georgia’s impressive economic growth, the country’s population remains vulnerable to economic, social
and environmental shocks. Substantial reductions in poverty have been achieved since 2010 (Figure 1.5), but a
significant share of households may fall back into poverty as a consequence of the COVID-19-induced economic
crisis. Existing income inequality is influenced by regional disparities: according to World Bank calculations,
poverty rates were 11 percent in Tbilisi in 2016, compared with 13 percent in other cities and slightly more than
20 percent in rural areas, where most workers are concentrated in low-productivity agricultural and informal
activities. Persisting rural poverty contributes to the negative demographic trend and a declining rural
population.24
23
Measured as agricultural output in constant 2004-2006 US$ per one employed in agriculture
24
Geostat. 2020. “Population and Demographics.” https://www.geostat.ge/ka/modules/categories/316/mosakhleoba-da-
demografia6 Georgia: Towards Green and Resilient Growth
Figure 1.5 Poverty Rate Trends in Georgia, 2008-2016
Proverty rate (percent of population)
40
35
30
25
20
15
10
5
0
2008 2009 2010 2011 2012 2013 2014 2015 2016
Georgia Tbilisi Other urban Rural
Source: As appears in World Bank. 2019b.
1.2. COVID-19 and Increased Uncertainty
The global outbreak of the coronavirus in February 2020 threatens to reverse past gains in economic development
and poverty reduction in Georgia. The official reaction to the pandemic has been swift and comprehensive. A
nationwide State of Emergency was declared on March 21, 2020, and robust measures put in place to contain
the health risks, protect livelihoods, and set the stage for economic recovery. Efforts to mitigate the economic
and social impacts of the crisis included the expansion of social transfers and other temporary relief measures
for businesses and households. The Government’s proactive response comes at significant fiscal and economic
costs, that also need to be managed. The containment measures, while successful in slowing the spread of the
virus, are causing declines in both consumption and investment. The global nature of the pandemic also means
that remittances and the external demand for goods and services, including tourism, have taken a hit.
Georgia’s economy is gradually recovering from the first COVID-19 shock, but the pandemic is not over to fully
assess its impacts. Georgia adopted a national anti-crisis package focusing on social support (US$330 million),
stimulating economic growth (US$680 million) and strengthening the healthcare system (US$110 million) to fight
the pandemic. Supported by accelerated government spending, robust credit growth and higher remittances,
partially offsetting the impact of the remaining restrictions on mobility and economic activity, the economy
contracted at a slower pace (7.7 percent) in June, 2020, compared with May, 2020 (13.5 percent).25 Nevertheless,
the IMF estimated Georgia’s real GDP growth would decline by 4 percent by the end of 2020 before a recovery in
2021.26
25
Word Bank. 2020c. “Georgia Monthly Economic Update – August 2020.” http://pubdocs.worldbank.org/
en/317821597419426483/GE-MEU-August-2020.pdf (accessed on August 25, 2020).
26
IMF. 2020. “Georgia.” https://www.imf.org/en/Countries/GEO (accessed on August 28, 2020).Georgia: Towards Green and Resilient Growth 7
Poverty has been falling in the last decade, but is projected to increase in 2020, as a result of the COVID-19
crisis. Increased vulnerabilities associated with the effects of the pandemic caused massive job losses and
unemployment among unskilled labor. Lower income Georgians are more prone to health shocks due to their
relatively poor access to healthcare and lower savings against economic crisis. The pandemic and the associated
travel disruptions adversely impact the tourism industry, which contributed 7 percent to national GDP in 2018.
Other sectors of the natural-resource-based economy in Georgia - like forestry - are still relatively detached
from global value chains and will likely be less impacted by the global downturn. However, unemployment and
increased poverty rates may bring people back to subsistence farming, leading to an expansion of the agriculture
frontier and increased forest degradation.
Economic recovery measures present an opportunity for Georgia to “grow back better and greener”, in alignment
with the EU approximation policies and the European Green Deal (EGD). Economic policies which address
immediate shocks and ensure a sustainable development of the country compatible with the EU long-term
strategy for the EGD, could be prioritized. The Government’s focus on the EU–Georgia Association Agreement
provides new opportunities to advance sustainability goals and access potential financial sources. EU member
states also recognize green transition as a key element of strategies for recovery from the current crisis.27
1.3. This Report: Towards Green and Resilient Growth
This report builds on and updates the 2015 Country Environmental Analysis (CEA). It provides new and updated
analysis on the costs of environmental degradation (CoED) while discussing government priorities and resource
allocation to facilitate greener economic recovery and sustainable growth. The evidence on the CoED presented
in the report could be used as a baseline for further actions to address the pandemic and its impact. At the same
time, many of the recommendations are actions that may be undertaken regardless of COVID-19, with a focus
on environmental sustainability as a “no regrets” approach in an ongoing crisis where the full impact is still not
fully known. The analysis identifies potential areas of improvement of current policies, strategies, and financing
to address environmental challenges, aligned with the priorities of the government of Georgia, the EU–Georgia
Association Agreement and Georgia’s global commitments.
This report is not intended to be a full CEA, but rather a policy note to update the CoED, recent policy/legal
changes and some policy recommendations. It builds on a partial analysis of the costs, on an assessment
of gaps in ESF implementation, and on recent analytical work in the forest sector and on the development of
coastal areas. Based on these, the report provides some broad policy recommendations for dialogue within the
Government and between the Government and its development partners. It does not amount to a full extended
core diagnostic for Georgia.
The report comprises eight chapters. The introduction outlines the basic country parameters and challenges
concerning Georgia’s natural capital, while considering impacts of the COVID-19 crisis. Chapter 2 provides an
overview of the CoED and summarizes key findings of this report. Chapters 3 to 5 discuss the methodology
and results of the updated CoED analysis, which focuses on land and ecosystems, coastal zone, and pollution.
Chapter 6 reviews Georgia’s policy and institutional framework. Chapter 7 provides a deep dive into enhancing
natural capital in the forest sector, and Chapter 8 outlines the way forward and key actions that Georgia might
take to grow back better and greener.
27
Bloomberg Law. 2020. “Green Focus Pledged for the European Union’s Virus Recovery Plan.” https://news.bloomberglaw.
com/environment-and-energy/green-focus-pledged-for-the-european-unions-virus-recovery-plan?context=article-
related (accessed on August 4, 2020).Katskhi Pillar. Sightseeing in Georgia. Monastery near village Katskhi. Imereti, Georgia. A Georgian Meteora. Author: Andrei Bortnikau
Georgia: Towards Green and Resilient Growth 9
2. The Cost of Environmental Degradation: Overview
The Georgia Country Environmental Analysis (CEA) of 201528 provided an overall assessment on CoED and
recommendations on cross-sectoral interventions. The 2015 CEA integrated economic development with
environmental and social factors to foster an understanding of unsustainable patterns of economic development in
Georgia and the effects of environmental degradation on growth. The CEA estimated the CoED of selected impact
areas, including human health effects from air pollution, exposure to lead, land degradation and deforestation, loss
of amenities as a result of untreated solid waste, and natural disasters for 2012 (Table 2.1).29 The annual cost of air
pollution and lead exposure were the major contributors to the total estimate, reflecting the urgency of mitigation
measures in these areas. The monitoring data and analysis methods used in the CEA 2015 had several limitations. For
example, no continuous monitoring data of ambient air pollution (AAP) was available, there were no estimations of the
agricultural production loss attributable to soil erosion, and there was no information on ecosystem value losses due to
forest degradation. Given these limitations, the CoED provides range estimates (low and high) rather the precise costs.
Table 2.1 Estimated Annual CoED in Georgia (2012)
Estimated Annual Cost, Share of GDP in 201230
Sector
- US$ million - -%-
Low High Low High
Ambient air pollution 280 820 1.8 5.2
Household air pollution 200 580 1.3 3.7
Lead exposure 150 220 0.9 1.4
Cropland and pastureland degradation 150 190 0.9 1.2
Solid waste 57 64 0.3 0.4
Natural disasters 20 120 0.2 0.7
Deforestation 20 30 0.1 0.2
30
Source: World Bank. 2015.
Aiming to address natural resource degradation, the Government of Georgia has since 2014 strengthened
the monitoring of environmental pollution and environmental and natural resource statistics collection and
reporting.31 Eight continuous air pollution monitoring stations have been installed in major cities. In 2016, with EU
support, Georgia started to monitor water quality in the Black Sea. Soil quality monitoring resumed in 2013 and
soil samples of about 30 settlements are analyzed in 2017 for heavy metals content. In 2017, the Emerald Network
of protected areas was established to preserve biodiversity and critical habitats; by December 2019, the Network
covered about 1 million ha in Georgia. A methodology was developed for a National Forest Inventory: field work
started in 2018 and is expected to be completed in 2021. The number of hydrometeorological observation points
increased by 43 units to 137 observation points after 2014. The availability of monitoring data helped to improve
the accuracy of the CoED estimates in this report, as compared to the CEA from 2015; however, methodological
improvements make a direct comparison to CoED estimates of the CEA 2015 difficult.
Table 2.2 presents a summary of new estimates. The updated CoED on agriculture and forest land, air quality,
lead exposure, and Georgia’s coastal zone indicate a continuous negative trend in impacts on the economy. Costs
detailed include both direct costs and lost economic opportunities. Given the methodological improvements
as well as the improvement of monitoring data, new estimates could be used as benchmarks for an economic
analysis of policy interventions to reduce the CoED and proceed with greener recovery in Georgia. Subsequent
chapters outline these estimates in detail, highlight spatial hot spots and call attention to data limitations.
28
World Bank. 2015.
29
Depending on the assumptions used, the range of estimates was 5.5%–12.47%.
30
The CoED are measured in terms of percentage of GDP in 2012 to provide an “order of magnitude” information. The cost
estimates of impact areas cannot be added or compared directly, because of differences of methodological approaches
and data availability.
31
Ministry of Environmental Protection and Agriculture of Georgia. 2017. “The National Report on the State of the
Environment of Georgia, 2014-2017.”10 Georgia: Towards Green and Resilient Growth
Table 2.2 Estimated Annual CoED in Georgia (2018)32
Sector and estimation method Estimated Annual Share of GDP in
Cost 201832
– US$ million - –%–
Land Degradation
- Agricultural land 111 0.6
Loss in agricultural productivity Benefit transfer from
(croplands and pastures), loss of external simulation
irrigated lands, sedimentation studies, market prices
of hydroelectric power plant
reservoirs.
- Forestland 16 0.1
Loss in forest ecosystem Benefit transfer from
services. Adjara region
Pollution
- Ambient air pollution 180 1.0
Impact of ambient air pollution Valued with welfare loss
(PM2.5) in exceedance of the methodology
World Health Organization’s
guidelines on health,
- Household air pollution 380 2.2
Impact of household air Valued with welfare loss
pollution (PM2.5) on health methodology
- Lead exposure 530 3.0
Loss in cognitive ability in Valued in terms of loss of
children, lifetime income
Coastal Zone Degradation Share of coastal GDP
in 2018
–%–
- Fluvial flooding 56 2.8
Damage to assets and economic Replacement cost of
productivity. ecosystem service
- Coastal flooding 27 1.4
Damage to assets and economic Replacement cost of
productivity. ecosystem service
- Coastal erosion 7 0.4
Damage to infrastructures, Damage to assets and
residential houses, tourism and economic productivity
other businesses, due to severe
waves, storms and sea surges.
- Waste 3 0.2
Damage due to uncollected Benefit transfer of the
municipal waste, damage due reduction of residential
to inappropriate disposal of property value studies
municipal waste.
- Land degradation 4 0.2
Loss of agricultural productivity Benefit transfer
and forest ecosystem services.
Source: World Bank estimation.
32
The CoED are measured in terms of percentage of GDP in 2018 to provide an “order of magnitude” information. The cost
estimates of impact areas cannot be added or compared directly, because of differences of methodological approaches
and data availability.You can also read


