Environmental performance of existing energy storage installations - Facilitating energy storage to allow high penetration of intermittent ...
←
→
Page content transcription
If your browser does not render page correctly, please read the page content below
Facilitating energy storage to allow high
penetration of intermittent renewable energy

Environmental performance of existing
energy storage installations
Deliverable D.3.1

            Source: (ESB)

                                    February 2012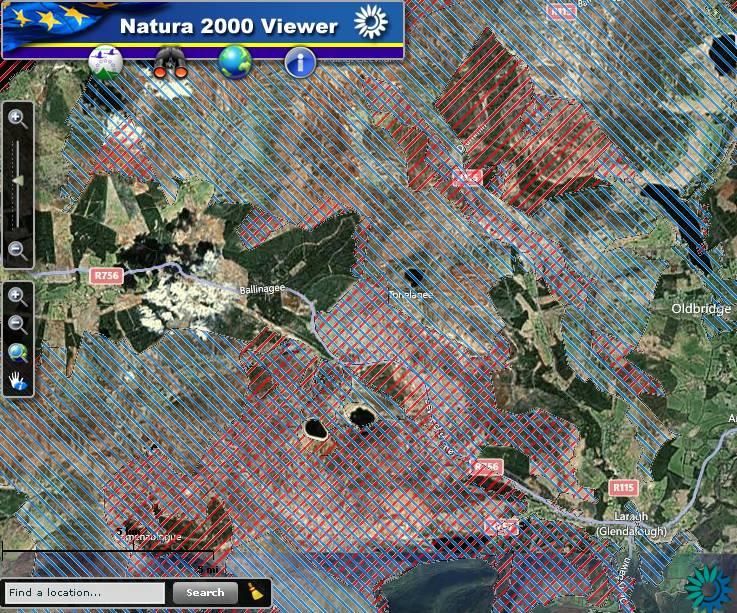
Acknowledgements
This report has been produced as part of the project “Facilitating energy storage to
allow high penetration of intermittent renewable energy”, stoRE. The logos of the
partners cooperating in this project are shown below and more information about
them and the project is available on www.store-project.eu

The work for this report has been coordinated by University College Cork (UCC) and Malachy
Walsh and Partners, Engineering and Environmental Consultants (MWP).

Author(s)
Name                                  Organisation                           Email
Annicka Wänn                          UCC                                    Annicka.wann@gmail.com
Paul Leahy                            UCC                                    Paul.leahy@ucc.ie
Monica Reidy                          MWP                                    Monica.reidy@mwp.ie
Sean Doyle                            MWP                                    Sean.doyle@mwp.ie
Helen Dalton                          MWP                                    Helen.dalton@mwp.ie
Peter Barry                           MWP                                    Peter.barry@mwp.ie

The sole responsibility for the content of this report lies with the authors. It does not necessarily reflect the
opinion of the European Union. Neither the EACI nor the European Commission is responsible for any use
that may be made of the information contained therein.

                                                                                                            2 / 99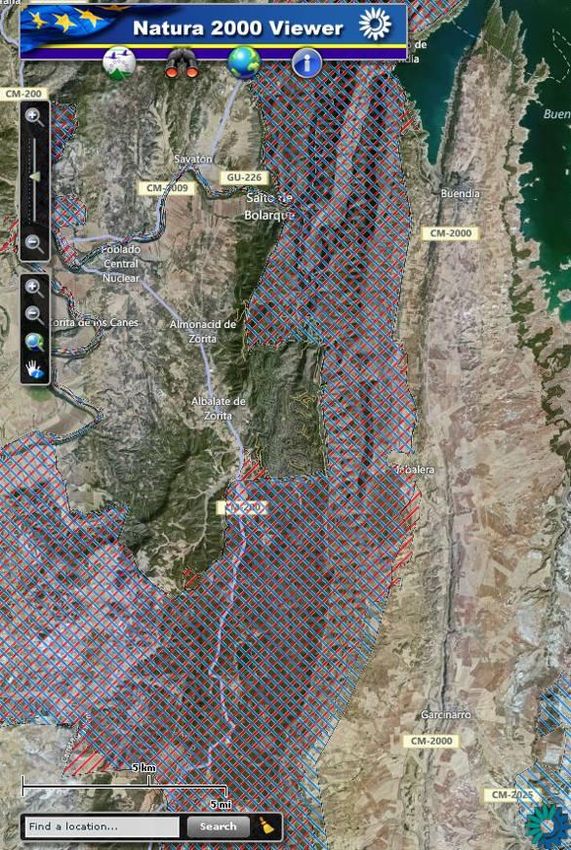
Table of Contents

TABLE OF CONTENTS ................................................................................................................................... 3

TABLE OF FIGURES....................................................................................................................................... 5

TABLE OF TABLES ........................................................................................................................................ 7

LIST OF ABBREVIATIONS.............................................................................................................................. 8

GLOSSARY ................................................................................................................................................... 9

EXECUTIVE SUMMARY .............................................................................................................................. 12

1.     INTRODUCTION ................................................................................................................................ 20

2.     THE BENEFITS OF ENERGY STORAGE ................................................................................................. 21

3.     TECHNOLOGY DESCRIPTION ............................................................................................................. 23

3.1.       Compressed Air Energy Storage ................................................................................................ 23

3.2.     Pumped Hydro Energy Storage .................................................................................................. 24
   3.2.1.   Open-system (pump-back) PHES.......................................................................................... 24
   3.2.2.   Semi-open PHES .................................................................................................................. 25
   3.2.3.   Closed-loop PHES ................................................................................................................ 26

4.     METHODOLOGY ................................................................................................................................ 28

5.     CASE STUDIES ................................................................................................................................... 31

5.1.       Limitations of case studies ......................................................................................................... 31

5.2.       Structure of case studies ............................................................................................................ 31

5.3.     CAES – Huntorf, Germany .......................................................................................................... 31
   5.3.1.   Technical Description ............................................................................................................ 32
   5.3.2.   Pre-developed environment .................................................................................................. 33
   5.3.3.   Operation impacts ................................................................................................................. 34
   5.3.4.   Summary of impacts during operation ................................................................................... 36

5.4.     Open-system (pump-back) PHES – Thissavros, Greece ........................................................... 37
   5.4.1.    Technical Description ............................................................................................................ 37
   5.4.2.    Pre-developed Environment .................................................................................................. 38
   5.4.3.    Operation impacts ................................................................................................................. 39
   5.4.4.    Summary of impacts during operation ................................................................................... 42

5.5.     Semi-open PHES – Kopswerk II, Austria .................................................................................... 43
   5.5.1.    Technical Description ............................................................................................................ 44
   5.5.2.    Pre-developed Environment .................................................................................................. 45
   5.5.3.    Operation Impacts................................................................................................................. 47

                                                                                                                                                       3 / 99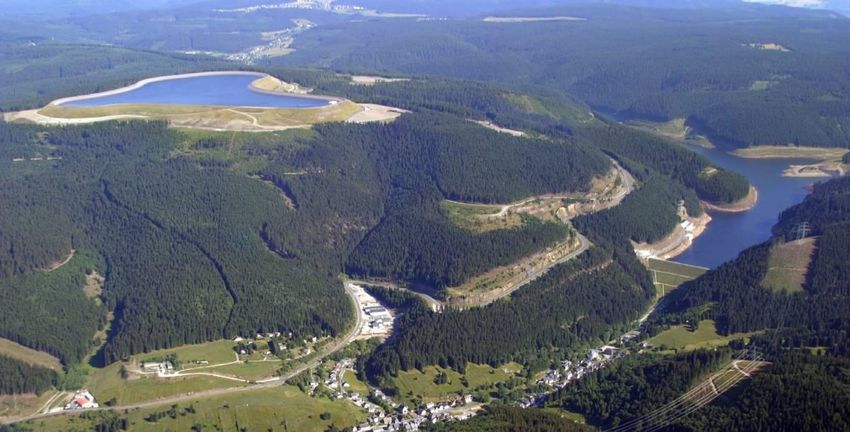
5.5.4.        Summary of impacts during operation ................................................................................... 48

5.6.     Semi-open PHES – Goldisthal, Germany ................................................................................... 49
   5.6.1.    Technical Description ............................................................................................................ 50
   5.6.2.    Pre-developed Environment .................................................................................................. 51
   5.6.3.    Operation Impacts................................................................................................................. 53
   5.6.4.    Summary of impacts during operation ................................................................................... 54

5.7.     Semi-open PHES – Bolarque, Spain ........................................................................................... 55
   5.7.1.    Technical Description ............................................................................................................ 56
   5.7.2.    Pre-developed Environment .................................................................................................. 57
   5.7.3.    Operation Impacts................................................................................................................. 58
   5.7.4.    Summary of impacts during operation ................................................................................... 60

5.8.     Closed-loop PHES – Turlough Hill, Ireland ................................................................................ 61
   5.8.1.    Technical Description ............................................................................................................ 62
   5.8.2.    Pre-developed Environment .................................................................................................. 63
   5.8.3.    Operation Impacts................................................................................................................. 64
   5.8.4.    Summary of impacts during operation ................................................................................... 66

6.     DISCUSSION OF SIGNIFICANT ENVIRONMENTAL IMPACTS FROM OPERATION................................. 68

6.1.     Compressed Air Energy Storage ................................................................................................ 68
   6.1.1.   Air and Climate ..................................................................................................................... 69

6.2.     Open-system (pump-back) PHES ............................................................................................... 70
   6.2.1.    Biodiversity ........................................................................................................................... 70
   6.2.2.    Fisheries ............................................................................................................................... 72
   6.2.3.    Air and Climate ..................................................................................................................... 74
   6.2.4.    Water Resources and Quality ................................................................................................ 75
   6.2.5.    Soils, Geology & Sediment Transport .................................................................................... 77
   6.2.6.    Hydrology and Hydrogeology ................................................................................................ 79
   6.2.7.    Interactions of open-system (pump-back) PHES.................................................................... 82

6.3.     Semi-open PHES ......................................................................................................................... 83
   6.3.1.    Biodiversity ........................................................................................................................... 84
   6.3.2.    Air and Climate ..................................................................................................................... 85
   6.3.3.    Hydrology & Hydrogeology .................................................................................................... 85
   6.3.4.    Interactions of semi-open PHES............................................................................................ 86

6.4.     Closed-loop PHES ....................................................................................................................... 88
   6.4.1.    Biodiversity ........................................................................................................................... 88
   6.4.2.    Air and Climate ..................................................................................................................... 89
   6.4.3.    Hydrology & Hydrogeology .................................................................................................... 89
   6.4.4.    Interactions of closed-loop PHES .......................................................................................... 89

7.     SUMMARY AND CONCLUSIONS ........................................................................................................ 91

7.1.       Summary...................................................................................................................................... 91

7.2.       Conclusions................................................................................................................................. 92

REFERENCES .............................................................................................................................................. 95

                                                                                                                                                     4 / 99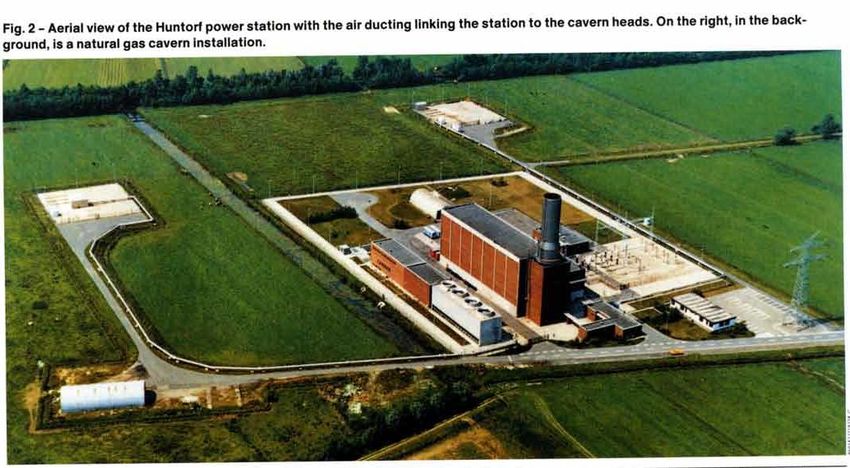
Table of Figures
Figure 1: Schematic figure of a CAES with sliding pressure. Source: (Crotogino et al., 2001) ....... 24
Figure 2: Schematic description of the pump-back PHES. Source: (MWP, 2011) ......................... 25
Figure 3: schematic description of the semi-open PHES. Source: (MWP, 2011) .......................... 26
Figure 4: Schematic description of a closed-loop PHES. Source: (MWP, 2011) ........................... 27
Figure 5: Location of Huntorf (A), Niedersachsen approximately 25km linear distance from the
North Sea. Source: (Google Maps, 2011c) ................................................................................. 32
Figure 6: Schematic layout of CAES facility Huntorf. Source: (Radgen, 2009) ............................. 32
Figure 7: The white arrow is pointing to Huntorf CAES facility. The red diagonal lines and the blue
diagonal lines are designated areas under the Birds Directive and the Habitat Directive
respectively. Source: (EEA, 2011) ............................................................................................. 34
Figure 8: (left) The two caverns and plant on the same scale. Source: (Crotogino et al., 2001)
(right) The plant with wind turbines in the background. Source: (KBB) ......................................... 35
Figure 9: Aerial view of Huntorf power station. Source: (BBC Brown Boveri, 1986) ...................... 35
Figure 10: Depth of the caverns: comparison of sonar survey for NK1 in 1984 and laser survey in
2001. Source: (Crotogino et al., 2001) ....................................................................................... 36
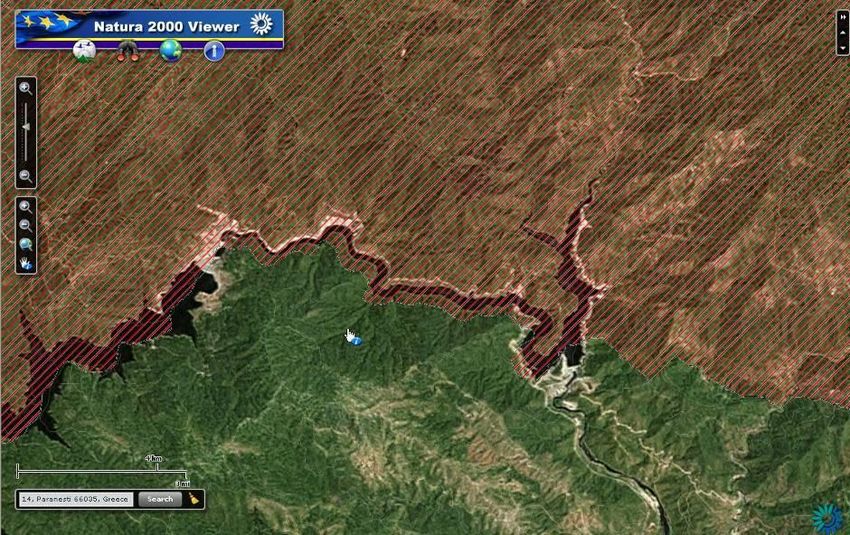
Figure 11: Thissavros (A), located on the Nestos River approximately 30km downstream of the
Bulgarian boarder. Source: (Google Maps, 2011e) ..................................................................... 37
Figure 12: Thissavros dam – upper reservoir. Source: (Metka, 2010) .......................................... 38
Figure 13: Thissavros dam (white arrow) and the Nestos River Basin with areas protected under
the Birds Directive (red diagonal lines). Source: (EEA, 2011) ...................................................... 40
Figure 14: the lower (purple) and upper (A) reservoir Rifa and Kops located in the western most
state of Vorarlberg in Austria. Source: (Google Maps, 2011d) ..................................................... 44
Figure 15: (left) lower reservoir Rifa; (right) upper reservoir Kops. Source: (Illwerke vkw, 2008) ... 45
Figure 16: Complex run-off system Vorarlberg. Source: (Illwerke vkw, 2006) ............................... 45
Figure 17: Designated Important Bird Areas. The white arrow marks the position of Kops
Reservoir. The red arrow marks the position of Rifa reservoir. Source: (BirdLife International, 2012)
................................................................................................................................................ 46
Figure 18: Goldisthal (A) located in the state of Thuringia in central Germany. Source: (Google
Maps, 2011b) ........................................................................................................................... 50
Figure 19: Goldisthal - the upper and lower reservoir (left to right). Source: (Vattenfall Europa AG)
................................................................................................................................................ 51
Figure 20: The white arrow marks the location of the lower and upper reservoir of Goldisthal. The
red and blue diagonal lines show the designated Birds Directive and the Habitat Directive Sites
respectively. Source: (EEA, 2011) ............................................................................................. 52
Figure 21: The lower reservoir Bolarque (red arrow) and the upper reservoir Bujeda (black arrow),
located approximately 120 km east of Madrid in central Spain. Source:(Google Maps, 2011a) ..... 56
5 / 99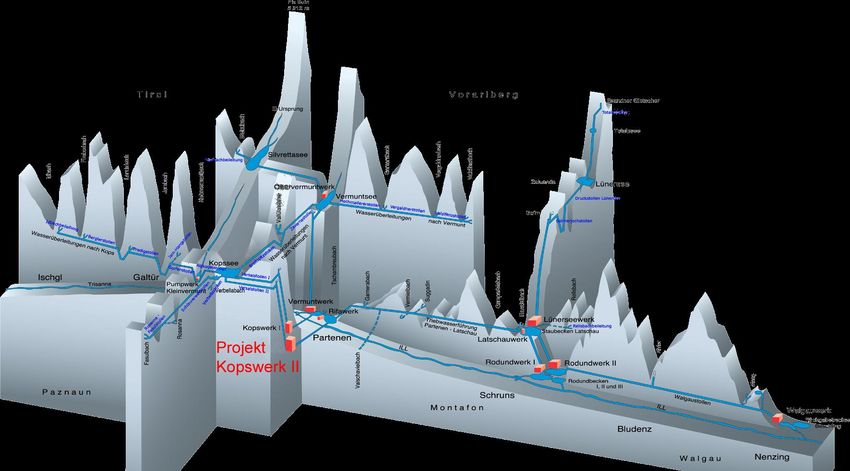
Figure 22: (left) upper reservoir, Bujeda. The aqueduct at the bottom is the start of the transfer to
the Segura River Basin. (right) lower reservoir, Bolarque, with visible penstocks leading up the
mountain towards the upper reservoir, Bujeda Reservoir. Source: (left): (Semprem), (right):
(CEDEX/Ministerio de Formento) .............................................................................................. 57

Figure 23: The upper reservoir (white arrow) and lower reservoir (green arrow) are located in a
Natura 2000 site protected by the Habitat Directive (blue diagonal lines) and the Birds Directive
(red diagonal lines). .................................................................................................................. 59

Figure 24: Turlough Hill (A) located in the heart of Wicklow Mountains. Source: (Google Maps,
2011f) ...................................................................................................................................... 62

Figure 25: Turlough Hill – lower reservoir (left) upper reservoir (right). Source: (ESB) .................. 63

Figure 26: The upper and lower (red arrow) reservoir is located in areas protected by the Habitat
Directive (blue diagonal lines) and by the Birds Directive (red diagonal lines). Source: (EEA, 2011)
................................................................................................................................................ 66

Figure 27: Life cycle GHG emissions from electricity storage. Source: (Denholm and Kulcinski,
2004) ....................................................................................................................................... 69

Figure 28: Flow chart for evaluating the need for a fish facility to restore fish passage for
potamodromous and diadromous species. Source: (Porcher and Travade, 2002) ........................ 73

Figure 29: (left) A hypothetical summer profile depicting a vertical temperature gradient for the
layers. Source: (Ourlake, 2009b). (right) A hypothetical profile of dissolved oxygen (DO) saturation
vertically through a lake. Source: (Ourlake, 2009a) .................................................................... 76

Figure 30: Reservoir size versus the rate of loss of storage based on data from 1105 US
Reservoirs. Source: (White, 2001) ............................................................................................. 78

Figure 31: Operation of a flood-control dam on the Green River in Kentucky, USA results in
substantially lowered flood peaks, followed by extended high-flow releases of stored floodwater
(based on 1978 data). Source: (Richter and Thomas, 2007) ....................................................... 80

Figure 32: A conceptual approach of how to build an environmental flow release regime, where the
continuous line represents the natural flow hydrograph for one year and the blocks represent the
flow regime by a HP or a pump-back PHES required to maintain a healthy ecosystem. Source:
(Acreman and Ferguson, 2010) ................................................................................................. 82

                                                                                                                                             6 / 99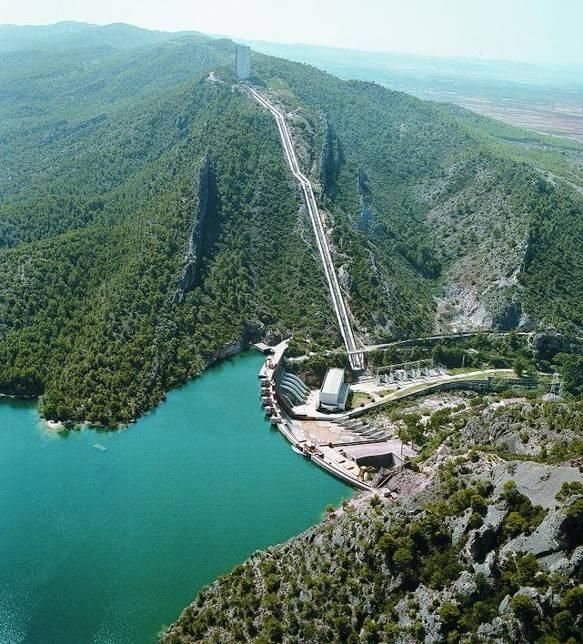
Table of Tables
Table 1: Definitions used to determine operation impact of the case studies (EPA (Ireland), 2002)
................................................................................................................................................ 30

Table 2: Summary table showing the negative impacts during operation of the CAES facility
Huntorf ..................................................................................................................................... 36

Table 3: Summary table showing the negative impacts during operation of the semi-open PHES
Thissavros ................................................................................................................................ 43

Table 4: Summary table showing the negative impacts during operation of the semi-open PHES
Kopswerk 2 .............................................................................................................................. 49

Table 5: Summary table showing the negative impacts during operation of the semi-open PHES
Goldisthal ................................................................................................................................. 55

Table 6: Summary table showing the negative impacts during operation of the semi-open PHES
Bolarque II ................................................................................................................................ 61

Table 7: Summary table showing the negative impacts during operation of the closed-loop PHES
Turlough Hill ............................................................................................................................. 67

Table 8: Summary table of negative impacts during operation highlighted from the case studies .. 68

Table 9: Summary table of negative impacts from operation of pump-back highlighted in
Thissavros compared with a notional Thissavros (had it been retrofitted) .................................... 70

Table 10: Summary Matrix of the interactions between specific environmental aspects................ 83

Table 11: Summary table of negative impacts from operation of Semi-open PHES highlighted by
three of the cases studies ......................................................................................................... 84

Table 12: Summary Matrix of the interactions between specific environmental aspects................ 87

Table 13: Summary table showing the negative impacts during operation of the closed-loop PHES
Turlough Hill ............................................................................................................................. 88

Table 14: Summary Matrix of the interactions between specific environmental aspects................ 90

Table 15: Summary table of negative impacts during operation highlighted from the case studies 92

                                                                                                                                             7 / 99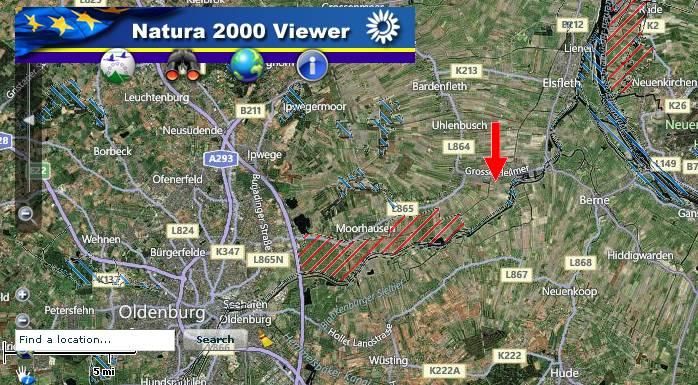
List of Abbreviations

AA- CAES   ...   Advanced adiabatic compressed air energy storage
BBM        ...   Building block methodology
CAES       ...   Compressed air energy storage
CCGT       ...   Combined cycle gas turbine
CCS        ...   Carbon capture and storage
CO2        ...   Carbon dioxide
DO         ...   Dissolved oxygen
EIA        ...   Environmental impact assessment
EST        ...   Energy storage technologies
GEP        ...   Good Ecological Potential
GES        ...   Good environmental status
GHG        ...   Greenhouse gas
GW         ...   Gigawatt
GWh        ...   Gigawatt hour
HMWB       ...   Heavily Modified Water Body
HP         ...   Hydropower
IBA        ...   Important Birds Areas
kW         ...   Kilowatt
kWh        ...   Kilowatt hours
LCA        ...   Life cycle analysis
CH4        ...   Methane
MS         ...   Member States
MW         ...   Megawatt
MWh        ...   Megawatt hour
PHES       …     Pumped hydro energy storage
RES        ...   Renewable energy sources
RES-e      ...   Renewable electricity sources
SHP        ...   Small Hydropower
TSO        ...   Transmission system operators
TW         ...   Terawatt
TWh        ...   Terawatt hour

                                                                    8 / 99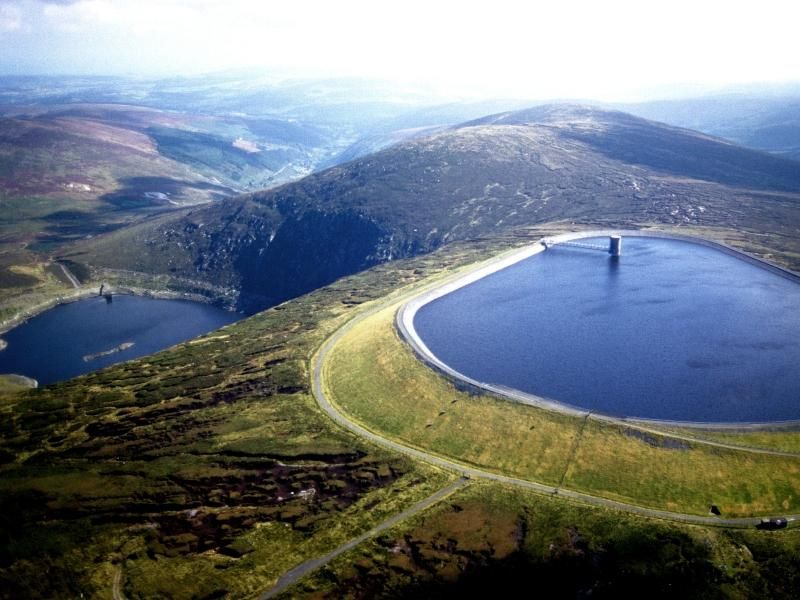
Glossary

Adiabatic process      A term used in thermodynamics to describe a process that occurs without
                       heat loss or heat gain
Anadromous             Fish species whose reproduction takes place in freshwater and growing
                       phase in the sea. Migration back to freshwater is for the purpose of
                       reproduction.
Environmental aspect   Is a feature or characteristic of an activity, product or service that interacts
                       with and affects the environment
Base load              The minimum amount of power that a utility company must make available
                       to the grid to cover a given regions continuous energy demand
Catadromous            Fish species whose reproduction takes place in the sea and growing
                       phase in freshwater (opposite of anadromous)
Cavern configuration   Referring to a powerhouse (turbine, generator, pumps etc) that is located
                       below ground in an excavated cavern with access via a tunnel
Cumulative impact      The impact on the environment that occurs from the incremental impacts
                       of the actions when added to the past, present, and reasonably
                       foreseeable future actions. Can be minor individual actions that
                       collectively become significant
Dead Storage           Is the volume of space below the dams lowest outlet
Diabatic process       A term used in thermodynamics to describe a process that involves heat
                       loss or heat gain
Diadromous             Fish whose life cycle takes place partly in fresh and partly in marine
                       waters. Distinction can be made between catadromous and anadromous
                       species.
Draft tube             The draft tube is a conduit that connects the runner exit to the tail race
                       where the water is discharged from the turbine. The primary function of
                       the draft tube is to reduce the velocity of the discharged water to minimize
                       the loss of kinetic energy at the outlet.
Ecological flow        Is used interchangeably with natural flow
Environmental flow     The quantity, quality and timing of water flow required to sustain
                       freshwater and estuarine ecosystems. It aims to simulate but is not a
                       substitute for the natural flow of the river
Environmental impact   Refers to a change in the environment that can be positive or negative.
                       Environmental impacts are caused by environmental aspects.
Head                   Head is pressure created by the difference in elevation between the upper
                       and lower reservoir water surface. Higher head will produce greater
                       pressure and therefore more power. Head also determines what type of
                       turbine to use.
High Impact            Modified term from the Glossary of Impacts in EPA (Ireland) (2002) to
                       include two definitions; significant impact by its character and magnitude
                       and duration or intensity alters a sensitive aspect of the environment; and
                       profound impact which obliterates sensitive characteristics.
Hydropower             Known also as an impoundment and usually refers to a large hydro power

                                                                                                   9 / 99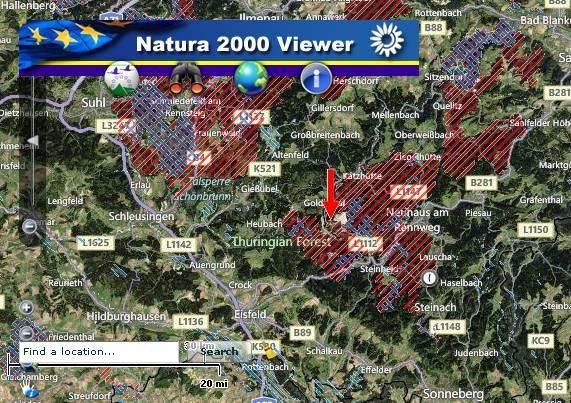
facility that uses a dam to store river water in a reservoir. The higher the
                      water level in a reservoir (i.e head) the more potential energy is available
                      for power generation. Often used for peak load generation.
Large Hydropower      Usually refers to hydro power facilities with an installed capacity of more
                      than 10MW
Life cycle analysis   A method used to assess the environmental impact associated with all
                      stages of a product or service (from cradle-to-grave)
Low impact            Modified term from the Glossary of Impacts in EPA (Ireland) (2002) to
                      include two definitions; imperceptible impact capable of measurement but
                      without noticeable consequences; and slight impact, which causes
                      noticeable changes without affecting its sensitivity
Medium Impact         Modified term from the Glossary of Impacts in EPA (Ireland) (2002) to
                      mean a moderate impact which alters the character of the environment in
                      a manner that is consistent with existing and emerging trends
Mid-merit             Are power plants that fill the gap between base load and peak load.
Minimum flow          Minimum flow from dams are in place to maintain the ecological quality of
                      a river downstream (i.e. prevent rivers from drying up)
Natura 2000 Network   Network of protection areas established under the 1992 Habitat Directive,
                      comprising Special Areas of Conservation (SACs) under the Habitat
                      Directive and Special Protection Areas (SPAs) designated under the 1979
                      Birds Directive.
Natural flow          The flow that would naturally occur in a river without the presence of a
                      dam. Natural fluctuations vary in magnitude on a seasonal basis

Peak load             The maximum power requirement of a system at a given time period
Penstock              The pipes or tunnels through which the water moves from the reservoir to
                      the power station (pipes can be constructed above or below ground)
Potamodromous         Fish species that complete their entire life cycle in freshwater;
                      reproductive and feeding zones
Pre-developed         The environment that existed prior to the development of for example a
Environment           PHES facility. Helps determine the level of environmental impact of the
                      facility.
Run-of-river          Known also as a diversion where the hydro facility only uses the water that
                      is available in the natural flow of the river. These facilities will have little or
                      no water storage possibilities and power generation will fluctuates with the
                      natural flow of the river. Not an option for peak load generation.
Scoping               Is a method to determine key issues from a broad range of potential
                      concerns for inclusion in EIA studies
Sensitive species     Species that can only survive within a narrow range of environmental
                      conditions and whose disappearance is used as an index of pollution or
                      other environmental changes.
Sensitivity           Sensitivity of an area is determined by the value of the receiving
                      environment or receptors
Shaft configuration   Referring to a powerhouse that is located immediately below the ground
                      surface and constructed in an open excavation or shaft. Access is via an
                      overground superstructure

                                                                                                   10 / 99
Small Hydropower Although definitions vary, it usually refers to hydropower with an installed
capacity of less than 10MW
Tail race the tail race is where the water is finally discharged from the turbine
Tolerant species Species that can survive in a wider range of environmental conditions
Wind curtailment During windy conditions when turbines generate more electricity than
demand requires, wind will be “dumped” by reducing electricity generation
below what it is capable of producing.
11 / 99Environmental performance of existing
energy storage installations
Deliverable 3.1
Executive Summary
Introduction
Recent increases in electricity generation from renewable energy sources in response to EU
targets have led to renewed interest in energy storage to help integrate renewable energy into the
grid. The EU directive 2009/28/EC states that electricity from renewable sources should be given
priority over that from other sources. Large scale energy storage can help to increase the
penetration of wind and other variable renewable energy sources. There are two proven energy
storage technologies that are achievable on a large scale today: pumped hydro energy storage
(PHES) and compressed air energy storage (CAES). There are more than 300 PHES schemes
operating in the world, whereas there are only two CAES facilities, one in Huntorf, Germany and
the other in Alabama, USA.
The EU-funded project stoRE aims to facilitate energy storage in order to allow for higher
penetration of variable renewable energy generation. This deliverable describes a key task which
aims to determine the environmental performance of existing energy storage facilities. The
knowledge gained from the experiences highlighted in six case studies will form the foundation for
the rest of the tasks within work package three of stoRE that aim to determine international best
practice and to lower environmental barriers to implementing new energy storage schemes.
The Benefits of Energy Storage
There are several positive impacts associated with an increased energy storage capacity. The
benefits of bulk energy storage technologies include: black start capabilities, grid flexibility and
stability, spinning reserve, auxiliary reserve, peak shaving and regulation control. More energy
storage facilities also mean less curtailment of wind power, as the bulk energy storage
technologies will absorb excess electricity. At the same time CO2 emissions are mitigated as the
avoidance of curtailment displaces electricity from fossil fuel sources. Other technologies, such as
open cycle gas turbines can provide peak power during fall-off of wind. However, these
technologies cannot store electricity during times when wind production exceeds that which the
grid can utilise.
The Technologies
Two main technologies have been studied in this report; CAES and PHES. The latter has been
categorised further into three main types:
- Closed-loop: consists of two reservoirs that are separated by a vertical distance, neither of
which is connected to another body of water.
- Semi-open: consists of one artificial or modified reservoir and one modified lake or river
impoundment with continuous through flow.
- Open-system (pump-back): a system where there is continuous flow of water through both
the upper and lower reservoir.
12 / 99The reason for the subcategories is that these three main types behave very differently in terms of
water management and will therefore have different environmental impacts during operation. In
addition, even though there are different types of open-system PHES, the pump-back PHES is the
most common type. It is therefore important to note that when referring to the open-system
category, this deliverable deals exclusively with the environmental impacts from the operation of
pump-back PHES.
The Case Studies
Six case studies were chosen from five of the partner countries. The sixth partner country,
Denmark, does not have any CAES or PHES facilities and could therefore not form part of this
report. Five different PHES facilities were chosen in terms of age, pre-developed environment and
technology to cover as wide a range as possible. Only one CAES was chosen as there only is one
in Europe at this time and only two worldwide.
To help determine the environmental performance of the selected cases in the operational phase
the magnitude of the environmental impacts has been classified as high, medium or low (see Table
1). The magnitude of the impact will depend on the sensitivity of the receiving environment. The
impacts have also been categorised by potential issues/Environmental Impact Assessment terms
of reference.
Table 1: Definitions used to determine operational impact of the case studies
Magnitude Characteristics of impacts
Imperceptible impact capable of measurement but without noticeable
consequences
Low Slight impact, which causes noticeable changes without affecting its
sensitivity
Moderate impact which alters the character of the environment in a manner
Medium
that is consistent with existing and emerging trends
Significant impact by its character and magnitude and duration or intensity
High alters a sensitive aspect of the environment or profound
Profound impact which obliterates sensitive characteristics
While bulk energy storage technologies have obvious benefits, for the purposes of the case
studies only the negative impacts of operational facilities that reduce the quality of the environment
are addressed. Direct and indirect environmental impacts as well as additional impacts have been
identified. It is important to note that the list of environmental impacts, in particular those of a
cumulative nature, is not exhaustive and other impacts
may occur that have not been identified in the deliverable.
Due to the life span of the facilities most impacts
associated with their operation are considered to be long-
term.
1. Case Study – Huntorf
Huntorf is located in the northwest of Germany in
Niedersachsen. It was commissioned in 1978 and was the
first CAES facility installed worldwide. The facility was Source: KBB
installed with a capacity of 290MW but was upgraded to
13 / 99321MW in 2007. It has a storage capacity of 0.64GWh and has the ability to operate at peak load
for about 2 hours per day.
The CAES was constructed into an already stressed environment, where the predominant land use
is still agriculture. There are also several large cities in close proximity. It uses two large
underground salt caverns to store the compressed air. Each of the caverns is located at a depth
between 650-800m and is approximately 40m in diameter. Salt deposits are the most suitable type
of geology to use for CAES as these structures are plastic, yet solid and impermeable. The main
features of the facility are thus out of sight from local population.
As Huntorf is a diabatic CAES, heat is lost from the air as it compresses. The result is that during
decompression the system requires natural gas, as its external heat source, to recover the stored
compressed air. This type of CAES is therefore not considered to be a “pure” electricity storage
technology, but rather a hybrid system. The requirement for natural gas however, is one third that
of conventional gas turbine power plants. In addition to this fuel requirement, further emissions of
GHG may be incurred depending on the primary source of electricity that the CAES uses to
operate the compressors.
2. Case Study – Thissavros
Thissavros is located in Greece, in the Nestos River
Basin close to the Bulgarian border. The River
Nestos is shared by Bulgaria and Greece and was
already regulated with irrigation dams in Bulgaria
prior to the construction of Thissavros. The dam and
pump-back PHES was therefore constructed into an
already stressed environment but has had an
additional impact on the river system. The dam is a
172m rock filled dam, and as such one of the highest
dams in Europe. It was commissioned in 1997 and Source: Metka
has an installed capacity of 381MW. A further dam
was commissioned in 1999 downstream of Thissavros called Platanovrisi. Together the two dams
provide electricity generation, peak power and water for irrigation.
Thissavros is located in a very sparsely populated area where the main use of land is forestry.
Although the construction of the dam and PHES has made the area more accessible, the visual
impact of a 172m rock filled dam does not go unnoticed. Although habitat loss due to land
inundation to create Thissavros reservoir is an impact of construction, the long term effects on flora
and fauna are attributed to the operational phase. Since Thissavros does not have a fish pass to
facilitate fish migration, the direct result is that 20 fish species may be directly affected by
ecosystem isolation in Platanovrisi and Thissavros reservoirs. Changing the river environment to a
lake environment to create storage has furthermore resulted in thermal stratification. This has had
the effect that cold water which is nutrient rich and higher salt concentration is discharged into the
downstream river thus changing the environment for native aquatic species. The result has been
an influx of non-native species that are quickly becoming the dominant species.
The dam has also inhibited the Nestos River’s role in sediment transport. Although there is
currently no issue with sediment accumulating behind the dam, the beaches in the delta region
have been found to have much higher erosion rates than accretion rates, whereas prior to the
construction of the dam accretion rates were about eight times higher than erosion rates. Although
no studies were found on greenhouse gas emissions from the inundated landmass of Thissavros
reservoir, emissions should be assumed and accounted for even during operation. Furthermore,
depending on the primary electricity source used during pumping additional greenhouse gas
14 / 99emissions need to be accounted for. If electricity from renewable energy sources are used then the
greenhouse gas emissions will be relatively low, whereas if fossil fuel is used the greenhouse gas
emissions will be relatively high.
3. Case Study – Kopswerk II
Kopswerk II is located in the west of Austria in the
region of Vorarlberg. The semi-open PHES was
commissioned in 2008 with an installed capacity of
450MW. The facility utilises the already existing
upper reservoir, Kops and the lower reservoir, Rifa.
Thus, no extra impoundment was needed to
operate Kopswerk II. The semi-open PHES has
been constructed into a very complex hydropower
and PHES system common in the alpine regions.
Therefore, the pre-developed environment was
Source: Illwerke vkw
already changed to such a degree that the addition
of Kopswerk II has brought very little further environmental impact during operation. It must be
noted however, that the water level in the Kops has been observed to fluctuate more frequently
since the addition of Kopswerk II as the PHES operates on a daily basis, whereas previously the
Kops was only used as annual storage.
4. Case Study – Goldisthal
Goldisthal is located in central Germany in the
state of Thuringia. The semi-open PHES was
commissioned in 2003, over 30 years after the
initial geological works first commenced. The
facility is situated on the River Schwarza, which
has been impounded by two dams to create the
lower reservoir. The upper reservoir was also
created and is situated approximately 300m above
the lower reservoir. The facility has an installed Source: Vattenfall Europa AG
capacity of 1,060MW. The lower dam also boasts
a small hydropower facility that produces an additional 1.6GWh annually from the water
discharged to the downstream environment.
The positive aspect of this project is that the dams themselves maintain the water level in the river
upstream and downstream of the reservoir, whilst the reservoir level itself fluctuates. Although
minimum flow is in place the lower reservoir regulates the discharge to the downstream
environment, resulting in an alteration in natural river discharge.
Impeding structures, such as weirs and ineffective fish passes, along the river downstream of
Golidsthal have made fish migration along the river difficult prior to the construction of Golidsthal.
These constructions are now being deconstructed to allow for free fish passage along the river
Schwarza and Saale. This is part of the WFD requirements to reestablish river ecosystems and
also as compensation for Golidsthal and Leibis-Lichte reservoir.
15 / 995. Case Study – Bolarque II
Bolarque II is situated in central Spain, approximately 120km
east of Madrid. The semi-open PHES was commissioned in
1975, utilising the already existing Bolarque reservoir as the
lower reservoir. Bolarque dam was commissioned in 1910.
Upstream are two further dams, Entrepenas and Buendia,
commissioned in 1958 and 1956 respectively. Downstream
of Bolarque dam is another dam, Zorita, commissioned in
1947. Bujeda reservoir, almost 300m above, was created as
the upper reservoir. The semi-open PHES was thus
constructed into an already highly stressed and regulated
environment. A further feature of the semi-open PHES is Source: CEDEX/Ministerio de
that it also facilitates the water transfer from the Tagus River Formento
Basin, via Bujeda to the Segura River Basin almost 300km
to the south east.
While most of the environmental impacts on the Tagus River are due to human activities (sewage,
industry, agriculture, releasing non-native species into the area, water transfer), the semi-open
PHES has almost no environmental impacts during operation.
6. Case Study – Turlough Hill
Turlough Hill is located in east Ireland in the Wicklow
Mountains. The closed-loop PHES was commissioned
in 1974 and utilises the existing lake, Lough
Nahanagan as the lower reservoir. The manmade
upper reservoir is located almost 300m above. The
installed capacity is 292MW. It is the only PHES
facility in Ireland today (2012) and was a major
engineering feat of its time.
The main environmental impact has been that the
lower lake was lowered by 15m during construction to Source: ESB
accommodate the PHES facility. From there it is
lowered a further 10m on a daily basis during pumping mode. This has affected the shore line
vegetation in terms of species cover. Some heather has slowly encroached on the permanently
exposed areas and 40 years after commissioning of Turlough Hill the original water line is still
evident.
Summary of Negative Environmental Impacts during Operation
A summary of the negative environmental impacts during operation is given in Table 2. The case
studies have helped highlight the main environmental issues during operation. Limitations are to be
found in lack of information, range and number of case studies chosen and the actual choice of
case studies.
16 / 99Table 2: summary of negative environmental impacts during operation highlighted by case
studies
Pump-back Closed-loop
CAES PHES Semi-open PHES PHES
Potential Issues/EIA terms of
Huntorf Thissavros Kopswerk2 Goldisthal Bolarque2 Turlough Hill
reference
Population L L L L L L
Human Impact
Traffic L L L L L L
Cultural Heritage L L L L L L
Material Assets L L L L L L
Biodiversity L H L H L H
Ecology and Natural
Fisheries L H L M L M
Systems
Air and Climate L-H* L-H* L-H* L-H* L-H* L-H*
Landscape and L M L M M M
Visuals
Water Resources & L H L M L M
Quality
Noise & Vibration L L L L L L
Environment
Physical
Soils, Geology & L H L M L L
Sediment Transport
Hydrology & L H M H L H
Hydrogeology
- Recommended to review each individual case study
- Inclusion of combined impacts with existing land uses and pressures
- Limited raw data
Conclusions
The main benefit of PHES and CAES from an environmental perspective is that storing electricity
from renewable energy sources will result in a reduction of wind curtailment with consequent
reduction in carbon dioxide production. The following sections highlight the main conclusions of the
environmental performance during operation as determined by the case studies and literature
review.
CAES
- The case study on the Huntorf CAES facility has highlighted very few environmental
impacts during operation. This is partly because the CAES was constructed into a
previously modified environment. It is important to note however that there may be further
impacts during construction, the analysis of which is beyond the scope of this report.
17 / 99- The main drawback of the existing CAES is that it is a hybrid system. This means that it is
dependent on an external heat source (i.e. natural gas) to replace the heat lost during the
compression stage. The required amount is however, one third that of conventional gas
turbines. Using biofuel instead may be a way of making CAES carbon neutral, provided that
the biofuel is itself carbon neutral. Advanced Adiabatic CAES systems, which are currently
under research, would eliminate the required external heat source.
Open-system (pump-back) PHES
- Thissavros pump-back PHES has several environmental impacts associated with it, mainly
because the dam and PHES facility were constructed simultaneously into a relatively
unmodified environment. Since most of the long-term impacts are associated with the initial
construction of the dam, a more benign solution would be to retrofit an already existing
hydropower scheme with pumps. The receiving environment in such a case would already
be heavily modified, resulting in a significantly lower environmental impact of the PHES.
Although retrofitting has a lower environmental impact, it is not always an option as some
countries or regions may require new developments.
- The construction of a dam for hydro generation results in alteration of the natural flow
regime of the river. The flow is controlled primarily to meet electricity demands with little
consideration for the environmental needs of the downstream river system. This regulation
ultimately reduces or eliminates natural peak flood events and low flow events. While
minimum flows1 are normally maintained, this does not guarantee that the environmental
needs are met. The operating regime of the facility could be managed, by means of
environmental flow 2, so as to simulate natural flow conditions. In this way the environmental
impact could be mitigated but it should be noted that environmental flow is not a perfect
substitute for natural flow. Changing operating regimes may also incur a trade-off in
reduced operational flexibility and ability to provide fast reserve to accommodate variable
renewable energy sources.
- Rivers transport a vast amount of sediment and nutrients to their lower reaches and coastal
areas. The presence of a dam on a river will hinder this process by allowing sediment to
accumulate behind it instead. Reduced sediment transport to the downstream environment
causes a reduced accretion rate that may be detrimental to the coastal and delta areas and
ultimately to the flora and fauna that inhabit these.
- Changing a river environment into a lake environment will likely result in thermal
stratification 3. As extraction of water from the lower thermal layers is the norm when
operating the turbines the downstream river is affected by colder water and higher salt
concentrations from the discharge. A direct result of changing water temperature, velocity
and nutrient levels is that the species abundance and diversity can change. Native species
may be outcompeted by non-native species that are more adapted to the new conditions.
1
Minimum flow from dams are in place to maintain the ecological quality of a river downstream (i.e. prevent rivers
from drying up)
2
Environmental flow describes the quantity, quality and timing of water flow required to sustain freshwater and
estuarine ecosystems. It aims to simulate the natural flow of the river. Thorough investigation of the environmental
requirements are needed to determine EF
3
Thermal stratification will layer the lake, with the coldest water in the bottom most layer (hypolimnium) and the
warmest at the top (epilimnion). Salt and nutrients will also collect at the bottom. The process of thermal stratification
refers to the so called ”turn over” of the lake.
18 / 99- Fluctuating water levels, resulting from the operating regime, will cause frequent inundation
and draw down of shoreline, isolation of spawning areas, loss of habitat and limited
regeneration both upstream and downstream. Natural fluctuations vary in magnitude on a
seasonal basis whereas operational fluctuations vary on a daily basis at a relatively
constant magnitude.
- The presence of a dam hinders both upstream and downstream fish migration. This can be
detrimental to fish populations as it can prevent movement between spawning and feeding
areas. For upstream migration fish passes may be an option for smaller dams, but for
larger dams such as Thissavros the only feasible option is to transport them by trucks or
fish lifts. Downstream migration will generally occur via turbines or spillways. Both
upstream and downstream migration by artificial means is not fully effective and will result
in some fish mortality.
Semi-open PHES
- Kopswerk II and Bolarque II were constructed in heavily modified environments resulting in
low environmental impact during operation. Goldisthal on the other hand was constructed in
a less modified environment which has resulted in a greater environmental impact.
Therefore potential PHES sites in already modified environments should be considered
where available.
- As with the pump-back PHES fluctuating water levels, resulting from the operating regime,
will cause frequent inundation and draw down of shoreline, isolation of spawning areas,
loss of habitat and limited regeneration both upstream and downstream.
Closed-loop PHES
- Turlough Hill was specifically designed for peak operation which means that the water level
fluctuates through its full active range on a daily basis. This regular mass movement of
water inhibits the natural lake processes within the lower lake.
- The shoreline vegetation communities associated with oligotrophic lakes, which are listed
on Annex I of the Habitats Directive, is an important characteristic. The artificial
modification of the natural water level can reduce the diversity of typical soft water species
present. It is unlikely that the natural vegetation of the Lough Nahanagan shoreline can
tolerate the artificial lowering of the lake levels and the regular lowering and raising of lake
levels associated with the daily operation of the plant.
19 / 991. Introduction
The objective of the stoRE project is to facilitate energy storage to allow greater penetration of
variable renewable energy. The project is divided into 6 work packages (WP): WP1 – Consortium
Management, WP2 – Technology and Needs Overview, WP3 – Environmental Issues, WP4 –
Regulatory and Market Framework Analysis on a European Level, WP5 – Target countries
Analysis and Recommendations and WP6 – Communications.
WP3 focuses on the environmental considerations relevant to the development and operation of
bulk energy storage technologies (EST), specifically pumped hydro energy storage (PHES) and
compressed air energy storage (CAES). WP3 will publish three deliverables (D): D.3.1
Documentation of the environmental performance of existing storage facilities, identifying factors
affecting their performance, D.3.2 Recommendations for policy makers on the national and
European level on improving the environmental regulations facilitating development while
protecting the environment and D.3.3 Report with guidelines for the development of PHES in
environmentally sensitive areas. The work presented in WP3 has been done in collaboration
between University College Cork (UCC) and Malachy Walsh and Partners, Engineering and
Environmental Consultants (MWP) with contributions from National Technical University of Athens
(NTUA), Helmut Schmidt University (HSU), Energy Economic Group (EEG) and National
Renewable Energy Centre of Spain (CENER).
This deliverable, D.3.1, documents the environmental performance of existing PHES and CAES,
identifying factors affecting their performance. The work is based on an extensive literature study
and on six case studies that have been chosen from five of the six partner countries; Austria,
Germany, Greece, Ireland and Spain. No case could be chosen from the sixth partner country,
Denmark, as it does not have any PHES or CAES. Efforts have been made to include different
types of PHES plants in order to examine the full scope of environmental performance issues
affecting PHES, as different schemes may have different associated environmental issues. This
also ensures that the information is relevant to the greatest number of cases. Therefore one
CAES, one closed-loop PHES, three semi-closed loop PHES and one open-system PHES have
been selected for consideration. While the environmental impact of energy storage facilities
associated with their development, design, construction, operation and decommissioning may be
interlinked, this deliverable focuses only on the operation of existing CAES and PHES facilities.
This deliverable, D.3.1, is laid out in the following chapters. Chapter 2 will briefly discuss the
benefits of energy storage. Chapter 3 presents a schematic description of CAES and the three
main types of PHES. Chapter 4 will present the case studies in terms of environmental
performance during operation. The information presented here is based on information collected
from the partners through two extensive questionnaires and other documents available in the
public domain. Chapter 5 will further the discussions on the main environmental impacts from
operation identified in the case studies. The information presented in this chapter is based on the
findings in Chapter 4 and on an extensive literature study. Chapter 6 provides a short summary,
draws conclusions and makes some recommendations.
20 / 992. The Benefits of Energy Storage
As our society depends on electricity for almost all functions of daily life it is vital that electricity
supply equals demand at all times. The demand curve varies over the course of a day, with peaks
occurring at times such as morning, early afternoon and evening and ebbing at other times.
Electricity generators are broadly categorised into base load, mid-merit and peaking plants
depending on the rate at which their output can be increased or decreased in response to changes
in demand. Base load generators have slow response times, thus lacking the flexibility that is
needed to meet peak demand. Peaking facilities such as hydropower (HP), gas turbines and bulk
EST are used to complement base load as these respond quickly to varying electricity demand,
thus creating a more flexible grid. Electricity from base load sources, such as nuclear power, coal
and lignite plants have highest efficiencies when generating electricity at a constant rate.
The Directive 2009/28/EC on renewable energy sets ambitious targets for all Member States (MS)
to reduce carbon dioxide (CO2) emissions by 2020, by increasing its share of renewable energy
sources (RES). This directive also enforces priority dispatch to guarantee that the RES that is
produced also reaches the market. However, priority dispatch of electricity from RES (RES-e) to
the electricity grid coupled with dramatic increases in variable generation from wind and
photovoltaic (PV) means that the supply curve will become more variable in the near future. A
more variable supply curve in turn, will present a challenge to transmission system operators
(TSO) as it will require more management. As electricity cannot be stored directly for long periods
of time, or in large scale, peaking facilities are becoming more important to cover potential fall-off
in production from wind. Gas turbines and HP are very effective as peaking facilities but the main
disadvantage with gas turbines is the large amount of CO2 they produce. For HP the main difficulty
is the limited availability of suitable sites because of the specific topographical layout requirements.
The most viable sites have already been developed and the still remaining technically viable sites
cannot be developed because of environmental concerns.
Another issue with a large installed capacity of variable wind power is wind curtailment. This
occurs when supply from wind production exceeds that which the grid can utilise. Some European
countries are already experiencing wind curtailment due to power systems not being flexible
enough to absorb excess electricity. Gas turbines and HP, although solving the potential
immediate loss from wind power, do not solve the issue of wind curtailment. Bulk EST solves both
production fall-off from wind and wind curtailment as these technologies can absorb excess
electricity when demand is low, and generate electricity when demand is high. Historically, bulk
ESTs have been used in connection with base load electricity production, such as nuclear power
or coal power, to allow constant power generation as the demand curve fluctuates.
There are several types of bulk ESTs in use today. Deliverable 2.1 of the stoRE project (Zach et
al., 2011) provides a summary of the current status, role and cost of energy storage technologies.
The most proven bulk ESTs to date are PHES and CAES with over 300 facilities (Deane et al.,
2010, Bogenrieder, 2006) and two facilities respectively installed worldwide. Both of these
technologies are mature and are used daily on a large scale.
In terms of benefit to society, PHES and CAES have an important role in optimising the physical
and financial functioning of the electricity market (Zach et al., 2011). The benefits to society result
from the provision of Beaudin et al. (2010):
black start capability
more flexibility of the grid
supply smoothing
security
spinning reserve
auxiliary reserve
21 / 99You can also read