Doing Sustainability - Strategic Audit Environmental management systems in Victorian Government 2012-13
←
→
Page content transcription
If your browser does not render page correctly, please read the page content below
Strategic Audit
Environmental management systems
in Victorian Government 2012-13

Doing
Sustainability
Published by the Commissioner
for Environmental Sustainability
Melbourne, Victoria, January 2014
©The State of Victoria, Commissioner
for Environmental Sustainability 2014

This publication is copyright.
No part may be reproduced by any process
except in accordance with the provisions of the
Copyright Act 1968.

Printed by: Impact Digital Pty Ltd
Units 3-4, 306 Albert Street, Brunswick,
Victoria 3056

Printed on recycled paper.

Authorised by the Victorian Commissioner
for Environmental Sustainability,
Level 22, 50 Lonsdale Street, Melbourne,
Victoria 3000

ISBN 978-1-921147-25-8

For further information contact the Office of the
Commissioner for Environmental Sustainability,
phone +61 3 9096 2424 or visit
http://www.ces.vic.gov.au

Disclaimer
This report may be of assistance to you and
every effort has been made to ensure that the
information provided is correct. It is based
largely on data and information provided by the
Victorian Government. The Commissioner for
Environmental Sustainability does not guarantee
that the report is without flaw of any kind or is
wholly appropriate for your particular purposes
and therefore disclaims all liability for any error,
loss or other consequence which may arise from
you relying on any information in this publication.

Design and publication notes
This strategic audit report is specifically designed
for on-line viewing and demonstrates my office’s
move to reducing paper based publications
and the need for printing. If you require a paper
version please contact the office.
Contents
From the Commissioner4

Section 16
Environmental performance                                                                       7
Whole-of-government assessment 2012-13                                                          7
      Greenhouse gas emissions                                                                  8
      Energy use in office buildings                                                            9
      Waste in office buildings                                                                11
      Water use in office buildings                                                            12
      Transport13
      Paper use                                                                                17

Section 218
Environmental management system case studies                                                   19
      Carbon neutrality at Zoos Victoria                                                       20
      Museum Victoria case study update                                                        29
      Victorian Electoral Commission moves into a new sustainable mode                         32
      Parks Victoria shining the light on the business case for environmental sustainability   36
      Public Record Office Victoria environment strategy update                                38
      State Library of Victoria sustainability report update                                   43

Section 346
Sustainability in major projects                                                               47
Sustainability Investment Guidelines                                                           49
      Overview – Statement of purpose                                                          50
      PART A – The Sustainability Investment Process                                           51
      1 ] CONCEPTUALISE Sustainability opportunities                                           51
      2 ] PROVE Sustainability and the business case                                           55
      3 ] PROCURE                                                                              66
      4 ] IMPLEMENT Delivery                                                                   68
      5 ] REALISE Monitor and review                                                           68
      PART B – Sustainability Investment: The Fact Sheets                                      69
      1 ] Energy reduction                                                                     70
      2] W
          ater efficiency                                                                     72
      3 ] Climatic resilience                                                                  74
      4 ] Materials resource efficiency                                                        76
      5 ] Transport and travel                                                                 78
      6 ] Health, well-being and productivity                                                  80
      7 ] Community, amenity and built form                                                    82
      8 ] Emissions and environment protection                                                 84
      9 ] Ecosystem services                                                                   86
      Source Material                                                                          88

Endnotes                                                                                       90

                                                                                                     3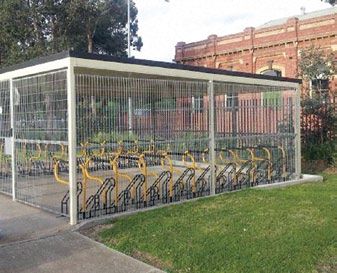
From the Commissioner

    From the Commissioner
    Each year the Office of the Commissioner for Environmental Sustainability publishes an environmental
    management systems audit of mandated government departments and agencies pursuant to the
    Commissioner for Environmental Sustainability Act 2003 (section 8). This is the fifth and final audit
    prepared subject to my commission.

    Sustainability reporting continues to evolve, develop in importance and provide significant insights
    about organisational efforts in respect of environmental best practice in both the public sector and
    private enterprise.

    Very recently the Boston Consulting Group and MIT Sloan Management Review published a report
    on ‘leading companies’ and their sustainability commitments – Sustainability’s Next Frontier. Walking
    the talk on the sustainability issues that matter most.1 Using case studies which involved Avis Budget
    Group, Domtar, Hilton Worldwide, Dell, Kaiser Permanente and GM-Honda, the reporters concluded
    that five critical attributes typify best practice. These include – leadership and high level management
    commitment; developing strategic processes; formulating sustainability business cases; measuring
    progress and effecting change to promote better outcomes.

    Whilst private enterprise responds to different stimuli than public administration, the desire for
    efficiencies, sustainable practices and the opportunistic advancement of environmental, economic and
    social co-benefits clearly underpins best practice.

    As corporate social responsibility increasingly drives environmental reporting across sectors it is
    encouraging to observe commitment to this work in government agencies. This has occurred in Victoria
    as a direct consequence of the operation of the Department of Treasury and Finance Financial Reporting
    Directions (24-24C) and as a function of good leadership in agencies where environmental reporting is
    adopted without being mandated.

    In the first section of this year’s audit the reader will find a comparative discussion of the environmental
    performance across the whole of government. Energy, waste, paper use, transportation, water
    consumption and greenhouse gas emissions are all considered and contrasted across portfolios.
    Comparative studies over time are made difficult by changes in departmental structures and by the
    different organisational requirements of agencies, but as measurement is a pivotal criteria for improved
    outcomes such studies remain both necessary and important.

    Key findings from the first section of this audit include:

    • In 2012-13 we have recorded a 10% reduction in total office-based greenhouse gas emissions since
      2009-10, with decreases in air travel, waste to landfill and vehicle use emissions.

    • Office-building emissions increased by 1.5% over this most recent reporting period as a result of the
      reduction in the purchase of green power.

    • Only 6% of electricity used in 2012-13 was purchased as green power, a 75% decrease since 2009-10.

    • 84% of office waste was recycled in 2012-13.

    • Executive fleet continues to make a negligible contribution to whole of government efforts to reduce
      emissions, as comparatively few executives, in leadership positions, have rejected the option of a six
      cylinder vehicle.

4
In this audit I continue the practice of augmenting the material required with
case studies of the environmental management systems of non-mandated
agencies. In this audit the

•   attainment of carbon neutrality by Zoos Victoria,
•   materials use and lifecycle work of Museum Victoria,
•   organisational culture of the Victorian Electoral Commission,
•   renewable energy innovations of Parks Victoria,
•   strategic implementation of Public Record Office Victoria,
•   ongoing efforts by the State Library of Victoria

are all considered for their illustrations of great leadership, team work,
strategic planning and practical, committed and continuing implementation.
Each provides a guide to better environmental practice in quite diverse and
non-mandated organisational structures.

I commend the organisations, their leadership and their
environmental management teams for this inspirational work

In this audit I also provide ‘Sustainability Investment Guidelines’ in respect
of major projects where benefits of a project might be understood as both
qualitative and quantifiable and where a cost benefit ratio is improved by the
incorporation of sustainability approaches.

These guidelines correspond with the Department of Treasury and Finance’s
Investment Lifecycle Guidance for High Value, High Risk projects. Green
Star Education V1 is used as an example of the potential available through
innovate approaches. Issues considered as sustainability investment streams
include energy reduction; water efficiency; climatic resilience; materials
resource efficiency; transport and travel; health, well-being and productivity;
community, amenity and built form; emissions and environment protection;
and ecosystem services. For an extended discussion of the way we conceive
of the environment as ecosystem services see the Victorian State of the
Environment Report 2013, published by my office in 2013, which is found at
www.ces.vic.gov.au under publications.

Fact sheets on each of the Sustainability Investment streams provide clear
illustration of the benefits attainable in terms of sustainability potential
in clear form.

Professor Kate Auty
PhD, MEnvSc, Dip Int Env Law (UNITAR), BA(Hons)LLB, GAICD
Commissioner for Environmental Sustainability, Victoria

                                                                                  5
Environmental performance SECTION 1 6
Section 1
Environmental performance
Since 2003, Victorian Government departments, the Environment Protection Authority (EPA) Victoria and
Sustainability Victoria have been required to implement environmental management systems (EMS). This
requirement was introduced with an office-based focus and was modelled on the ISO 14001 standard.2

The Financial Reporting Direction 24C enables the government to report on its office-based
environmental impacts in a consistent manner. The direction states that every year by 31 January, the
Commissioner for Environmental Sustainability will report to the Minister for Environment and Climate
Change on progress of defined entities EMSs.3

This section presents environmental performance and analysis for the 2012-13 period in accordance with
the reporting requirements of Financial Reporting Direction 24C.4 The whole-of-government performance
is aggregated from data provided in the annual reports of Victorian Government departments, EPA
Victoria and Sustainability Victoria.5

Whole-of-government assessment 2012-13
Reporting is a key component of any environmental management regime. It provides a way to evaluate
actions and track progress towards the objectives identified in environmental strategies, plans, policies or
programs.6

The Financial Reporting Direction 24C sets minimum reporting requirements for office-based activities
including:

• energy use – stationary energy: building consumption such as electricity (including green power),
  natural gas, LPG, heating oil, diesel and solid fuel
• waste production – which includes waste to landfill, waste sent for recycling and composted waste
• paper use – paper used for printing, photocopying and similar processes
• water consumption – including domestic water use, rainwater and reused water
• transportation – vehicle fleet energy use, air travel and staff commuting
• greenhouse gas emissions – those associated with building energy use, vehicle fleet use, air travel
  and waste production (any offsets purchased are also reported)
• procurement – a discussion of whether and how procurement activities are environmentally
  responsible.

The Financial Reporting Direction 24C also requires departments and agencies to measure and report
both relative resource use, such as energy consumption per floor area or per number of full time
equivalent employees, or greenhouse gas emissions per kilometres travelled, as well as total resource
use or ‘absolute’ consumption such as total energy use or total greenhouse gas emissions.

Both kinds of indicators are valuable. Relative resource use or ‘intensity’ indicators (often referred to as
efficiency indicators or business activity indicators) are valuable because they track an organisation’s
resource use independently of growth or organisational changes.7

Absolute indicators are important because they show how individual organisations are contributing to the
protection of global environmental limits.

                                                                                                               7
Environmental performance
GREENHOUSE GAS EMISSIONS
The total reported greenhouse gas emissions from Victoria’s Government agencies decreased annually
over the reporting period, falling by 10% between 2009-10 and 2012-13. The largest decreases were for
emissions related to air travel (54%), office waste to landfill (32%) and vehicle use (16%).
Energy use is the largest source of greenhouse gas emissions by Victorian Government agencies
accounting for 71% of emissions in 2012-13. Vehicle use and air travel accounted for 22% and 7% of total
emissions respectively, with office-based waste only accounting for 0.3% of total emissions.
Office building energy emissions increased by 1.5% over the reporting period. This increase is mainly
due to the reduced purchase of GreenPower which has negated gains made in energy efficiency over
the period (see Energy use in office buildings).
Table 1: Greenhouse gas emissions from Victorian Government agencies 2009-10 to 2012-13
Annual emissions (tonnes CO2-e) % change
2009-10 to
Emission sourceA 2009 -10 2010-11 2011-12 2012-13 2012-13
Office building energy 66,823 62,987 68,875 67,807 +1.5%
Vehicle use 24,955 23,458 20,301 20,936 -16%
Air travelB 13,958 14,911 6,894 6,433 -54%
Office waste to landfill 394 342 305 268 -32%
Total tonnes CO2-e 106,130 101,698 96,375 95,443 -10%
A
Data excludes emissions associated with water and paper use.
B
The multiplier used to calculate air travel emissions was revised in 2011-12. Consequently, emissions prior to 2011-12
appear to be over-estimated (see Air travel).
10% decrease in total office-based greenhouse
gas emissions since 2009-10
8Figure 1: Greenhouse gas emissions from Victorian Government agencies 2009-10 to 2012-13
120,000
100,000
Tonnes CO2-e
80,000
60,000
40,000
20,000
0
2009-10 2010-11 2011-12 2012-13
Office building energy Vehicle use
Air travel Office waste to landfill
ENERGY USE IN OFFICE BUILDINGS
Energy use in office buildings includes heating, ventilation and air conditioning, water heating, appliances,
lighting and installed equipment such as computers.
Reducing energy consumption not only provides an opportunity to decrease office running costs, but is
also important for the environment with energy use the largest source of greenhouse gas emissions by
Victorian Government agencies (see Greenhouse gas emissions).
Total energy use by Victorian Government agencies decreased by 12% between 2009-10 to 2012-13.
Energy intensity (measured as use per m2) also decreased by 5% over the same period.
Table 2: Energy use, intensity and GreenPower purchased for office buildings 2009-10 to
2012-2013
% change
2009-10 to
Energy 2009 -10 2010-11 2011-12 2012-13 2012-13
Total building energy (mj) 285,072,746 291,916,710 283,506,942 250,536,411 -12%
Building energy per m2 (mj) 419 430 420 399 -5%
Electricity purchased as
24% 26% 14% 6% -75%
GreenPower %
Note: Includes the Department of Primary Industries (now Department of Environment and Primary Industries) large ongoing
research component at many of its sites which accounts for a significant component of overall energy consumption.
9Environmental performance
GreenPower
A portion of electricity purchased by Victorian Government agencies includes renewable sources or
GreenPower. Green power generates less pollution than power from fossil fuels and produces no net
increase in greenhouse gas emissions.
Electricity purchased as GreenPower declined from 24% of the total electricity used in 2009-10 to only
6% in 2012-13, a reduction of 75% over the period. Several agencies ceased or significantly decreased
the purchase of GreenPower in 2012-13, continuing the large decline in the Victorian Government’s use
of GreenPower that began in 2011-12. The main reason for this decline is the removal of mandatory
purchases of GreenPower for government agencies.
This has resulted in an increase in the greenhouse gas emissions associated with electricity use despite
gains made in energy efficiency over the period (see Greenhouse gas emissions).
Figure 2: Energy use, intensity and GreenPower purchased for office buildings
2009-10 to 2012-2013
300,000,000 450
Building energy per m2 (mj)
400
250,000,000
Energy (megajoules)
350
200,000,000 300
250
150,000,000
200
100,000,000 150
26% 100
50,000,000 24%
14% 50
0 6% 0
2009-10 2010-11 2011-12 2012-13
Non-GreenPower (mj)
Electricity purchased as GreenPower (mj)
Building energy per m2 (mj)
Note: Includes the Department of Primary Industries (now Department of Environment and Primary Industries) large ongoing
research component at many of its sites which accounts for a significant component of overall energy consumption.
12% decrease in total energy use since 2009-10.
6% of electricity used in 2012-13 was purchased as
GreenPower, a 75% decrease since 2009-10.
10WASTE IN OFFICE BUILDINGS
Waste is separated into different waste streams in Victorian Government offices including waste to
landfill, waste (including paper) sent for recycling and composted organic waste. It should be noted that
variations in data reported strongly reflect changes in waste audit methodology.
Between 2009-10 and 2012-13, total waste generated decreased by 33% leading to a decrease in waste
to landfill by 41%. The recycling rate has remained mostly unchanged over the period, with 84% of total
waste recycled in 2012-13.
With the exception of 2010-11, waste per full time equivalent employee (FTE) has also remained fairly
constant over the period with each generating 93 kg of waste in 2012-13.
Table 3: Total waste generated, waste intensity and recycling rate 2009-10 to 2012-13
% change
2009-10 to
Waste 2009 -10 2010-11 2011-12 2012-13 2012-13
Total waste (kg) 1,945,566 1,531,606 1,626,564 1,296,823 -33%
Waste recycled (kg) 1,590,986 1,245,451 1,374,718 1,088,791 -32%
Waste to landfill (kg) 354,579 286,155 251,846 208,032 -41%
Recycling rate (%) 81.8 81.3 84.5 84.0 3%
Waste per FTE (kg) 94.8 76.1 98.6 92.8 -2%
Note: Excludes Sustainability Victoria data.
5,187 kg of waste produced in office buildings per working day in 2012-13.
84% of office waste was recycled in 2012-13.
11Environmental performance
Figure 3: Total waste generated, waste intensity and recycling rate 2009-10 to 2012-13
2,000,000 110
1,800,000 100
1,600,000 90
82%
80
1,400,000
Waste per FTE (kg)
85%
Total waste (kg)
70
1,200,000 81%
60
1,000,000 84%
50
800,000
40
600,000
30
400,000 20
200,000 10
0 0
2009-10 2010-11 2011-12 2012-13
Waste recycled Waste to landfill Waste per FTE
WATER USE IN OFFICE BUILDINGS
Office buildings account for as much as 10% of a capital city’s water use.8 Office-based water use
data includes water consumption for drinking, washing, cleaning and toilet flushing, and base building
requirements such as heating and cooling systems.
Departments and agencies have implemented a range of initiatives which have delivered reductions in
potable water use in office-based accommodation. These range from installing dual flush toilets and flow
restrictors on taps to harvesting and reusing water from roofs.
Total water use decreased by 17% between 2009-10 and 2012-13. Despite this, water use per FTE
increased by 2% over the same period.
Table 4: Total water use and water intensity across government offices 2009-10 to 2012-13
% change
2009-10 to
Water 2009 -10 2010-11 2011-12 2012-13 2012-13
Total litres 204,117,690 191,455,220 186,066,090 168,986,313 -17%
Litres per FTE 9,997 9,604 9,627 10,201 2%
12676,000 litres of water used in office buildings per working day in 2012-13.
41 litres of water used per full time equivalent employee per working day in 2012-13.
Figure 4: Total water use and water intensity across government offices 2009-10 to 2012-13
220,000,000 11,000
200,000,000 10,000
180,000,000 9,000
160,000,000 8,000
Litres per FTE
Total litres
140,000,000 7,000
120,000,000 6,000
100,000,000 5,000
80,000,000 4,000
60,000,000 3,000
40,000,000 2,000
20,000,000 1,000
0 0
2009-10 2010-11 2011-12 2012-13
Total litres Litres per FTE
TRANSPORT
Vehicle fleet
Vehicle environmental performance
Managing the environmental performance of the motor vehicle fleet primarily involves reducing
greenhouse gas emissions associated with travel by for example, improving the efficiency of fleet
operations and reducing the total number of kilometres travelled.
Victorian Government vehicle use efficiency has continued to improve with reductions in vehicle energy
(16%), kilometres travelled (13%) and CO2 emissions per 1,000 km (4%) between 2009-10 and 2012-13.
Noting however, a 3% increase in vehicle energy use and emissions compared to the previous year.
Vehicle use is most easily reduced by switching to more sustainable transport (walking, cycling and
public transport), as well as alternatives to travel, such as video and teleconferencing.
13Environmental performance
Table 5: Motor vehicle use, intensity and emissions 2009-10 to 2012-13
% change
2009-10 to
Vehicle use 2009 -10 2010-11 2011-12 2012-13 2012-13
Vehicle energy (mj) 355,344,560 335,670,108 288,290,895 297,922,930 -16%
Vehicle kilometres 103,007,874 100,887,187 95,753,012 89,820,973 -13%
Vehicle kilometres per
412,031 403,549 383,012 359,284 -13%
work day
Vehicle tonnes CO2 per
0.24 0.23 0.21 0.23 -4%
1,000 km
13% decrease in kilometres travelled in vehicles since 2009-10.
359,284 km vehicle travel per working day in 2012-13.
Figure 5: Motor vehicle use 2009-10 to 2012-13
110,000,000 450,000 Vehicle kilometres per work day
100,000,000 400,000
90,000,000
Vehicle total kilometres
350,000
80,000,000
300,000
70,000,000
60,000,000 250,000
50,000,000 200,000
40,000,000
150,000
30,000,000
100,000
20,000,000
10,000,000 50,000
- -
2009-10 2010-11 2011-12 2012-13
Vehicle total kilometres Vehicle kilometres per work day
14Victorian Government vehicle fleet mix
The size of the government vehicle fleet decreased by 11% between 2009-10 and 2012-13. In addition,
the overall composition continues to move to a lower intensity fleet with decreases in six-cylinder (13%)
and four-cylinder (35%) petrol vehicles, and increases in hybrid vehicles (26%) over the period.
The shift to more fuel efficient passenger vehicles has resulted in a reduction of the average vehicle
emission rate (based on manufacturer specifications) from 215 g CO2/km in 2009-10 to 182 g CO2/km in
2012-13, a decrease of 15%. The higher actual average emission intensity reported (230 g CO2/km) could
be due to vehicle selection choices and/or the way a vehicle is driven.
The executive fleet, due to its consistent profile, specifically its high proportion of 6 cylinder vehicles, is
making negligible contribution to this reduction.
Figure 6: Victorian Government motor vehicle fleet composition and average
vehicle greenhouse intensity 2009-10 to 2012-13
4,000 220
3,500
Number of vehicles
210
3,000
g CO2 /km
200
2,500
2,000 190
1,500
180
1,000
170
500
0 160
2009-10 2010-11 2011-12 2012-13
6 Cylinder 4 Cylinder LPG LPG dual fuel
Diesel Electric Hybrid Ave g CO2 /km
Figure 7: Victorian Government motor vehicle composition for operational and
executive fleets 2012-13
1,400
39%
1,200
Number of vehicles
1,000
25%
800
600
400 11% 11%
8%
200
5%Environmental performance
Air travel
Air travel information is obtained from the whole-of-government travel services contract, and covers
domestic and international flights.
Total government air travel distance decreased by 41% between 2009-10 and 2012-13.
Emissions related to air travel also decreased by 54% over the period. The calculation of emissions
from air travel is complex and continually evolving. In addition to the reduction in total kilometres travelled,
a change to the multiplier used for data 2011-12 onwards has contributed to the downward trend in
emissions associated with air travel (see previous strategic audit report).9
Table 6: Air travel; total kilometres travelled and attributed emissions 2009-10 to 2012-13
% change
2009-10 to
Air travel 2009 -10 2010-11 2011-12 2012-13 2012-13
Total air travel kilometres 32,204,449 29,275,013 20,765,631 19,138,997 -41%
Air travel kilometres
128,818 117,100 83,063 76,556 -41%
per work day
41% decrease in total air travel kilometres since 2009-10.
76,556 km travelled per working day in 2012-13.
Figure 8: Air travel; annual and per work day total kilometres travelled 2009-10 to 2012-13
35,000,000 130,000
Air travel per work day (kilometres)
120,000
Total air travel (kilometres)
30,000,000 110,000
100,000
25,000,000 90,000
80,000
20,000,000
70,000
60,000
15,000,000
50,000
10,000,000 40,000
30,000
5,000,000 20,000
10,000
- 0
2009-10 2010-11 2011-12 2012-13
Total air travel kilometres Air travel kilometres per work day
16PAPER USE
Data on the amount of paper purchased continues to be regarded as reliable, with stationery suppliers
providing robust data to departments and agencies.
Total paper use declined by 19% between 2009-10 and 2012-13. However, the average paper used
per full time equivalent employee has remained steady over the past few years at around 14 reams per
annum.
As noted in the previous strategic audit, the increased use of electronic communication tools by
government (online publishing and social media) is expected to reduce the amount of paper used (copy
paper and paper for external publications). While not impact free, this decrease will produce a further
decrease in the environmental impacts of paper use and a reduction in operational costs.
Table 7: Total paper use and use per full time equivalent employee 2009-10 to 2012-13
% change
2009-10 to
Paper 2009 -10 2010-11 2011-12 2012-13 2012-13
Total paper use (reams) 391,506 387,986 367,493 318,421 -19%
Paper use per FTE (reams) 14.3 14.1 14.2 13.6 -4%
Figure 9: Total paper use and use per full time equivalent employee 2009-10 to 2012-13
450,000 15
14
400,000 13
Total paper use (reams)
Paper use per FTE (reams)
350,000 12
11
300,000 10
9
250,000 8
200,000 7
6
150,000 5
4
100,000 3
50,000 2
1
0 0
2009-10 2010-11 2011-12 2012-13
Total paper use (reams) Paper use per FTE (reams)
159 million sheets of paper used in 2012-13.
27 sheets of paper used per full time equivalent employee per working day in 2012-13.
17Environmental management system case studies SECTION 2 18
Section 2
Environmental management
system case studies
In the time I have been the Commissioner for Environmental Sustainability in Victoria my office has
been reporting on the organisational environmental management of various agencies.

There are a great many agencies across Victoria which are not required to report pursuant to the
Financial Reporting Direction 24C. They nevertheless do provide reports to the Victorian public
about their efforts. They do this not only to showcase good practice and demonstrate economic and
environmental co-benefits but also to provide examples of leadership within their organisational
contexts and more broadly.

I have been pleased to celebrate some of these non-compulsory achievements.

In this strategic audit I have asked some agencies to again provide us with a report on their
activities and to update the Victorian public on their progress in achieving better organisational
environmental outcomes.

The organisations we report on here would regard themselves as leaders but they also see
themselves as broadly representative of an ethic of care about environmental management systems.
I commend their efforts.

I also thank their environmental management system coordinators and staff for their participation
in this exercise.

In doing so it is important to acknowledge all the environmental management coordinators across
the Victorian public service for the hard work they do in bringing the public sector into line with best
practice as it is unfolding in the private sector (upon which we have also reported in the time I have
been the Commissioner).

                                                                                                           19
Environmental management system case studies
CARBON NEUTRALITY AT ZOOS VICTORIA
2011 Refreshing our memory – Zoos Victoria does:
• proactive training and education – building capabilities and becoming adaptable
• engage agents of change and give them authority to act
• actively promote organisational commitment to a culture of environmental sustainability
• align and integrate through ISO certification and a carbon neutrality target
• source outside information and collaborate with external constituents
2013 Carbon Footprint and Carbon Neutral Certification
The impacts of climate change, unprecedented population growth and dramatic loss of habitat have
signalled the rapid rise of the environment as a priority in global affairs. Globally, organisations and
individuals are changing their behaviour to reduce their impact on the environment.
Zoos Victoria has witnessed first-hand the devastating impacts of climate change.
Some of the species in the Zoos collection have been brought to edge of extinction as a result
of human activity.
In 2012, Healesville Sanctuary initiated a captive-breeding program to prevent the extinction of the
last lowland Leadbeater’s Possums at Yellingbo Nature Conservation Reserve. This population has
declined by 62% during the past 10 years, and now only 40 individuals remain.
Leadbeater’s Possum was one of the species most severely impacted by the 2009 Black Saturday
Bushfires. In the Central Highlands, 45% of the best montane habitats for the species was burnt.
The survey results following the fire indicate the species is far more fire-sensitive than was previously
recognised, with no possums persisting at sites burnt in 2009, regardless of fire severity. The Black
Saturday fire wiped out a major population stronghold present on the Lake Mountain plateau.
20For the Zoo to be able to protect these species and inspire its two million visitors to take action to save
wildlife, it is imperative that its executive and staff do everything in their power to reduce their own
environmental impact.
It is for this reason that the three Victorian zoos have embarked on becoming the world’s first certified
carbon neutral zoos.
This goal was accomplished in March 2013 – on target.
Since 2008, Zoos Victoria has implemented an overarching Environmental Policy and Strategy to
manage all environmental impacts associated with operating its three properties (Melbourne Zoo,
Werribee Open Range Zoo and Healesville Sanctuary). It was this policy and a desire to reduce the
overall environmental impact of the organisation that led to the Zoo to actively strive for carbon-neutrality.
The policy and strategy, including the establishment of targets, resulted in a concerted effort across the
three properties to avoid, reduce and offset carbon emissions.
Zoos Victoria’s emissions come from a variety of sources including:
• heating and cooling
• lighting
• waste
• travel and transportation of animals and staff
• water use
• general equipment maintenance.
In 2012, it was calculated that the three zoos contributed 14,913.84 tonnes of greenhouse gas emissions for the
financial year 2011-12. In 2013 the Zoo’s emissions reduced to 14,730.76 tonnes (1.23% reduction) of CO2-e.
This is the equivalent of over 5,000 cars on Australian roads.
An important part of Zoos Victoria’s carbon neutral achievement is to engage with the 2 million visitors
the Zoo sees each year as well as other zoological institutions around the world to provide a working
example of how they too can become more environmentally sustainable. Zoos Victoria also seeks to
motivate visitors to consider how individual actions can make a difference.
Attaining the Australian Government’s National Carbon Offset standard (NCOS)
In March 2013, Low Carbon Australia certified Zoos Victoria’s Melbourne Zoo, Werribee Open Range
Zoo and Healesville Sanctuary as carbon neutral in compliance with the Australian Government’s
National Carbon Offset Standard (NCOS).
This achievement is a world first for any zoo.
21Environmental management system case studies
Beyond attainment of the carbon neutrality standard for Zoos Victoria the executive and staff hope to
inspire others to take action to reduce their impact on the environment.
As part of Zoos Victoria’s commitment to becoming carbon neutral, the organisation was required
to define its organisational boundary in accordance with NCOS specifications. The Zoos adopted an
operational control consolidation approach to do this, including all corporate groups, on-site facilities and
catering services.
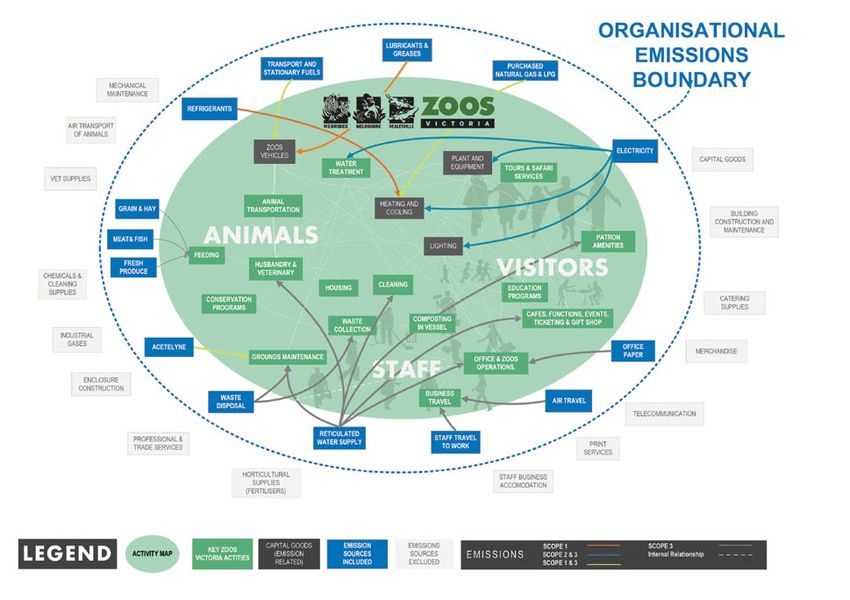
Zoos’ emissions boundary definition included all scope 1 & 2 emissions and scope 3 emissions from
business air travel, staff travel to and from work, waste to landfill, energy supply, paper use, reticulated
water and the supply of animal foods. Scope 3 emissions were included on the basis of materiality
and measurability. This is challenging work but necessary for the accreditation.10 Frequently Scope 3
emissions are discounted because of the degree of difficulty in tabulating them. Zoos Victoria assumed
the responsibility of meeting that challenge and the accreditation affirms its commitment.
The diagram below identifies the Zoos’ key activities (applicable and measured at all sites) together with
the breakdown of emission sources and the organisational boundary for emissions.
Figure 10: Zoos Victoria’s Carbon emissions
22Table 8: Zoos Victoria’s emissions 2012-13
Scope11 Emission source t CO2-e12
1 Petrol for vehicles 100.20
1 Diesel for vehicles 233.83
1 B20 diesel for vehicles 4.63
1 LPG for vehicles 5.09
1 Refrigerant losses 78.88
1 Acetylene 0.01
1 Greases and lubricants for transport 15.20
1 Natural gas usage for buildings 669.49
1 LPG usage for buildings 18.36
2 Purchased electricity for buildings 8,359.98
3 Purchased electricity for buildings (fuel extraction, production & transport 1,078.40
and transmission & distribution losses)
3 Natural gas usage for buildings (extraction, production & transport) 50.87
3 LPG usage for buildings (extraction, production & transport) 1.53
3 Petrol for vehicles (extraction, production & transport) 7.94
3 Diesel for vehicles (extraction, production & transport) 17.75
3 B20 diesel for vehicles (extraction, production & transport) 0.34
3 LPG for vehicles (extraction, production & transport) 0.42
3 Municipal solid waste 1,084.39
3 Air travel 146.80
3 Purchased animal food 1,645.89
3 Purchased office paper 5.25
3 Employee travel to and from work 711.52
3 Reticulated water supply 502.96
3 Acetylene 0.001
3 Offset Flights (-9.00)
Total carbon footprint in tonnes CO2-e 14,730.76
23Environmental management system case studies
Emission Reduction
Zoos Victoria use an ISO 14001: 2004 Certified Environmental Management System (EMS) to manage
and reduce carbon impacts.
Through the EMS, environmental impacts were identified and improvement projects or programmes
developed. Due to the nature of the work at the Zoo and the size of the carbon footprint, a number of
measures were required to reduce emissions. These measures included:
• waste management
• energy efficiency
• renewable energy
• green procurement
• staff campaigns
• water efficiency.
Adopting these measures helped Zoos Victoria reduce emissions by 2,292 tonnes each year.
Table 9: Measures adopted by Zoos Victoria included:
Emission reduction measures Emission quantity
(Tonnes CO2-e)
Lighting efficiency 261
Heat pump hot water 168
VSD Pumps 133
Solar PV 9
Reflective Paints 3
HVAC upgrade 34
Computer switch off campaign 91
Butterfly House – double glazing 80
In-vessel composter 960
Greener fleet ‘car’ vehicle 12
Green Fuel 6
Water project 289
Other Waste Projects 236
Insulation 9
Total quantity of emissions reduced 2,292
This is the equivalent of removing almost 1,000 cars from the
road. These measures also save Zoos Victoria $266,000 per year.13
24Some details on the measures include:
Waste management
At Zoos Victoria, the aim is to contribute zero waste to landfill by ensuring all recyclable materials are
separated and reused, recycled or composted. The Zoo’s animals and visitors contribute to the daily
waste. Some sites contribute considerably more than others – for instance keepers collect over 800
kilograms of Elephant dung every day.
At Melbourne Zoo, animal waste is collected and composted together with visitor and horticulture waste.
The zoo has a third organics waste bin system near food outlets dedicated to collecting food scraps and
compostable food packaging material. This material is composted on-site through an aerobic in-vessel
composter called Hot Rot. This composter diverts approximately 800 tonnes of organics waste from
landfill, potentially reducing the generation of up to 960 tonnes of CO2-e.
Melbourne Zoo’s composting system was a finalist in the
2012 Melbourne Awards for best practice in sustainability.
Energy efficiency
Zoos Victoria has implemented a number of energy efficiency programs to reduce greenhouse
gas emissions.
These include
• the introduction of energy efficient lighting retrofits using LEDs and T5 fluorescent lamps
throughout the zoos,
• energy efficient heating ventilation and air conditioning systems,
• efficient infrared heating and,
• IT improvements to further reduce carbon emissions.
Melbourne Zoo also upgraded the glass roof of the Butterfly House to insulated glazing units (double glazing)
significantly reducing the amount of gas needed to keep the exhibit at a constant 28 degrees Celsius.
Renewable energy
Hot water heat pumps are used extensively across the three Victorian zoos.
At Melbourne Zoo’s retail shop, a 4kW solar PV powers all the lighting in the shop.
At Healesville Sanctuary’s animal hospital, a 12 kW solar PV is installed to provide clean energy
to the hospital.
A 70 kW solar PV system was foreshadowed for the Melbourne Zoo site. This has now been expanded
to 107kW but with the upgrade came some connection issues. The project is now divided into four
smaller projects under 30kW projects each but totalling 107 kW. This will come on line in early 2014.
A 20kW system is also coming on line for Werribee Open Range Zoo. When all the Zoo’s systems are
up and running the reduction in greenhouse gas emissions will be 260 tonnes CO2-e and the production
of green power will be 203 MWh each year.
25Environmental management system case studies
Water management
At Melbourne Zoo, rain water harvesting (covering 85% of the zoo grounds) is collected with water from
animal cleaning/husbandry and pumped into the water treatment plant producing Class A recycled water.
Through 4.5 kilometres of reticulation pipes this recycled water is used for irrigation, flushing toilets, filling
water bodies and animal wash downs. The plant currently recycles approximately 73ML of water per year.
Carbon and biodiversity offsets
Zoos Victoria’s carbon footprint, after all emissions reduction measures, amounted to 14,730.76 tonnes
CO2-e in financial year 2012-13.
As a leading conservation organisation, Zoos Victoria supports carbon offsets that have biodiversity and
conservation outcomes. Four carbon/biodiversity offset projects in Tasmania, Borneo, Kenya and Peru
(see below) have been selected and carefully chosen to align with the organisation’s conservation work.
These offsets have achieved Verified Carbon Standard (VCS) which means that each project has been
rigorously and independently audited to ensure they achieve real environmental benefits.
Tasmanian Native Forest Protection Project
This is the first Australian project to be validated under the Verified Carbon Standard (VCS). It is located in
the Central Highlands of Tasmania and protects privately owned land with native forest cover from logging.
Zoos Victoria purchased 5,972 tonnes of CO2-e offsets from this project. This purchase works to both
improve forest management in the central Tasmanian highlands and secure Tasmanian Devil habitat.
This purchase offsets 40% of Zoos Victoria’s carbon footprint.
Borneo Rainforest Rehabilitation Project
This project is situated in Sabah, Malaysia. It prevents 140,000 tonnes of greenhouse gas emissions
each year and it also enables the restoration of once logged and harvested land.
Zoos Victoria purchase of 2,986 tonnes of CO2-e offsets supports the United Nations Reducing
Emissions from Deforestation and Degradation (REDD) Rainforest Rehabilitation Program which operates
across previously logged dipterocarp forest in eastern Sabah. The program generates measurable
outcomes for orang-utans whilst the purchase offsets 20% of Zoos Victoria’s carbon footprint.
The Kasigau Corridor REDD Project – Phase II The Community Ranches
This projects aims to protect 200,000 hectares of forest and wildlife in the area. It also protects the
livelihood of the communities that live in the area by providing jobs, healthcare and education for the
community. The protected area is home to a diverse population of mammal and birds with important
populations of IUCN Red List species such as; Grevy’s Zebra, Cheetah, Lion and African Wild Dog.
A purchase of 2,986 tonnes of CO2-e offsets was made by Zoos Victoria representing 20% of Zoos
Victoria’s carbon footprint.
26Madre de Dio Amazon REDD project
The project area is located less than 30 km from the new inter-oceanic road uniting Brazil with the Peruvian
ports, in the Vilcabamba region. The project protects one of the most biodiverse areas in the world.
A purchase of 2,986 tonnes of CO2-e offsets was made by Zoos Victoria, supporting a REDD program
which aims to conserve forest habitat in the Madre de Dios in the Peruvian Amazon. Species such as
Jaguars, macaws and peccaries are protected by this program and contemporaneously this purchase
offsets 20% of Zoos Victoria’s carbon footprint.
Summary
To obtain carbon neutrality, Zoos Victoria underwent three years of intensive work to reduce its
carbon footprint.
Zoos Victoria has achieved its goal through:
• resource efficiency programs
• receiving third party certification from the National Carbon Offsetting Standard (NCOS) which is based
on internationally accepted carbon accounting and neutrality standards.
In addition to the work already being conducted, Zoos Victoria is turning its attention to further reducing
its carbon footprint by exploring:
• cogeneration
• solar
• further resource efficiencies.
The attainment of the certification milestone is part of Zoos Victoria’s commitment to inspire
millions of visitors to:
• live more sustainably
• protect wildlife and the environment for future generations.
27Environmental management system case studies
Awards
Zoos Victoria’s Carbon Neutrality was a finalist in the UNAA World Environment Day Awards 2013
for Best Specific Environmental Initiative and received a Special Commendation for this achievement.
Zoos Victoria’s Carbon Neutrality was also a finalist in the Banksia Awards 2013 in the
Leading in Sustainability – Large Organisation category and the Melbourne Awards 2013 in
the Contribution to Sustainability by a Corporation category.
The Zoo is also in the process of engaging other zoological institutions to encourage them to commit to
reducing their overall environmental footprint to assist conservation efforts.
Zoos Victoria has been recognised by the Zoos and Aquarium Association (ZAA) and the World Association
of Zoos and Aquarium (WAZA) for leading the way in its local sustainability and conservation strategy.
The CEO of Zoos Victoria, Jenny Gray, and all her remarkable team adhere to the following ethic:
“We are proud that we are the first zoo in the world to be
certified carbon neutral and hope that this will inspire
other zoos to take action.
Throughout the world, zoos experience first-hand the
devastating impacts of climate change and habitat destruction
and should therefore be at the front line of the fight to reduce
carbon emissions.
We will continue to promote our sustainability message
and keep looking at new ways to develop renewable energy
options on site to provide green power and further energy
efficiency savings for our zoos.”
28MUSEUM VICTORIA CASE STUDY UPDATE
2011 Refreshing our memory – Museum Victoria does:
• promote understanding of co-benefits and development of an organisational strategy
• value organisational culture, cross-cutting committees and change agents
• situate sustainability on rigorous foundations
• implement and recognise
• attain co-benefits from environmental action
• value leadership and promote a healthy contagion of ideas and practice
• build on success and share knowledge
Museum Victoria has been collecting, documenting and researching patterns of change in the natural
and social environment for more than 150 years.
Contemporaneously with core business, the Museum’s exhibitions, programs and online initiatives
provide a unique platform to increase awareness about the environment and sustainable practices.
Beyond its core in office work Museum Victoria has conducted a number of environmental ‘blitzes’
across the state – on land and in the marine environment – in partnership with the community,
Indigenous people on traditional country, scientists and Parks Victoria and Trust for Nature. Numerous
instances of new species and ecological communities have been located by this work. In undertaking
this work Museum Victoria exemplifies best practice in public exhibition work and this work has been
highly commended in many settings.
Museum Victoria is also committed to implementing eco-sustainable practices within its venues,
supported by a culture of continuous improvement.
Sustainable exhibition design initiative
Museum Victoria’s sustainable exhibition design initiative commenced in 2008. Each new exhibition
delivered since then has been used to trial new ideas and embed the lessons of previous projects.
The current long-term exhibition development project, opened at Scienceworks in December 2013, is
Think Ahead. http://museumvictoria.com.au/scienceworks/whatson/current-exhibitions/think-ahead/
about-the-exhibition/
This project is implementing ‘life cycle thinking’ principles through the reuse of existing materials, the use
of low-impact materials and the minimisation of waste.14
Wherever possible the exhibition design reuses existing showcases, rather than commissioning the
fabrication of new ones. Of the 32 showcases required for Think Ahead, all but one will be constructed
using existing showcases from a previous exhibition. This presents a significant environmental and cost
saving – financial and environmental co-benefits.15
Where new materials are being incorporated, the Museum is working to minimise impacts.
The use of steel is being avoided in the exhibition, except where structurally necessary. Where MDF
cannot be substituted, E0 Australian-made MDF is being specified in the construction of the built form.
E0 means there is no harmful off-gassing associated with the material. Glass barriers are specified rather
than acrylic, as glass is recyclable and more durable.
As the project proceeded into the development and documentation phases, design templates and
layouts incorporated efficient production methods that minimised error and allowed material lengths to
be specified in a way that reduced waste and off-cuts.
29Environmental management system case studies
Exhibition staff continue to invest time in the research and testing of new methods of production, such as
sign-writing and the development of low-energy multimedia products.
House Secrets, the exhibition being de-installed to make way for Think Ahead, has been
recycled. Various interactives from this exhibition were dismantled and reused as parts by the
Scienceworks workshop. The remaining sections of the exhibition have been demolished in a way
that separates and recycles materials wherever possible.
Other initiatives
Greener Government Buildings Program – environmental performance contracting
Museum Victoria has commenced working with the Greener Government Buildings Program to establish
an Energy Performance Contract (EPC) for its property portfolio.
We explored the benefits of deploying contracts to change outcomes. The energy and water
conservation scope of this program in the 2012 strategic audit cited benefits as:
‘Over the longer term, the Greener Government Buildings Program is projected to reduce
government’s greenhouse gas emissions by at least 20% by 2020 and deliver over one billion
dollars in accumulated cost savings.’ (p28)16
The Greener Government Buildings Program17 will be used to procure and install energy-efficient plant
and equipment, enabling the Museum to deliver on its environmental targets. This Energy Performance
Contract project was the first step in the Greening the Arts Portfolio Program initiated by Arts Victoria
Air temperature possibilities
A review of environmental parameters in collection stores commenced in 2011–12.
The pilot program tested the effects of putting the HVAC system, which controls air temperature and
relative humidity, into stand-by mode for prescribed periods of time in specific parts of Melbourne
Museum’s collection stores.
The project explores possibilities which arise from the tension between the imperative to meet
environmental parameters for the preservation of collections and the need to ensure the minimum
investment of energy and cost in their preservation.
Fleet electrification
Two electric vehicle charging stations were installed in the Melbourne Museum car park as part of
the Victorian Electric Vehicle Trial18 in September 2011. The aim of the trial was to better understand
the processes, timelines and barriers for the transition to electric vehicle technologies, with a view to
positioning Victoria as an EV-friendly location.19
30Museum Victoria is an active participant in the program and has received an electric vehicle on loan
every year since commencement.
Environmental demonstration exhibitions
Museum Victoria continues to present exhibitions and programs that engage the public in issues related
to the environment and sustainability.
Recent programs include:
• Bugs for Brunch, presented as part of the 2012 Melbourne Food and Wine Festival, encouraged
participants to challenge their preconceptions and think about insects as a high-protein and low-fat
food source that leaves a small environmental footprint.
• Our Water20, exhibited at Scienceworks in early 2012, enabled visitors to explore water from urban,
agricultural, industrial and environmental perspectives and delve into the different ways of using and
preserving this vital resource.21
• The Australian premiere of Coral: Rekindling Venus22 took place at the Melbourne Planetarium on
5 June 2012, World Environment Day. This ground-breaking full-dome film captures underwater life
and uncovers a complex community living in the oceans most threatened by climate change.23
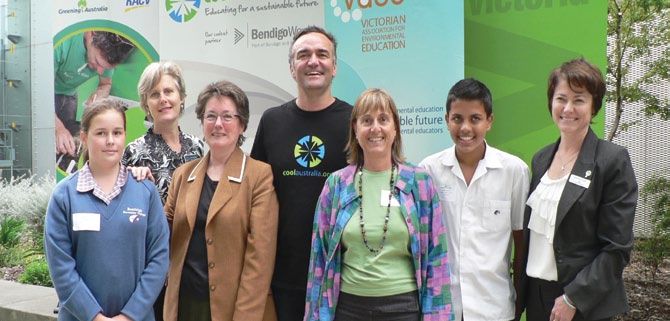
Partnerships for public information and celebration of achievements
Greening Australia24 has partnered with Melbourne Museum each year since 2010 to present the Toolbox
for Environmental Change..
This is one of the largest and best-attended conferences for Victorian teachers and it aims to identify
ways in which schools and their communities can act together.
The conference theme for 2013 was ‘Sustainable Learning Partnerships’.
As Commissioner I was pleased to provide the keynote to this conference. I regard recognition
ceremonies such as this as pivotal to changing attitudes and promotion of best
environmental practice.
3 Sustainable
Learning
Partnerships,
2013
31Environmental management system case studies
VICTORIAN ELECTORAL COMMISSION MOVES
INTO A NEW SUSTAINABLE MODE
2011 Refreshing our memory –
The Victorian Electoral Commission (VEC) does:
• empower staff to make change
• understand and promote co-benefits and flow-on effects from better environmental practices
• sees its corporate plan as a driver of environmental sustainability in organisational culture
• looks to new opportunities and collaboration with stakeholders
The VEC is an independent and impartial statutory authority established under Victoria’s Electoral Act
2002. Its main function is to conduct Victorian State elections, local council elections, certain statutory
elections, and commercial and community elections.
The VEC has upgraded to more sustainable premises and
reduced its energy use and its waste
In May 2011, VEC moved to a 5 star NABERS25 building at 530 Collins St, near its previous headquarters
in the Melbourne CBD. This location was highly desirable for the VEC for many reasons including its
NABERS rating.
VEC has since discovered its retail power bills have dropped nearly 80% offset by the reduced cost
of building ‘core’ power which is created in the co-generation equipment.
In addition, VEC enjoys a third more floor space than its previous tenancy with the added bonus of being
on one level instead of being split across two levels, as in the past. This provides greater capacity for
organisational coordination and streamlines environmental management efforts.
This new building also collects and processes:
• organic waste
• comingled desk waste
• a broad range of recyclables.
VEC was able to take advantage of this and reduce its landfill rubbish volume to under a
tonne for a whole year for nearly 80 permanent staff. VEC has a new goal to reduce this figure by
50%, with its own waste audits indicating this is a reasonable goal.
New and additional collaborative opportunities for
environmental best practice
For some time the VEC has been effecting environmentally sustainable changes in its practices and
these have both reflected operations in, and spread into, other jurisdictions.
As the Commissioner for Environmental Sustainability I have been able to refer other organisations to
the VEC, to encourage them to gain insights from the work being done at the VEC. The team at the VEC
have been generous with their time and ideas and I commend them for this collaboration, such a pivotal
part of the process to getting better environmental outcomes.
32Examples of continuing and proposed environmentally sustainable strategies which deliver co-benefits of
efficiency and cost savings include the following:
• the use of new unbleached cardboard furniture and equipment for temporary election offices –
as many as 23,000 units of cardboard furniture are already reused for up to eight years, after which
they are recycled
• electronic device sharing arrangements with other states and territories in the conduct of elections –
this includes up to 1000 laptops and other devices
• careful consideration and planning of a more environmentally sustainable use of transportation
for election materials across the state to reduce 12 million logistic kg kms
• paper reduction strategies which include
-- reducing the amount of paper sent to election offices for use during elections,
-- moving instruction manuals to an on-line format instead of printed copies and
-- providing electronic copies of reports where possible.
Empowering staff to make change
The VEC values and promotes knowledge, learning and collaboration; it actively works to empower
and engage staff and the community in decisions of importance to all of us.
The ResourceSmart group uses a GreenFlash logo to promote ideas to the organisation via email,
as well as regularly changed ‘tips & tricks’ signage around the organisation and short humorous
presentations at staff meetings.
Staff are also encouraged to record improvements centrally so that these are readily available and
visible to all.
Table 10: Some examples include:
Local
Making an accompanying CD to
Government Saves around 150 pages of
carry 9 booklets, list of candidates
Activity printing for each copy.
and copy of whole report.
Report
Halved print run, enable single
Annual
Electronic book version. page printing and reduce need to
Report
z print when accessing online.
33Environmental management system case studies
1. Encouraging participants to view
forms and other documents on-screen
during training, rather than printing
Election them, whenever practicable. Reduces paper per Senior Election
official
Official (SEO) per seminar.
training 2. Re-use plastic name tag holders
MANY times, rather than people taking
them home after their seminar.
Very little use of paper, both
Management Electronic send to Management Team
the Minutes and Agenda can be
Minutes for Minutes and Agenda.
screened during the Meetings.
Saves using ATO forms (with 5
Payroll Electronic payslips and leave forms. pages per form) for 16,000 officials.
Total of 80,000 sheets of paper.
Recognition by the leadership team
The new Victorian Electoral Commissioner, Warwick Gately AM, was pleased to discover the VEC’s
many sustainable initiatives when he commenced at the VEC on 29 April 2013.
The VEC ResourceSmart Committee formally reports to management and has recently gained an annual
funding commitment for its various initiatives.
Comment from the Commissioner:
“Many VEC staff see their work as a social enterprise and so it is a natural
extension that staff are also concerned about the environment.
The ResourceSmart Committee is a recognised and supported forum
within the Commission structure and the Committee has an ongoing
member of senior management to facilitate change in the organisation.
Elections are a very large logistic enterprise but they are also done
efficiently and this means continual review of how resources are
consumed and disposed of for economic reasons and for reduced
environmental footprint.
Paper products and transport are the main resources VEC consumes
and developing new kinds of automation to reduce consumption remains
under active consideration.
In recognising the Commission’s work in sustainability, ResourceSmart
has just received its gold certificate in waste management.
34You can also read


