FOOD AND FIBRE AUSTRALIA'S OPPORTUNITIES - A REPORT OF A STUDY BY THE AUSTRALIAN ACADEMY OF TECHNOLOGICAL - AUSTRALIAN ...
←
→
Page content transcription
If your browser does not render page correctly, please read the page content below
FOOD AND FIBRE
Australia’s Opportunities

      A REPORT OF A STUDY BY THE
AUSTRALIAN ACADEMY OF TECHNOLOGICAL
   SCIENCES AND ENGINEERING (ATSE)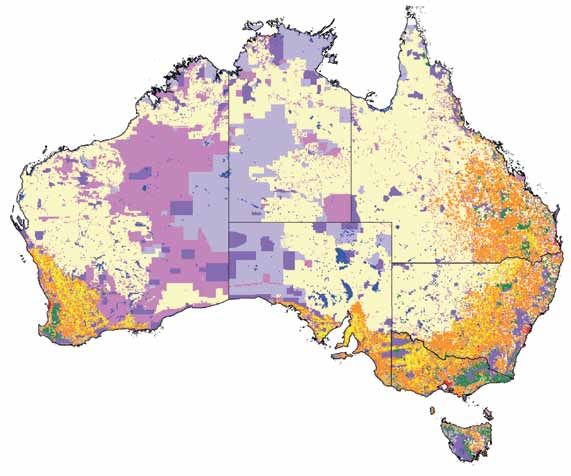
FOOD AND FIBRE
    Australia’s Opportunities

Australian Academy of Technological Sciences and Engineering (ATSE)

                     Australian Research Council

                          march 2014
FOOD AND FIBRE Australia’s Opportunities Report of a study by the Australian Academy of Technological Sciences and Engineering (ATSE) ISBN 978 1 921388 28 6 © Australian Academy of Technological Sciences and Engineering (ATSE) This work is copyright. Apart from any use permitted under the Copyright Act 1968, no part of it may be reproduced by any process without written permission from the publisher. Requests and inquiries concerning reproduction rights should be directed to the publisher. Date of Publication: March 2014 Publisher: Australian Academy of Technological Sciences and Engineering Level 1/1 Bowen Crescent Melbourne Victoria 3004 Australia GPO Box 4055 Melbourne Victoria 3001 Australia Telephone +613/03 9864 0900 Facsimile +613/03 9864 0930 Principal Author: Professor Snow Barlow FTSE This work is also available as a PDF document on the ATSE website at www.atse.org.au This project was funded by the Australian Research Council’s Linkage Learned Academies Special Projects (LASP) scheme. Design and production: Coretext, www.coretext.com.au Printing: Southern Colour Cover: iStockphoto Disclaimer Use of the information contained in this report is at the user’s risk. While every effort has been made to ensure the accuracy of that information, the Australian Academy of Technological Sciences and Engineering does not make any warranty, express or implied, regarding it.
FOOD AND FIBRE: Australia’s Opportunities

Contents
Executive Summary....................................................................................................................................................................................................................................................... i
Findings and Recommendations....................................................................................................................................................................................... iii
Acknowledgements...................................................................................................................................................................................................................................................v
1. The Challenges and Opportunities for Sustainable Growth........................................................ 1
        1.1. Population growth.................................................................................................................................................................................................................................................. 1
        1.2. Changes in dietary preferences..................................................................................................................................................................................................... 2
        1.3. Competition for land and water to produce biofuel feedstocks.................................................................................... 3
        1.4. Competition for land and water resources............................................................................................................................................................... 4
        1.5. Climate change.............................................................................................................................................................................................................................................................. 6
        1.6. Summary of demand and opportunities for Australian agriculture........................................................................ 7
2. Australian Food and Fibre Industries.............................................................................................................................................................. 9
        2.1. Gross rural production and export.......................................................................................................................................................................................... 9
        2.2. Australia’s agricultural and food export markets...................................................................................................................................... 10
        2.3. Land and water use by Australia’s farming industries..................................................................................................................... 11
        2.4. Potential impacts of climate change................................................................................................................................................................................ 13
                    2.4.1. Recent climate change................................................................................................................................................................................................................................. 13
                    2.4.2. Projected climate change......................................................................................................................................................................................................................... 14
                    2.4.3. Greenhouse gas emissions from agrifood production......................................................................................................................................... 15
        2.5. Conclusions and the future................................................................................................................................................................................................................ 16
3. Sustainable Growth and Australian Agriculture’s
    Competitive Advantage................................................................................................................................................................................................................. 17
        3.1. The state and trends of Australia’s natural capital.................................................................................................................................. 17
        3.2. Sustainable growth compared to ‘business as usual’....................................................................................................................... 22
        3.3. Australian agriculture’s competitive advantage......................................................................................................................................... 24
                    3.3.1. Wheat................................................................................................................................................................................................................................................................................. 25
                    3.3.2. Beef....................................................................................................................................................................................................................................................................................... 26
                    3.3.3. Wine..................................................................................................................................................................................................................................................................................... 26
                    3.3.4. Vegetables................................................................................................................................................................................................................................................................... 26
        3.4. Agricultural productivity: the core of price competitiveness........................................................................................... 27
        3.5. Looking forward: the Australian advantage?................................................................................................................................................... 28
        3.6. Can Sustainable growth provide a competitive advantage?............................................................................................. 29
        3.7. Agricultural competitiveness and sustainability....................................................................................................................................... 30
                    3.7.1. Costs of sustainable growth.................................................................................................................................................................................................................. 31
                    3.7.2. Sustainable growth and differentiation.................................................................................................................................................................................. 31
        3.8. Placing agricultural industries in the landscape........................................................................................................................................ 31
4. Sustainable Growth Potential of Food and Fibre Industries.................................................. 33
        4.1. Existing food and fibre export industries................................................................................................................................................................ 34
        4.2. Possible new industries and resources........................................................................................................................................................................ 39
                    4.2.1. Irrigation in Northern Australia.......................................................................................................................................................................................................... 39
                                                                                                                                                                                                                                                                                                                            www.atse.org.au

                    4.2.2. Biofuels............................................................................................................................................................................................................................................................................ 39
                    4.2.3. Differentiation in existing industries........................................................................................................................................................................................... 42
                    4.2.4. Pathways to increased productivity for agrifood industries.......................................................................................................................... 43

                                                                                                                                                          Australian Academy of Technological Sciences and Engineering (ATSE)
FOOD AND FIBRE: Australia’s Opportunities
5. Innovation............................................................................................................................................................................................................................................................................. 47
5.1. Australia’s innovation system......................................................................................................................................................................................................... 47
5.1.1. Australian Government research investment.................................................................................................................................................................. 48
5.2. Agricultural innovation.............................................................................................................................................................................................................................. 49
5.2.1. Skills and innovation....................................................................................................................................................................................................................................... 51
5.2.2. Collaboration............................................................................................................................................................................................................................................................ 53
6. Conclusions and Recommendations........................................................................................................................................................ 55
6.1. Future opportunities for sustainable growth.................................................................................................................................................. 56
6.2. Challenges to capturing these opportunities................................................................................................................................................. 56
6.3. Findings and recommendations.............................................................................................................................................................................................. 57
Glossary................................................................................................................................................................................................................................................................................................... 61
www.atse.org.au
Australian Academy of Technological Sciences and Engineering (ATSE)FOOD AND FIBRE: Australia’s Opportunities
Executive Summary
Australia’s agrifood industries are at an important crossroads due to a fortuitous confluence of geography
and history. Do we respond to the immediate challenge of meeting the food and fibre demands of the
emerging middle class of our near neighbours, who will express their new wealth in the clothes they wear
and the foods they eat, or do we continue to be a price taker for bulk commodities into the future?
This is the regional expression of the dramatic rebalancing of the global food equation that is currently
occurring. The combined forces of growing population and wealth-driven changes to dietary preferences
are set to increase global food demand by 70 per cent in the next three decades. The world’s capacity to
meet these new demands is likely to be compromised by biofuel-driven competition for agricultural land
and the effects of climate change.
This report evaluates the options available to Australia’s agrifood industries in meeting this challenge
through the prism of our competitive advantages, the availability of new natural resources for agricultural
utilisation, and how Australia can take advantage of emerging opportunities.
Australia’s agrifood industries currently utilise 405 million hectares, of which 32 million hectares are
used to grow crops. Some two million hectares of this cropped land is irrigated, using eight gigalitres of
water. These renewable natural resources generated a gross farm-gate income of $49 billion in 2011-12,
of which $39 billion was exported. This national food production is sufficient to feed 60 to 80 million
people, depending on their diet.
The land and water resources available to agrifood industries in southern Australia are almost fully
developed, with some opportunities for further irrigation existing in Tasmania. Land and water resources
available and suitable for agricultural development are currently being reassessed. On current indications
it is very unlikely that new northern Australian developments would exceed more than five per cent of
the current cropped and irrigated lands.
The relatively limited natural resources available for further agricultural development dictate that further
increases in national food and fibre production for export will have to come from productivity increases
within current industries.
A second, mutually compatible strategy to increasing the value of agrifood exports is to move up the
value chain by transforming bulk commodities to increase the unit value of exports. In most cases, this
would require the development of branded products. Such a strategy would enable Australian producers
to demonstrate safety and create value from our well-regulated production practises, our reputation for
safe and high quality food, and the management of our natural resource base through a ‘Brand Australia’
concept.
Considerable research, innovation and capacity development will be required to provide the technical
and economic basis to successfully pursue these strategies towards capturing an increased share of the
emerging Asian middle class food and fibre market. To meet this requirement, increased investment
in agricultural innovation systems are required, noting that investment in the Rural Research and
www.atse.org.au
Development Corporation program has been shown to achieve investment return ratios of 10 to one
over 25 years, as cited by the Productivity Commission1.
1 Productivity Commission, 2011, Rural Research and Development Corporations, Report No. 52, Final Inquiry Report, Canberra.
Australian Academy of Technological Sciences and Engineering (ATSE) iFOOD AND FIBRE: Australia’s Opportunities
The agrifood and fibre innovation system has undergone significant change over the past two decades,
including governance changes within the Rural Research and Development Corporations, shifting
focus and reduced levels of resourcing within the state and Commonwealth departments of primary
industries, declining tertiary enrolments in agricultural programs, and changing research focus within
universities. As a whole, the agrifood and fibre innovation system requires refocusing, reconnecting and
better coordination to reinvigorate agricultural innovation in Australia.
This will only be achieved if Australia develops a long-term strategy and vision for its agricultural sector
to remain competitive and relevant into the future.
www.atse.org.au
ii Australian Academy of Technological Sciences and Engineering (ATSE)FOOD AND FIBRE: Australia’s Opportunities
Findings and
Recommendations
1 Develop a long-term strategy
Australia needs a long-term policy vision with focus on export growth and high
value-add, resulting in enhanced profitability that flows back to all sectors,
including the farm-gate.
Recommendation 1 Develop a multi-decadal, bipartisan national vision and rolling five-year strategy
to focus and direct the sustainable growth of agrifood and fibre export industries, guided by a high-level
Australian Agrifood and Fibre Forum, representing governments, researchers, industry and communities,
chaired by the Minister.
1.1 As part of this strategy, convene an agrifood investment taskforce incorporating industry, finance
and superannuation sectors to recommend innovative mechanisms to encourage patient investment in
all aspects of the Australian agrifood and fibre sector.
2 Leverage Australia’s competitive advantage
through ‘Brand Australia’
To target high-value export markets, Australia needs to build and promote global
brand recognition of Australia’s food and fibre products – Brand Australia.
Recommendation 2 Develop and implement a robust ‘Brand Australia’ concept through industry and
government collaboration with credible accreditation and authentication processes that utilise Australia’s
existing agrifood regulatory system.
2.1 ‘Brand Australia’ accreditation and authentication processes should utilise strategic advantages
in nationally available natural resource management systems, including environmental, phytosanitary
and livestock identification, to demonstrate and authenticate the safety, traceability and environmental
credentials of Australian agrifood and fibre produce.
2.2 The Rural Research and Development Corporation system should be supported to participate in
cross-sectoral programs to develop the required accreditation processes and demonstrate and authenticate
the superior safety and quality attributes of ‘Brand Australia’ agrifood and fibre produce.
3 Improve Australia’s innovative capacity
To be globally competitive, Australia must stay ahead of the pack in innovation.
This means the agricultural innovation system must be focused, coordinated and
well-resourced to enable Australia’s world-class research to be translated into innovative
Australian agribusiness with a focus on value-add. There are opportunities to re-
invigorate components of Australia’s agricultural innovation system, including investing
in knowledge creation, enabling uptake by industry and facilitating essential workforce
www.atse.org.au
development.
Recommendation 3 Significantly increase investment in agricultural and agrifood-based research,
development, and advisory programs by industry and governments, including investment in substantial
Australian Academy of Technological Sciences and Engineering (ATSE) iiiFOOD AND FIBRE: Australia’s Opportunities
international partnerships, to provide a platform for Australia to achieve the continued increases in
productivity necessary to remain competitive and develop emerging export opportunities.
3.1 Encourage cooperation between industry, governments and research providers to better coordinate,
connect and translate research, as well as identify future research needs.
3.2 Enhance student recruitment into agrifood-related education programs, including research.
4 Enable collaboration & translation for value-adding
To build a more robust Australian industry sector, we need enhanced networks
and connectivity nationally between researchers, growers, industry producers
and marketers. This requires rethinking current linkages. Global collaboration is
an important aspect of enhancing the quality of our research as well sharing risks
associated with deployment of innovation and development of new value add business
opportunities. Collaborative networks such as the Food Innovation Australia Limited
Collaborative Centre of Excellence provide a platform for agrifood businesses to connect
with researchers through rural research and development corporations, universities,
cooperative research centres and CSIRO.
Recommendation 4 Invest in collaborative networks connecting research organisations and businesses
to encourage and enable Australian and international agrifood businesses to undertake local value-adding,
through better access to new technologies and cutting-edge research, and to participate strategically in
global value chains.
www.atse.org.au
iv Australian Academy of Technological Sciences and Engineering (ATSE)FOOD AND FIBRE: Australia’s Opportunities
Acknowledgements
The Academy is most grateful for the contributions made by the authors of the report, the Steering
Committee established to oversee the conduct of the project and input received from the external
reviewers and contributors.
The principal author of this report was Professor Snow Barlow FTSE. Assistance was provided by
Dr Kelvin Montagu.
Professor Snow Barlow is an agricultural scientist whose research encompasses plant water use efficiency,
impacts of climate change on agriculture and global food security. He is Professor of Horticulture
and Viticulture at the University of Melbourne, a Fellow of ATSE and of the Australian Institute of
Agricultural Science. In 2009 he was awarded the Australian Medal of Agricultural Science and as
president of Science and Technology Australia he served on the Prime Minister’s Science, Engineering
and Innovation Council. He currently chairs the Victorian Endowment for Science, Knowledge and
Innovation and the Expert Advisory Panel of the Department of Agriculture’s Carbon Farming Futures
RD&E program. Professor Barlow has served on the ARC Biological Sciences Committee and the
boards of two Rural Industry Research and Development Corporations.
Dr Kelvin Montagu has held research and management roles across agriculture, horticulture and
forestry sectors in Australasia and Asia, specialising in carbon and water cycles in forest and agricultural
landscapes. He currently runs Colo Consulting, delivering natural resource outcomes for forest and
agricultural landscapes through research and education projects.
The project was overseen on behalf of the Academy by a Steering Committee comprising:
¢Professor Peter Gray FTSE (Co-Chair) ¢ Dr John Radcliffe AM FTSE
¢Mr Peter Laver AM FTSE (Co-Chair) ¢ Professor Tim Reeves FTSE
¢Dr Vaughan Beck FTSE ¢ Mr Mike Taylor AO FTSE
¢Professor Lindsay Falvey FTSE ¢ Mr Martin Thomas AM FTSE
¢Dr Tony Gregson AM FTSE ¢ Dr Meryl Williams FTSE
¢Dr Graeme Pearman AM FAA FTSE
The project was established, managed and edited by ATSE staff, principally by Harriet Harden-Davies
(Manager, Policy and Projects, ATSE) and Dr Andrew Hastings (Research and Policy Officer, ATSE).
The production of this publication was overseen by Bill Mackey (Deputy CEO, ATSE).
The draft report was reviewed by Dr Tony Fischer AM FTSE, Dr Bruce Kefford and Dr John Keniry
AM FTSE.
The input and advice from ATSE Fellows to the project was invaluable. An expert reference group was
consulted across Australia for input during the course of this study. This input is gratefully acknowledged.
ATSE gratefully acknowledges funding provided by the Australian Research Council (ARC) under the
Linkage Learned Academies Special Projects program to conduct this project. The opinions expressed
www.atse.org.au
herein are attributed to ATSE and may not reflect the views of supporting organisations.
Australian Academy of Technological Sciences and Engineering (ATSE) vFOOD AND FIBRE: Australia’s Opportunities
www.atse.org.au
vi Australian Academy of Technological Sciences and Engineering (ATSE)FOOD AND FIBRE: Australia’s Opportunities
1 The Challenges and
Opportunities for
Sustainable Growth
The global demand for food and fibre is expected to increase by 70 to 100 per cent by 2050 as a result of a
number of additive influences2. The major drivers of this increased demand are generally expected to be2:
¢population growth; and
¢wealth-driven changes in dietary preferences towards more resource-intensive animal protein.
These changes are inevitable and need to be considered in the context of major environmental
perturbations and challenges to food production, climate change, and increasing competition for land
and fresh water resources from biofuel production and urbanisation.
The object of this project is to identify potential opportunities for Australia within this global context of
increased food demand and constraints on the availability of natural resources to produce this food and
fibre. It will also identify the actions necessary to grasp the opportunities identified in this area.
In this context we define Sustainable Growth Industries as “areas of potential economic growth within
the Australian food and fibre sectors that could be expected to lead to significant increases in export earnings
and ultimately national GDP”. This sustainable growth would have to be achieved without any adverse
impacts on the sustainability of Australia’s natural resource base or perverse outcomes on Australia’s national
greenhouse gas emissions inventory. A more comprehensive outline of how sustainable growth applies to
agriculture is given in Section 3.
The Australian food and fibre sector has been defined broadly to include whole market chains – from
inputs to the farm production system, extending beyond the farm gate to consumers nationally or
internationally. In an increasingly interconnected world it is necessary to create value wherever possible
along this market chain and thereby increase the value obtained by the involvement of Australia’s
relatively limited natural resources in food and fibre production. The case for this expected increase in
food and fibre demand and the potential confounding factors influencing the globe’s capacity to meet
these demands are outlined in the following sections.
1.1 Population growth
The United Nations projects that the world’s population will rise to eight billion in 2030 and nine billion
by 20502. The uncertainty of these projections, particularly those for 2050, is acknowledged to be due to
possible different pathways of development. Probabilistic estimates consider the most likely range to be
8 to 10 billion by 2050 (Figure 1). There are critical global humanitarian issues of how these people are
to be fed and pathways to meeting the millennium development goals.
www.atse.org.au
2 Foresight, 2011, The Future of Food and Farming: Challenges and Choices for Global Sustainability, UK Government Office for Science,
London.
Australian Academy of Technological Sciences and Engineering (ATSE) 1FOOD AND FIBRE: Australia’s Opportunities
Figure 1 Estimates of likely global population trends in the 21st century3.
Total world population in billions
14
0.975 interval
12
10 0.8 interval
0.6 interval
Median
8 0.4 interval
0.2 interval
6
0.025 interval
4
2
0
2000 2010 2020 2030 2040 2050 2060 2070 2080 2090 2100
Year
Probabilistic projections until 2100: green 95% interval, blue 60% interval, pink 20% interval.
The more important question in terms of food demand is where will this population growth occur and
what will its capacity be to access and purchase food. This population growth will be predominately in
urban areas, particularly in Asia where more than half the globe’s population already lives. This urban
population growth has very important implications for food distribution and dietary preference because
of the increased per capita incomes of urban populations and the nature of the food distribution systems.
1.2 Changes in dietary preferences
Changes in dietary preferences resulting from increasing per capita income will dramatically influence
global demand for food in both the short (2030) and medium term (2050). The World Bank has forecast
that developing country per capita incomes will grow at an annual rate of 3.1 per cent through to 2030,
resulting in the populations of these nations representing half of global purchasing power by 20304.
The growth in incomes will be led by East Asia, South Asia and the Pacific with forecast per capita
income growth of between four and six per cent annually in this period5. The net result will be that the
global middle class will grow from five per cent to almost 15 per cent of the world’s population by 20306.
As per capita income rises dietary preferences change, with an increase in the calorific intake and a
pronounced shift away from cereals to meat, dairy products, and sugar and alcohol (Figure 2). The key
differences between developing and developed country diets are in the consumption of animal protein
products, sugar, and alcohol, with some increase in the consumption of vegetables. These differences
are underpinned by substantive decreases in direct cereal consumption. However, because of the cereal
requirements of many animal production systems, these dietary changes give rise to substantive increases
in total demand for cereals. Some food items require considerably more resources (i.e. land, water, and
energy) to produce than others, as illustrated in Table 1.
3 Foresight, 2011, The Future of Food and Farming: Challenges and Choices for Global Sustainability, UK Government Office for Science,
London.
www.atse.org.au
4 The World Bank, 2007, Global Economic Prospects: Managing the Next Wave of Globalization, The World Bank, Washington DC.
5 Lutz W, and Scherbov S, 2008, Exploratory Extension of IIASA’s World Population Projections: Scenarios to 2300, International Institute for
Applied Systems Analysis.
6 Port Jackson Partners, 2012, Greener Pastures: The global soft commodity opportunity for Australia and New Zealand, ANZ Insight issue 3,
Sydney.
2 Australian Academy of Technological Sciences and Engineering (ATSE)FOOD AND FIBRE: Australia’s Opportunities
Increases in the resource requirements are Figure 2 Comparison in total calories
clearly reflected in the comparison between consumed and their distribution between
the land and water requirements to produce food categories of least developed,
the constituents of these human diets. developing and developed countries7.
Although the increase in the dietary calorific Calorie intake by food type
requirements is relatively modest, the impact Kcalories (Kcal) per person per day
of the dietary changes the land and water 1500 Cereals
requirements to produce them are very
substantial. These increases in natural resources
required to satisfy dietary requirements 1000
effectively increase the global demand for
resources for food production. Fruit
Other 500
animal
A further important implication of these products**
population and per capita wealth trends
0
is that this growth will be predominantly
urban9. Urban people generally purchase
their food through supermarkets, compared
to traditional street markets. This trend gives
rise to the opportunity for food exporting Meat Vegetables*
nations to strive to place branded food
products on those supermarket shelves rather
than exclusively exporting undifferentiated
Sugars and alcohol
bulk commodities. Branded products have the
Least developed countries Developing countries
advantage of creating greater value through Developed countries
displaying the country of origin, its food safety * Includes pulses, spices, roots and oil crops.
** Includes milk, eggs, aquatic products and cheese and
reputation, and its environmental credentials. excludes meats.
1.3 Competition for land and water to
produce biofuel feedstocks
The rising price of liquid fossil fuels and the desire of nations to establish some energy security over liquid
fuels have led to five-fold increases in first-generation biofuel production of ethanol and biodiesel over
the past decade10. These biofuels are predominantly from sugarcane and oilseed crops, such as canola,
Table 1 Comparison of water and land requirements for average dietary preferences of
least developed, developing and developed countries8.
Least developed Developing Developed World
countries countries countries
Population (billion) 0.8 4.8 1.0 6.6
Average calorie consumption 2150 2770 3450 2800
(Kcal/day/capita)
Water requirements for 1600 2600 3900 2700
agriculture (L/day/capita)
Water requirements per calorie 0.74 0.94 1.13 0.96
consumed (L/Kcal)
Land requirements for agriculture 3.1 5.1 7.8 5.3
(m2/capita)
www.atse.org.au
7 Ibid.
8 Ibid.
9 Foresight, 2011, The Future of Food and Farming: Challenges and Choices for Global Sustainability, UK Government Office for Science,
London.
10 BP, 2013, Statistical Review of World Energy June 2013, BP.
Australian Academy of Technological Sciences and Engineering (ATSE) 3FOOD AND FIBRE: Australia’s Opportunities
Figure 3 Global growth of biofuel production in the past decade, particularly the
growth of ethanol production in the US and biodiesel in Europe and Eurasia14.
Million tonnes oil equivalent Million tonnes oil equivalent
80 30
40
20
60
10
20
0 0
2002 2004 2006 2008 2010 2012 North S. & Central Europe & Rest of world
America America Eurasia
Rest of world Europe & Eurasia Ethanol 2002 Ethanol 2012
South & Central America North America Biodiesel 2002 Biodiesel 2012
World biofuels production declined by 0.4% in 2012, the first decline since 2000. Increased output in South America and Asia-Pacific
was outweighed by declines in North America and Europe. Global ethanol output declined by 1.7%, the second straight
annual decline. Biodiesel production grew by 2.7% and has doubled in the last five years and now makes up 31% of total
biofuel supply.
and therefore compete directly with food production for arable land and in some cases water resources.
The potential competitive threat to food production has been well illustrated both theoretically by
Pearman11 for 11 countries, including Australia, and practically by the Bush Administration’s energy
security policy between 2000 and 2008 subsidising ethanol production. It is clear now that biofuels
have only limited capacity to substitute for fossil fuels in supplying global energy demands. The use
of tradeable agricultural products that have human food value to produce biofuels is even less efficient
because the feedstock only represents a small proportion of the total biomass produced12. Hence, the
land and water resource demands for biofuels production become even higher.
This is amply demonstrated by the biofuels policy initiated by the Bush Administration in the United
States, which has led to up to 40 per cent of the US corn crop being diverted to biofuel production in
recent years13 and effectively tripled US biofuel production (Figure 3). As the United States is the largest
global exporter of corn, this diversion has had a large impact on the global corn price.
It is probable that the drive for some national security in liquid fuels, including aviation fuel15, supported
by policy incentives will continue to place pressure land and water resources globally. There is evidence
that these pressures can and will be a major influence on global food production, trade and commodity
pricing.
1.4 Competition for land and water resources
The so-called ‘Green Revolution’ of the second half of the 20th century, which was responsible for the
doubling of global food production over approximately 30 years, was largely driven by improved crop
11 Pearman G, 2013, Limits to the potential of bio-fuels and bio-sequestration of carbon. Energy Policy, vol. 59, 523–535.
12 Ibid.
www.atse.org.au
13 USDA, 2013, World Agricultural Supply and Demand Estimates and National Agricultural Statistics Service, United States Department of
Agriculture, August 2013.
14 BP, 2013, Statistical Review of World Energy June 2013, BP.
15 Godfrey B, Sargent M, and Pond S, 2013, Green Growth – Energy: Industry opportunities for Australia, Australian Academy of Technological
Sciences and Engineering, Melbourne.
4 Australian Academy of Technological Sciences and Engineering (ATSE)FOOD AND FIBRE: Australia’s Opportunities
Figure 4 Relative contribution to changes in global agricultural growth per decade
from 1961 to 2009 of: expansion of irrigation and land area; input intensification per
unit area of land (Inputs/Land); and total factor productivity (TFP)16, including
technological advances. The height of the bar shows the average growth rate
in gross agricultural output during the specified period17 .
Per cent/year
3.0
2.5
2.0
1.5
1.0
0.5
0
1961-2009 1961-1970 1971-1980 1981-1990 1991-2000 2001-2009
TFP Inputs/land Irrigation Area expansion
genetics and intensification (increased inputs of fertiliser, agrochemicals and mechanisation) and the
expansion of land and water resources. While the new genetics was a constant, the proportions of land,
water and fertiliser inputs varied across the globe’s food bowls. Globally, intensification and additional
utilisation of natural resources drove increases in agricultural production up until the end of 199018.
During this period, 55 to 90 per cent of the growth in agricultural outputs was due to increasing use of
natural resources coupled with intensification.
There is much debate19, 20, 21 regarding the amount of land available for cropping to meet the projected
increases in food demand. Recent estimates22 indicate that a further 450 million hectares (Mha) of new
cropping land may be available globally, which is about one-third of the 1400 to 1600 Mha currently
cropped. Since 1990, cropping land has increased by a net 2.7 Mha per year. However, this net increase
masks the 2.9 Mha per year decline in industrial and transitional economies, balanced by a 5.5 Mha
per year gain in developing countries8. Because productivity differs markedly between industrial and
developing countries, agricultural production grew by less than might be expected in terms of total land
area utilised. Land has many uses of which agriculture is just one, and in many cases it is a low return use
in relation to urban uses and mining uses such as coal seam gas extraction.
16 Total factor productivity is the ratio of total or agricultural output to total input including labour, capital, materials and services, and
other natural resources.
17 Fuglie K, 2012, ’Productivity growth and technology capital in the global agricultural economy’, in Productivity Growth in Agriculture: An
International Perspective, CAB International, United Kingdom.
18 Ibid.
19 Foresight, 2011, The Future of Food and Farming: Challenges and Choices for Global Sustainability, UK Government Office for Science,
London.
www.atse.org.au
20 Hertel T, 2011, The Global Supply and Demand for Agricultural Land in 2050: A Perfect Storm in the Making? American Journal of
Agricultural Economics, vol 93, 259-275.
21 Byerlee D, and Deininger K, 2011, Foreign Investment in Farmland: Worries about a land grab in Australia are unfounded. Farm Policy
Journal, vol 8, 1-9.
22 Ibid.
Australian Academy of Technological Sciences and Engineering (ATSE) 5FOOD AND FIBRE: Australia’s Opportunities
Despite this apparent availability of new land for agricultural development the recent increases in food
commodity demand have resulted in significant increases in the price of agricultural land in industrial,
transitional and developing economies23. This underlines the obvious challenges of bringing new land
into production where access to expertise, transport and infrastructure is constrained.
Australia is a good example of this with an apparent land reserve of 26 Mha. On closer inspection this
is mostly located in northern Australia on land with poor access, little infrastructure and where new
farming systems are required. Furthermore, these potential areas have considerable ecological, cultural
and economic value24 making it even more difficult and problematic to recruit them to agricultural
activities. A recent scientific evaluation of suitable agricultural land in northern Australia25 has indicated
that, while the area of arable soils and suitable rainfall potentially available for cropping is between 5 and
17 Mha, it’s most likely that only 10 per cent of this area is actually practicable, a maximum area of
suitable arable soils of 1.7 Mha.
Water resources may well be a larger limitation than land resources in meeting future global food
demands: food production in Australia and many other parts of the world are limited by freshwater
availability, not land. Agriculture currently uses 70 per cent of the fresh water extracted from surface and
groundwater resources26. The International Water Management Institute expects this usage to increase
by 30 per cent by 2030 placing greater stress on global fresh water supplies.
However, there are many examples around Australia and the world where water resources appear to be
overexploited. For example, major world food bowls such as the North China Plain and India’s Punjab
region are exploiting groundwater resources at a rate considerably higher than the recharge rate. Climate
change will also influence the availability of water for use in agriculture.
The growing role of productivity driven growth, to overcome difficulties associated with finding new
natural resources to exploit, is discussed in Section 3.
1.5 Climate change
Projected climate change will influence the productive capacity of the world’s agricultural regions,
potentially challenging our capacity to feed the projected population in 2050. Global temperatures are
expected to increase and seasonal and regional rainfall affected27. These climatic changes will impact
agricultural regions in different ways depending on their geographical location. Depending on the
changes in rainfall and its distribution, tropical regions could become less productive while temperate
regions may become more productive as they warm. Although a number of research groups have
attempted to model the potential impacts of climate change by utilising spatial modelling techniques
there is no consensus of the likely impacts28, 29. Australia is fortunate to be well served by climate and crop
sciences fully engaged in these specific areas which have been used to determine the potential impact
of climate change on Australian agriculture and the natural resources base. These issues are discussed in
detail in Section 2.
23 Ibid.
24 CSIRO Land and Water, 2007, Northern Australia Irrigation Futures: National Program for Sustainable Irrigation – CDS23 – Final Report,
CSIRO.
25 Northern Australia Land and Water Taskforce, 2009, Northern Australia Land and Water Science Review 2009: Final report, CSIRO.
26 Foresight, 2011, The Future of Food and Farming: Challenges and Choices for Global Sustainability, UK Government Office for Science,
London.
www.atse.org.au
27 IPCC, 2013, Climate Change 2013: The Physical Science Basis, Cambridge University Press.
28 Parry M, Rosenzweig C, and Livermore M, 2005, Climate change, global food supply and risk of hunger, Philosophical Transactions of the
Royal Society B, vol 360, 2125-2138.
29 Nelson G, Rosegrant M, Palazzo A, Gray I, Ingersoll C, Robertson R, Tokgoz S, Zhu T, Sulser T, Ringler C, Msangi S, and You L, 2010, Food
Security, Farming, and Climate Change to 2050: Scenarios, Results, Policy Options, International Food Policy Research Institute (IFPRI).
6 Australian Academy of Technological Sciences and Engineering (ATSE)Green Growth
Figure 5 Fluctuations in FAO World Food Price Index for the period 1990 to 201330.
2002-2004 = 100
250
210
170
130
90
50
90 91 92 93 94 95 96 97 98 99 00 01 02 03 04 05 06 07 08 09 10 11 12 13
Nominal Real*
* The real price index is the nominal price index deflated by the World Bank Manufactures Unit Value Index (MUV).
Despite uncertainties in projecting regional rainfall changes and influences of future carbon dioxide
(CO2) levels on crop and pasture growth rates, the general consensus is that global climate change will
make meeting future food demands harder and therefore increase upward pressure on food commodity
market prices.
1.6 Summary of demand and opportunities for Australian
agriculture
This growing global demand for food, together with increases in per capita wealth and increasing
competition for the natural resource base to produce food, will present opportunities for Australia as
a major food exporting nation. The combination of these demand and supply pressures has resulted in
two food price spikes in the past five years, as illustrated by the United Nations Food and Agriculture
Organization (FAO) food prices index31 (Figure 5). The FAO World Food Price Index is a measure of
the monthly change in international prices of a basket of food commodities: cereals, vegetable oils, dairy,
meat, and sugar. It was established in 1991 with an arbitrary value of 100. While remaining below 130
for 15 years to 2005, the index spiked above 200 in 2008, then again in 2011, and remained above 200
in 2013.
At a regional level these food pressures are particularly strong in Asia, as noted in the ‘Asian Century’
White Paper32. Currently more than 50 per cent of Australia’s total food exports are sold to Asia, with
China and Japan accounting for more than 30 per cent of the total33.
The capacity of Australia’s primary industries sector to capitalise on these emerging global opportunities
in food export markets will depend on the competitiveness of the sector in international markets, its
capacity to increase production to capture a proportion of this strong regional growth, and the ability to
develop new food brands which leverage on Australia’s reputation related to food safety, reliability and
environmental credence.
30 FAO, 2014, FAO Food Price Index, Food and Agriculture Organization of the United Nations, available at http://www.fao.org/
www.atse.org.au
worldfoodsituation/wfs-home/foodpricesindex/en/
31 Ibid.
32 2012, Australia in the Asian Century – White Paper October 2012, Commonwealth of Australia.
33 DFAT, 2013, Australia's major agriculture export markets (by value) – 2011/2012 financial year, Department of Foreign Affairs and Trade,
available at http://www.dfat.gov.au/trade/negotiations/trade_in_agriculture.html.
Australian Academy of Technological Sciences and Engineering (ATSE) 7FOOD AND FIBRE: Australia’s Opportunities
In this context the purpose of this report is to analyse where the major opportunities for Australia’s food
and fibre industries lie, what the major impediments to succeeding in capturing these opportunities are,
and suggest what if anything could be done to overcome these impediments.
The next chapter will outline a framework for analysing the capacity of Australia’s agricultural industries
and regions to make substantive contributions to the national gross domestic product (GDP) through
increasing food and fibre exports.
www.atse.org.au
8 Australian Academy of Technological Sciences and Engineering (ATSE)FOOD AND FIBRE: Australia’s Opportunities
2 Australian Food and Fibre
Industries
Historically the food and fibre industries have been an important part of Australia’s economy. In the
first half of the 20th century, agriculture’s share of Australia’s GDP hovered around 25 per cent before
declining to its current level of four to six per cent. In the latter decades of the 20th century the tourism,
international education, and services industries joined mining and agriculture as major export industries.
In gross terms, agricultural industries continued to grow, albeit at a much slower rate than mining and
the emerging export industries of tourism and international education34.
In the closing decades of the 20th century agricultural exports were confronted by difficult terms of trade
and a general global food surplus as a consequence of the ‘Green Revolution’. During this period, exports
declined from 70 to 80 per cent of national agricultural production to the current levels of approximately
65 per cent.
Despite these difficult international trading conditions Australian agriculture has continued to grow,
with a long-term growth in value of 2.4 per cent per year, and Australia has remained a major agricultural
exporter. This was achieved through the development of new industries such as cotton, canola and
lupins, and the dramatic expansion of some existing industries such as wine. The major grains, red
meat, sugar and dairy export industries remained strong if variable, as a result of seasonable conditions,
international markets fluctuations, and the loss of market protection during the Hawke/Keating reforms
of the Australian economy.
2.1 Gross Rural Production and Export
Australia’s food and fibre industries had a total gross ‘farm gate’ value of more than $53 billion in the
2011-12 financial year (Figure 6). Agricultural industries generated a gross production of $48 billion35,
Figure 6 Gross value of Australian agricultural production in financial year 2011-1236.
Cereals for grain and seed
Production from sheep and other livestock
Production from meat cattle
Dairy production
Vegetables
Fruit
Cotton
Nursery production
Sugar cane
Grapes
Hay
Rice
Other broadacre crops
0 2000 4000 6000 8000
$ million
www.atse.org.au
34 ABS, 2013, 7121.0 - Agricultural Commodities, Australia, 2011-12, Australian Bureau of Statistics.
35 Ibid.
36 ABS, 2013, 4610.0.55.008 - Gross Value of Irrigated Agricultural Production, 2011-12, Australian Bureau of Statistics.
Australian Academy of Technological Sciences and Engineering (ATSE) 9FOOD AND FIBRE: Australia’s Opportunities
Figure 7 The value chain of the Australian food industry illustrating the largely
untransformed nature of our exports and the predominantly transformed nature of
our imports37.
Farm and fish food production Food and beverage processing Retail food sales
$42.6 billion Sales and service revenue, $135.8 billion
$91 2 billion (2010-11 data)
Meat 32% Meat 24% Supermarkets,
Grains, oilseeds 31% Dairy 15% grocery stores 62%
Fruit, vegetables 18% Bakery products 6% Takeaway outlets 11%
Milk 11% Beverages 17% Liquor retailing 7%
Flour, cereal products 6% Cafes, restaurants 14%
Seafood 5%
Fruit, vegetables 6% Other food 6%
Other food 3%
Other food 26%
Exports Imports
$30 5 billion $11.3 billion
Meat 24% Beverages 20%
Grains 34% Horticulture 19%
Dairy products 8% Seafood 12%
Wine 6% Dairy 7%
Seafood 3% Other 42%
Other 25%
The Australian food and beverage industry in 2011-12 benefited from favourable production conditions in Australia and strong growth
in world food imports. The performance of the export sector was strong in 2011-12 but was dampened by the continued strength of the
Australian dollar. The food industry in Australia – ranging from farm and fisheries production to food and beverage service – employed
about 1.64 million persons in 2011-12, around 15 per cent of total employment in Australia but 2 per cent lower than in 2010-11.
with fisheries and forestry contributing an extra $2.5 billion and $1.5 billion respectively, or 2.8 per cent
of Australia’s GDP in that year.
The majority of this farm, forest and fisheries production was exported. In 2012, 75 per cent, or
$39 billion worth, of this rural production was exported. Grains including oilseeds, cattle, sheep meat,
live animals, and wool constitute more than 70 per cent of these exports. In addition, cotton, wool,
horticulture, wine, sugar, dairy, forestry, and fisheries are each billion dollar per annum export industries
in their own rights with strong markets globally (Figure 6).
As an agricultural free trade nation there are a number of industry sectors in which significant food
and fibre products are also routinely imported. Despite our substantial forestry and fisheries industries,
Australia is a net importer of forest and fisheries products. On a seasonal basis, substantial quantities of
horticultural products are also imported. Australia imports some raw commodities as food ingredients.
Even taking these imports into account, Australia remains a strong net exporter of food and fibre
commodities of mainstream agricultural, forestry, and fisheries products to global markets.
2.2 Australia’s agricultural and food export markets
Australian agrifood production is not large in global terms, essentially producing enough food for 80 to
100 million people on a globe with a population of more than seven billion. Nevertheless, Australia is
the sixth largest food exporting nation in the world. For example, Australia’s contribution to the global
wheat crop of 750 million tonnes in 2011-12 was only 30 million tonnes, yet it consistently ranks as the
third or fourth largest exporter depending on season and demand.
www.atse.org.au
The diverse nature of Australia’s food and fibre export industries is illustrated in Figure 6. Australia is
a very active exporter in foods identified in Section 1 as being in demand from the emerging middle
37 DAFF, 2013, Australian food statistics 2011–12, Department of Agriculture Forestry and Fisheries, Commonwealth of Australia.
10 Australian Academy of Technological Sciences and Engineering (ATSE)You can also read