EATING FOR 2 DEGREES NEW AND UPDATED LIVEWELL PLATES - WWF-UK IS
←
→
Page content transcription
If your browser does not render page correctly, please read the page content below
Eating for 2 degrees
new and updated
Livewell Plates
© John Daniels / WWF
Cover photo
© Kelly Sillaste / Getty Images / WWF

Contributors
Gerard Kramer, Bart Durlinger,
Lody Kuling, Willem-Jan van Zeist,
Hans Blonk, Roline Broekema,
Sarah Halevy

Design
madenoise.com

May 2017

About WWF
WWF is the world’s leading independent
conservation organisation. We’re
creating solutions to the most important
environmental challenges facing the
planet. We work with communities,
businesses and governments in over
100 countries to help people and nature
thrive. Together, we’re safeguarding the
natural world, tackling dangerous climate
change and enabling people to use only
their fair share of natural resources.

Food is at the heart of many key
environmental issues WWF works on.
Growing, producing and importing food
contributes substantially to climate
change. It’s a driving force behind habitat
and biodiversity loss. And it’s a huge drain
on water resources. That’s why helping
to develop a sustainable food system for
healthy people and a healthy planet is one
of WWF’s priorities.

Find out more about our work at
wwf.org.uk/food

About Blonk
Blonk Consultants helps companies,
governments and civil society
organisations put sustainability into
practice. Our team of dedicated
consultants works closely with our clients
to deliver clear and practical advice
based on sound, independent research.
To ensure optimal outcomes we take an
integrated approach that encompasses
the whole production chain.

www.blonkconsultants.nl
contents
Preface          5

Foreword         7

Executive summary............................................................................................................................8
Glossary, acronyms and abbreviations...................................................................................... 14
1
  Introduction......................................................................................................................... 16
2
  Objectives and research questions.................................................................................17
3		Methodology overview..................................................................................................... 18
		 Steps in deriving healthy and sustainable diets by optimisation.......................................... 18

 Consumer groups..................................................................................................................... 18

 Constraints.............................................................................................................................. 18
			              Environmental constraints.............................................................................................. 18
			              Reduction of GHG impact (carbon footprint).................................................................. 19
			              Limits for land occupation............................................................................................... 19
			              Nutritional requirements (defining upper and lower limits)........................................... 19
			              Constraint on fish.............................................................................................................20

 Food products in the optimisation..........................................................................................20
			              Product categories............................................................................................................20
			              Environmental impacts of food products........................................................................20
			              Nutritional data on food products....................................................................................20

 Current diets............................................................................................................................ 21

 Selection of optimisation algorithm and calibration.............................................................. 21

4
  Results...................................................................................................................................22
           Livewell Plates.........................................................................................................................22
			              Adults 2020 and 2030...................................................................................................... 22
			              Comparison to the Eatwell Guide....................................................................................28
			              Adolescents 2030..............................................................................................................30
			              Elderly 2030...................................................................................................................... 32
			              Vegans 2030......................................................................................................................34

 Cost of Livewell Plates............................................................................................................. 36

 Historical trends in diets......................................................................................................... 37

5		Conclusions...........................................................................................................................42
Annex 1: Definition of Livewell GHG reduction requirements................................................ 45
Target for GHG emissions..................................................................................................................... 45
Land occupation.................................................................................................................................... 45

Annex 2: Data sources health and nutrition..............................................................................46
Current diets..........................................................................................................................................46
Nutrient requirements.......................................................................................................................... 47
Food-based dietary guidelines..............................................................................................................48
Food composition..................................................................................................................................49
Costs......................................................................................................................................................49
Historical trends....................................................................................................................................49

Annex 3: LCA methodology and data.............................................................................................50
Scope......................................................................................................................................................50
Functional unit...................................................................................................................................... 53
System boundaries................................................................................................................................ 53
Included impacts................................................................................................................................... 54
GHG emissions...................................................................................................................................... 54
GHG emissions by land-use change...................................................................................................... 54
Land occupation.................................................................................................................................... 54
Impact on freshwater use...................................................................................................................... 54
Compliance to life cycle impact assessment methodologies................................................................ 54
Intended use.......................................................................................................................................... 54
Limitations............................................................................................................................................ 54
Crop rotation......................................................................................................................................... 54
Surface albedo change........................................................................................................................... 54
Regionalisation...................................................................................................................................... 55
Data variation........................................................................................................................................ 55
Transport from supermarket to the consumer home........................................................................... 55
Life cycle inventory............................................................................................................................... 55
Agri-footprint........................................................................................................................................ 55
Life cycle inventory databases developed for the Dutch National Institute
for Public Health and the Environment............................................................................................... 55
Other food products.............................................................................................................................. 55
Distribution centre................................................................................................................................ 55
Supermarket.......................................................................................................................................... 56
Consumer phase.................................................................................................................................... 56
Food losses through the life cycle......................................................................................................... 56
Transport through the life cycle............................................................................................................ 56

Annex 4: Optimisation....................................................................................................................... 57
Annex 5: Livewell meeting report................................................................................................58
Livestock................................................................................................................................................58
Horticulture........................................................................................................................................... 59
Business................................................................................................................................................. 61
Other......................................................................................................................................................62

Annex 6: Food and WWF policy areas........................................................................................... 63
Water ..................................................................................................................................................... 63
Forests................................................................................................................................................... 65
Seafood.................................................................................................................................................. 67
Meat.......................................................................................................................................................68
Soy..........................................................................................................................................................69

Literature........................................................................................................................................... 70
Eating for 2 degrees – new and updated Livewell Plates                                                                                      5

                               Preface
                               The newly modelled Livewell Plates presented in this
                               report illustrate the dietary changes we need to make
                               by 2020 and 2030 in order to keep the average global
                               temperature rise well below 2 degrees, as agreed at the
                               Paris climate conference in December 2015.
                               Below are the key elements of our research framework.

                               The Paris Agreement                                        Reduction from the food sector
                               The Paris Climate Change Agreement                         To analyse the changes required in the
                               adopted at the Conference of the Parties                   food sector we’ve assumed it needs to
                               in December 2015 (COP21) entered into                      make the same level of contribution as
                               force on 4 November 2016. This landmark                    the rest of the economy, in other words a
                               agreement aims to reduce man-made                          reduction in emissions of 60%. Rather than
                               greenhouse gas (GHG) emissions to a level                  a prescriptive target, this is an exercise
                               that limits the global average temperature-                to help start the conversation about
                               rise to well below 2 degrees compared to                   mitigation efforts within the food sector.
                               pre-industrial levels, with an aspirational
                               goal of 1.5 degrees. These targets have been               Within the food system mitigation
                               agreed by the international community and                  efforts can be split between producers
                               endorsed by companies, and their policies                  and consumers. Producers can improve
                               will be geared towards achieving them.                     resource efficiency and reduce emissions,
                                                                                          while consumers can adopt a climate-
                               Changes to the food system will need to be                 smart diet such as the Livewell diet
                               part of the solution. WWF is committed                     presented in this report. Our core analysis
                               to working with all stakeholders within                    focuses on consumptionii.
                               the food sector to understand how it can
                               contribute and what steps need to be taken                 Split between consumption
                               to keep the rise well below 2 degrees.                     and production
                               UK Carbon budgets                                          In order to establish the necessary
                                                                                          emissions reductions from the food
                               The Paris Agreement commits all parties                    system – and taking into account a lack
                               to build on their efforts to keep global                   of research relating to consumption’s ‘fair
                               warming well below 2 degrees, and aim                      share’ in achieving this – we’ve developed
                               to achieve 1.5 degrees. In the UK, the                     three scenarios:
                               Committee on Climate Change has advised
                                                                                          • A 50/50 split between consumption
                               the government to reduce territorial
                                                                                             and production, which leads to a 30%
                               emissions by 61% from 1990 levels. For this
                                                                                             reduction in consumption related
                               report we’ve rounded this down to 60%.
                                                                                             GHG emissions;
                               It’s important to note that this                           • A 70/30 split between consumption
                               scenario should be considered                                 and production, which leads to a 42%
                               a conservative estimate of the                                reduction in consumption related GHG
                               contribution required to uphold the                           emissions; and
                               Paris Agreement i.
                                                                                          • A 30/70 split between consumption
                                                                                             and production, which leads to a 18%
                                                                                             reduction in consumption related
                                                                                             GHG emissions.

                               i
                                     K carbon budgets are currently aiming for 2 degrees and will need to be strengthened to achieve the
                                    U
                                    ‘well below’ 2 degrees target.
                               ii
                                     he analysis is based on projected food consumption in the UK, which includes a mix of imported goods
                                    T
                                    and domestic production. For formal accounting purposes, the emissions reductions related to imported
                                    food would be accounted for in the exporting countries, whereas the emissions reductions of domestic
                                    food production would be accounted for across the economic sectors considered in the life cycle analysis.
Eating for 2 degrees – new and updated Livewell Plates                                                                                        6

                               While our reduction targets were 25%                        Land occupation
                               by 2020 compared to 1990 levels in
                               Livewell: a balance of healthy and                          Apart from global warming, loss of
                               sustainable diets and our LiveWell for                      biodiversity is the other major global
                               LIFE project (in line with WWF’s One                        environmental concern addressed in this
                               Planet Food programme goal), we need                        report. Loss of biodiversity is closely linked
                               to work within the global context of the                    to the conversion of natural habitats, such
                               Paris Agreement when developing our                         as tropical rainforest being cleared for
                               new Livewell Plates. We’ve also included                    agricultural land. The world’s forests and
                               a scenario approach in the hope that it’ll                  other natural habitats are also important
                               start a discussion on how best to approach                  carbon sinks.
                               the split between consumption and                           Our model works on the basis that the
                               production in achieving the reductions                      adoption of the Livewell Plates brings no
                               we need.                                                    increase in land converted for agriculture
                                                                                           – in particular grassland and cropland,
                                                                                           and especially in vulnerable regions such
                                                                                           as Latin America and Southeast Asiaiii. The
                                                                                           projected growth in the world’s population
                                                                                           means that the share of available
                                                                                           agricultural land for each individual will
                                                                                           decrease over time.

                               iii
                                      est PC, Gerber JS, Engstrom PM, et al. (2014) Leverage points for improving global food security and the
                                     W
                                     environment. Science (80-. ). 345, 325–328.

                                                                                                                                                  © Sarah Halevy
Eating for 2 degrees – new and updated Livewell Plates 7
Foreword
When we first started working on sustainable diets
in 2010, we were told it was confusing and even
impossible to define a diet that linked health and
environmental outcomes.
We questioned this perceived wisdom, and And we want to continue to illustrate that
after speaking with leading academics we sustainable diets are appropriate for all
decided to see what we could do. This lead to age groups across the globe. So we hope to
Livewell – a healthy, sustainable diet that’s develop additional Plates. This may well
good for people and the planet. Livewell include one for infants and primary school
was based on the government’s own healthy children as well as country specific Plates in
eating advice, the Eatwell Plate, and the global North and South.
demonstrated how a nutritious diet that can
also lead to a reduction in carbon emissions This work is about more than what we
from the food supply chain. eat. It is about linking consumption to
production. That’s why we advocate the role
Since then sustainable diets have moved of credible certification – including MSC/
up the agenda. It’s no longer niche. Eating ASC, RTRS and Fairtrade – as a way to
Duncan Williamson Better champions coordinated civil society identify how our food has been produced.
Food Policy Manager, WWF work; the Eat Foundation has arrived and We need to respect the rights of workers
joined us in the call to make sustainable as well as ensure that sustainable diets are
diets mainstream. We have The Protein available, accessible and affordable for all
Challenge 2040 and the World Resource people. We need producers to get involved
Institute’s work on sustainable diets. Even and recognise that this agenda supports
retailers and the food service sector are their long-term goals.
taking an active role – just look at Sodexo’s
Green and Lean offer! That’s why we need the UK government
to engage. It is not about nanny stateism
External development and feedback from (after all the government has a hand in
expert stakeholders – including farmers, all our food decisions from farming and
business leaders and health experts – fishing policy, to taxes, nutritional advice
meant it was time to update our Livewell and public procurement). It about joined
work. When identifying the environmental up policy making that puts health and
constraints for the research it was clear sustainability at the heart of our food,
to us that the basic tenet would have to be farming and fishing industries. With
the Paris Agreement. We’ve also included Brexit we have a unique opportunity to
water and land metrics for the first time. refresh the food sector to deliver health
And we’ve looked at diets for different ages: and environmental outcomes. This is a
adults, teenagers and the elderly. We’ve new frontier for UK food. We know diets
even produced a Plate for vegans. This cross boundaries, we’ve seen the spread the
shows the flexibility of sustainable diets. We western diet and its associated problems.
can eat a huge variety of dishes, including Now’s the opportunity for the UK to lead the
meat and cake if we so wish. way delivering a sustainable food system.
Of course, our work doesn’t stop here. We’ve had a lot of support developing
As policy, science and evidence progress, this work. Thank you too everyone who
we’ll include further nutritional and participated in our expert consultation,
environmental constraints to our research. we have taken your advice on board. And
From an environmental point of view, the a special thank you to Tara Garnett,
Plates presented in this report illustrate the Wendy Russell and Tim Lang for reviewing
absolute minimal dietary changes needed this work.
to reach a 2 degree target. We need tighter
environmental constraints if we want to
reach the well below 2 degrees target, or
even the aspirational 1.5 degree target.Eating for 2 degrees – new and updated Livewell Plates 8
Executive Summary
Overview Background
This paper is a summary of the research Globally, 20% of total direct carbon
carried out in 2016 by Blonk Consultants emissions are from food and agriculture.
to update WWF’s work on sustainable food When land-use change is factored in, this
consumption. Our Livewell work started figure rises to 30%. Around 70% of all fresh
in 2010 in response to scientific evidence water withdrawn is used for agricultural
demonstrating the need for a systemic irrigation, which in many cases has a major
approach to a sustainable food system. impact on water quality. And agriculture is
In 2011, we published our first Livewell the most significant cause of deforestation
report Livewell: a balance of healthy and – and hence loss of biodiversity – around
sustainable food choices, which included the world.
the Livewell Plate.
What we eat and how it’s produced have
Livewell Plates are representative consequences for the whole planet. By
diets that meet national nutritional changing our diets and by improving
requirements while reducing the production efficiency in the food system
environmental footprint of the food we can make a major contribution to
system that produces them: they’re the environmental performance of the
diets that are good for both people food system. Indeed, now that the Paris
and planet. Agreement is in force we have binding
commitments to reduce carbon emissions,
The research presented in Eating for and in the UK, the Committee on Climate
2 degrees aimed to produce updated Change has advised the government to
versions of the Livewell Plate by using reduce territorial emissions by 61% from
additional environmental criteria – such as 1990 levels by 2030. For this report we’ve
water use and land footprint – and to rounded this down to 60%.
produce individual Plates for four separate
groups: adults, adolescents, the elderly and Changes in the food system will have to
vegans. Whereas the original Livewell Plate be part of the solution, and this report
was for adult women only, each Plate assumes the food sector needs to make
presented here is an average Plate for each the same level of contribution as the rest
demographic. They include the latest of the economy as a whole. Mitigation
nutritional data, environmental metrics and efforts can be divided between producers
an estimate of costs; and are compared to and consumers, and – while we’ve also
current average diets for each demographic. explored other proportions – we’ve based
our modelling on a 50/50 split. Our core
Historical changes in eating habits analysis focuses on consumption.
since 1961 are also analysed and the
consequent health and environmental
impacts are mapped.
As will be described in detail below,
Blonk Consultants found that it’s indeed
possible to eat a sustainable, nutritious
diet that contributes to the future health
of the planet and its population, without
significant increases in costs.
Globally, 20% of total direct
carbon emissions are from food
and agriculture.Eating for 2 degrees – new and updated Livewell Plates 9
Process The goal was to create Livewell Plates
whose composition was as close as possible
Blonk Consultants carried out the analysis to the current average diet for each group
using Optimeal 2.0, a bespoke optimisation in the UK. A range of other metrics – from
tool that uses quadratic programming. cost to blue water footprint – was also
In simple terms, it works by taking the detailed in each case.
overall nutritional requirements of a given
group, then finding a division of food Results
products that will meet these needs while
We updated the 2020 Plates and created
also respecting various environmental
four new Livewell Plates for 2030. All
constraints agreed by the research team
the Plates meet national nutritional and
(limited carbon footprint in line with
environmental needs, without significant
national reduction targets, equal individual
cost increases.
shares of the world’s current agricultural
land, and so on). A detailed account is While each of the Plates is different
given below. and is described individually below, it’s
possible to make some general points on
A great amount of rigour was required
their composition.
when creating the databases on which
the optimisation process depends. From Carbon footprint
creating food product groups to calculating
First, the carbon footprint of the average
nutritional outputs and the environmental
diet has reduced considerably since 1990 –
footprints of product life cycles, our
almost exclusively through improvements
researchers used a wide range of approved
in production. When nutritional
sources to build realistic and measurable
requirements alone are fed into the
solutions that reflect the complex and
Livewell Plate model, the carbon footprint
interlinked nature of today’s food system.
of each diet falls further. The vegan Plate
has the lowest carbon footprint of all.
Breakdown of carbon footprint (GHG emissions) of the current UK diet and adult Livewell Plates
6
5
Carbon footprint (kgCO2eq/day)
4
3
2
1
0
Current diet Livewell 2020 Livewell 2030Eating for 2 degrees – new and updated Livewell Plates 10
Changes in diet The maximum limit of 5% of total energy
Notable increases are clear in meat from added sugar set by the Scientific
replacers (such as soy and Quorn); Advisory Committee on Nutrition proved
legumes, nuts and oilseeds; fats and challenging and caused a a significant
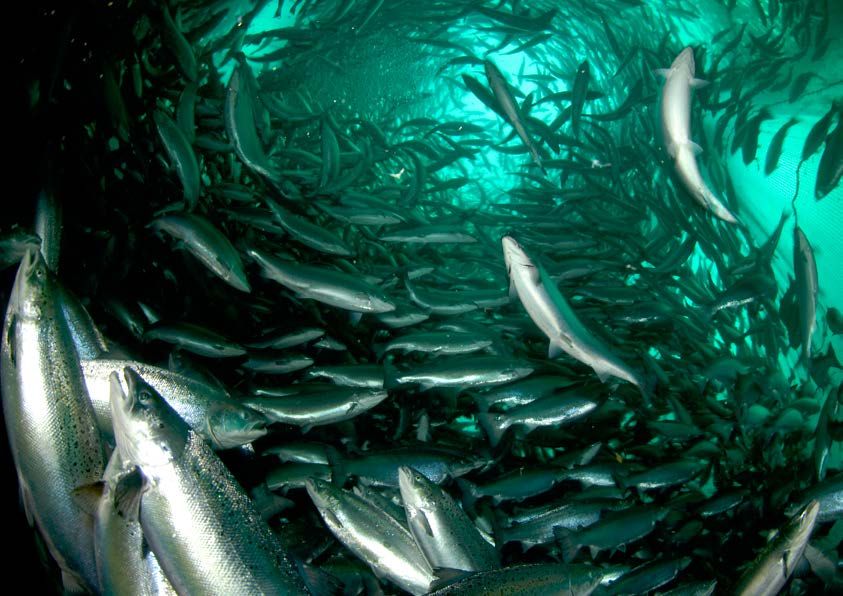
oils; vegetables; and aquaculture fish. reduction of sugar and confectionery. But
Fish is nutritionally important, but for there is an increase of food in the snacks,
environmental reasons the optimisation desserts and other food category. It’s
model didn’t permit an increase in wild- important to note here that in spite of
caught fish. Aquacultured fish, like salmon, the UK government’s levy on the sale
is therefore increased in order to meet of sugary drinks (to be implemented by
the Eatwell Guideiv requirement of two April 2018) and a target to reduce the
servings of 140g of fish per week. The types amount of sugar in food products by 20%,
of fish in the Livewell Plate are all available a large amount of hidden added sugar
with either a Marine Stewarship Council remains in our everyday products. This will
(MSC) or Aqualculture Stewarship Council need to be tackled if we want to reduce the
(ASC) label. overall amount of sugar we consume on a
daily basis.
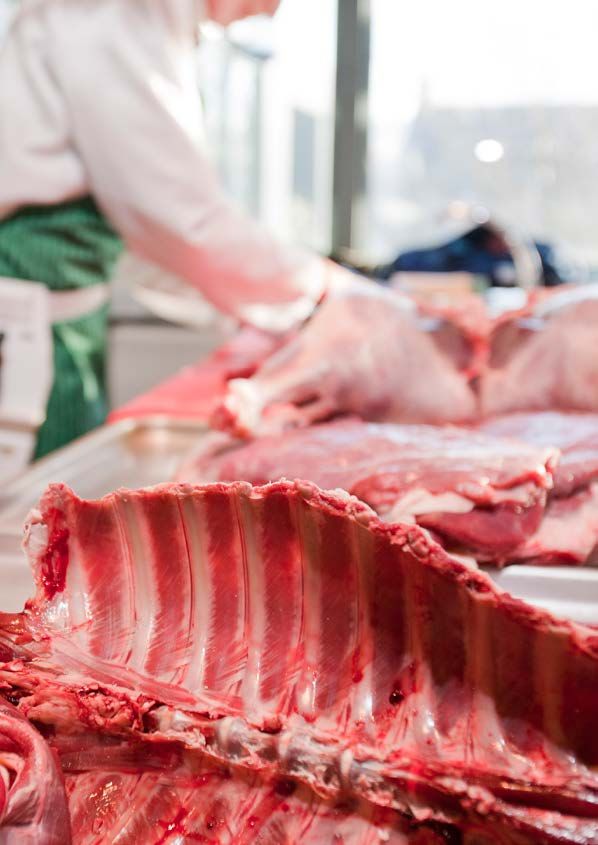
The most obvious difference between
all Livewell Plates and current diets is It’s also important to remember that
a significantly lower amount of meat, every change on our plates has real-world
particularly lamb and beef. Both meats consequences, and the results reflect how
have a high carbon footprint primarily complex this can be. So while reducing
due to the enteric fermentation in the meat consumption means less grassland
gut, leading to methane emissions. is needed for pasture and less cropland is
Reducing other food groups is therefore needed to grow animal feed (such as soy
far less effective. and maize), it may also mean that more
cropland is needed to provide increased
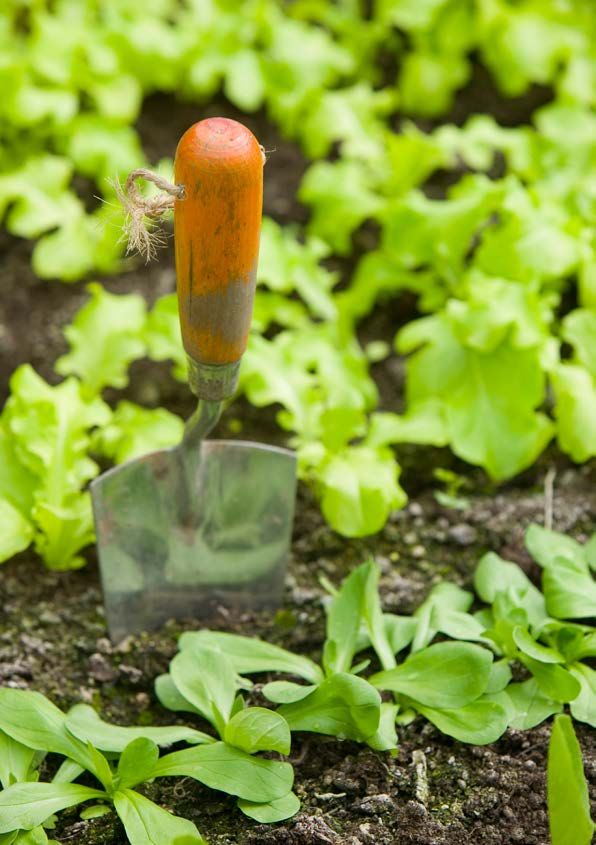
The recommended consumption of poultry amounts of legumes, or vegetable oil.
remains almost stable in the adult Plate These in turn may require increased land
compared to beef, lamb and pork. This is occupation and produce a higher blue water
because it contains fewer saturated fatty footprint – but there’s a huge difference
acids. This and the reduction of poulty in the between repurposing existing agricultural
other Plates support our Livewell principle land and clearing rainforest to create more.
(see below) that people need to moderate In short, all these results need to be seen
their meat consumption - red and white - in their overall context to truly reflect the
and not eat more white meat to compensate complex inter-relationships that define the
for the reduction of red meat. Cheese is consumption and production of food.
reduced, but other dairy - one of the most
important sources of iodine in the UK diet -
remains more or less constant. This was also
the case in the original Livewell Plate for
the UK.
iv
he Eatwell Guide (formerly the Eatwell Plate) is a visual communications tool created by the UK Food
T
Standards Agency to promote nutritionally healthy diets https://www.gov.uk/government/publications/
the-eatwell-guideEating for 2 degrees – new and updated Livewell Plates 11
Current Adult 2030
Current Adolescent 2030
Current Elderly 2030
Current VEGAN 2030
Pie-charts of the composition of the current adult diet (NDNS) and the adult Livewell Plate
for 2030. Amounts are in grams/day.
Please note: Animal protein includes meat, fish and egg; Plant protein includes legumes and
meat replacers; Plant dairy includes soy drink and soy yoghurt; Carbohydrate includes grains
and grain-based products, starchy roots and tubers, and sugar and confectionery.Eating for 2 degrees – new and updated Livewell Plates 12
Cost To achieve our vision of a sustainable food
There are small cost increases in Livewell system, we call on:
Plates in comparison to the current diet,
• The UK government to request advice
which are mainly due to higher amounts of
from the Committee on Climate Change
healthy products like fish and vegetables.
on setting a goal to reduce emissions
However, it’s possible that the apparent
from the food system, including
increases could be due to under-reporting
overseas emissions resulting from UK
of current dietary habits, which is higher
consumption.
than the suggested cost increase. Although
this is an approximation and there’s • The UK government to develop healthy
no clear indication that those on lower eating advice (in the form of the Eatwell
incomes couldn’t afford Livewell Plates, Guide) that incorporates sustainability.
it’s important to note that food costs are
predicted to go up over time, with costs • The UK government to develop an
for high input foods – such as those based integrated food policy with a centralised
on animal feed – rising faster and further responsibility for implementation.
than those for the low-impact foods in the
• The farming and processing sector to
Livewell diet.
develop a demand-led strategy to increase
Historical trends consumption of fruit and vegetables,
In terms of historical trends since 1961, support improved consumer health, and
the results are mixed. An increased deliver growth for the UK horticulture
availability of calories is very likely to and potatoes sector.
have been responsible for an increase in • Retailers and the food service sector to
obesity, while a shift from animal fats reformulate recipes and develop menus
to vegetable oils and an increase in fruit that will increase the range of food
consumption are both positive trends. products that contain fruit and vegetables
Composition of diet hasn’t had significant – particularly ready-to-go products and
environmental effects, but there has been ready meals.
a dramatic improvement in production
efficiency leading to a considerably reduced Through our own work, partnerships
carbon footprint. The production system and involvement with various
continues to have an important part to coalitions, we welcome the chance to
play in the overall mitigation effort, while work with the horticulture, farming
consumption lags behind. and fishing industries; the UK
government; and corporate partners
Next steps to deliver this path to 2 degrees
Food is at the heart of many of the key and to explore other scenarios and
environmental issues WWF works on; mitigation potential. Adjustment and
that’s why helping to develop a sustainable innovation within these sectors will
food system is one of WWF’s priorities. enable farmers and food businesses
We believe the findings in this report to set the UK on the path to become a
support our six Livewell principles as the leader in delivering sustainable diets.
basis of a sustainable diet and a well-
functioning food system. Together with
key stakeholders we’ll use this report to
shape policymakers’ thinking around our
food system. We’ll continue to work with
corporate partners to support sustainable
consumption through innovative and
far-reaching partnerships. And we’ll work
to strengthen the case linking food, feed,
nutrition and biodiversity.Eating for 2 degrees – new and updated Livewell Plates 13
Livewell principles
Eat more plants Eat a variety of foods
Enjoy vegetables Have a colourful plate.
and whole grains.
Waste less food Moderate your meat
One third of food produced
for human consumption is consumption, both red
lost or wasted.
and white
Enjoy other sources
of proteins such as
peas, beans and nuts.
Buy food that meets Eat fewer foods high
a credible certified in fat, salt and sugar
standard Keep foods such as cakes,
sweets and chocolate
Consider MSC, as well as cured meat,
free-range fries and crisps to an
and fair trade. occasional treat. Choose
water, avoid sugary drinks
and remember that juices
only count as one of your
5-a-day however much
you drink.Eating for 2 degrees – new and updated Livewell Plates 14
Glossary, acronyms
and abbreviations
AFP: Agri-footprint®, a database with GHG: Greenhouse gas
environmental impacts of agricultural GHG emissions: Greenhouse gas
products emissions (environmental indicator for
ALA: Alfa-linoleic acid (essential omega-3 climate change), includes direct emissions
fatty acid) IPCC: Intergovernmental Panel on
EAG: Estimated average energy Climate Change
requirement Kg CO2 eq: kilo of carbon dioxide
EFSA: European Food Safety Authority equivalent. This is a standard unit
Blue water footprint: sum of the converting greenhouse gas emissions to
amount of freshwater consumed to irrigate measure carbon footprint
crops and grassland during the whole life LCA: Life cycle assessment
cycle of a product (indicator of water stress Life cycle inventory: data required in
with a high level of uncertainty) LCA models
BSE: Bovine spongiform encephalopathy Linear programming: a mathematical
CHD: Coronary heart disease optimisation technique that finds the
COMA: Committee on Medical Aspects optimal combination of foods within
of Food and Nutrition Policy a set of constraints (such as nutrient
requirements)
Composite food: is a product that
contains more than one food group. Land occupation (environmental
Defined in European Union legislation indicator): square metres of land used in
as a “foodstuff intended for human the production of a food, irrespective of the
consumption that contains both processed type of use
products of animal origin and products of Land-use change: the conversion of
plant origin and includes those where natural habits such as rainforest into
the processing of primary product is agricultural land; a process responsible for
an integral part of the production of the the release of CO2. Also known as indirect
final product” greenhouse gas emissions
COP21: Conference of the Parties number m2a: land use measurement in LCA,
21 which took place in Paris in December measuring area used multiplied by time
2015 it’s used
DHA: Docosahexaenoic acid (omega-3 NDNS: National Diet and Nutrition Survey
fatty acid from fish) Optimeal: diet optimisation tool
ECFCD: EFSA Comprehensive Food developed by Blonk Consultants
Consumption Database PHE: Public Health England
EFSA: European Food Safety Agency PEF: Product environmental footprint
EoL: End of life Quadratic programming: a
EPA: Eicosapentaenoic acid (omega-3 fatty mathematical optimisation technique that
acid from fish) finds the optimal combination of foods
EU: European Union within a set of constraints relative to a
starting point (such as current diet)
Fair share: equal share for all world
citizens – in this context, of a global RNIs: Recommended nutrient intakes
environmental impact SACN: Scientific Advisory Committee on
FAO: Food and Agricultural Organisation Nutrition (UK)
of the United Nations SAFA: Saturated fatty acids
FBS: Food balance sheets© Global Warming Images / WWF
Eating for 2 degrees – new and updated Livewell Plates                                                                      16

                               Introduction
                               The original Livewell project started in 2010 in response
                               to scientific evidence demonstrating the need for a
                               systemic approach to a sustainable food system. In 2011,
                               WWF published its first Livewell report, Livewell: a
                               balance of healthy and sustainable food choices. The
                               report included a Livewell Plate for the UK – a visual
                               representation of a diet that is good for both people and
                               the planet. The Plate was an adaptation of the UK Food
                               Standards Agency’s Eatwell Plate which illustrates the
                               proportions of major food groups to be included in a
                               healthy diet.(1,2)

                               This initial report was followed by            • Chapter 3 gives a brief overview of the
                               LiveWell for LIFE – a €2.1 million               methodology applied in modelling the
                               European Commission-funded project               Livewell Plates; and
                               which aimed to demonstrate how a healthy,      • Chapters 4 and 5 present the results and
                               sustainable diet can help us achieve a           the conclusions.
                               25% reduction in GHG emissions (in line
                               with our One Planet Food Programme at          Interested readers may wish to refer
                               the time) from the European Union (EU)         to the annexes for more details on the
                               food supply chain. The project looked at       methodology used:
                               health, nutrition, carbon and affordability,
                                                                              • Annex 1 provides details on how the
                               and developed Livewell Plates for three
                                                                                environmental reduction requirements
                               EU member states – the project’s pilot
                                                                                for GHG emissions and land occupation
                               countries France, Spain and Sweden.(3)
                                                                                were derived;
                               The Livewell work(4,5) was very successful     • Annex 2 contains the background
                               in putting the topic of sustainable diets        of nutritional data and nutrient
                               on the agenda of governments, food               requirements used in modelling;
                               companies and health organisations, as
                                                                              • Annex 3 provides information on the
                               well as demonstrating that it’s possible
                                                                                methodology and data applied in the
                               to incorporate sustainability in dietary
                                                                                calculation of environmental impacts of
                               recommendations.
                                                                                foods included in the diets;
                               Building on this success and the recently      • Annex 4 contains technical details on the
                               produced Eatwell Guide(6) WWF decided            settings applied in the optimisation of
                               it was time to produce an update of its          Livewell Plates;
                               Livewell Plate, including more material on
                                                                              • A nnex 5 is a report capturing the key
                               environmental impacts like deforestation
                                                                                 comments and recommendations put
                               and freshwater use. They selected Blonk
                                                                                 forward by WWF’s stakeholders at
                               Consultants to perform the diet modelling
                                                                                 their Livewell meetings in London and
                               required for these updates, and the results
                                                                                 Edinburgh in February 2017; and
                               are presented in this report.
                                                                              • Annex 6 provides an overview of how our
                               The report has the following structure:
                                                                                current food system links to key WWF
                               • Chapter 2 presents the main research         policy areas: water, forest, seafood, meat
                                 questions addressed in the project;            and soy.
Eating for 2 degrees – new and updated Livewell Plates 17
Objectives and
research questions
WWF’s Food Programme aims to reduce the global
environmental and social impacts of food production and
consumption. GHG emissions, water use and biodiversity
loss are the most significant challenges. To meet global
demand for food and reduce our food footprint we need
to look at the whole food system, including production
efficiencies and the types of food we eat.
This most recent project is an update and change, land occupation, by type of
extension of the previous Livewell work agricultural land use, and freshwater
developed for the UK. The main objectives consumption (blue water footprint);
of our research were to: • Show how the composition of the Livewell
• Extend the analysis of food consumption Plate depends on how the mitigation
to include drinks; effort is divided between reduction
• Revisit and update the original Livewell requirements for food consumption and
Plate for the UK; food production: 50/50, 30/70 or 70/30;
• Include additional environmental • An estimate of diet costs based on current
metrics, such as water use and prices in mid-range supermarkets;
land footprint; • A comparison with the Eatwell Guide,
• Create additional Plates based on specific aiming for a 30% reduction in
dietary needs; and GHG emissions; and
• Calculate the cost of the revised • Explore how eating habits have changed
Plates relative to the current diet. since the 1960s, map the health and
environmental impacts of these changes,
In close cooperation with WWF, we further and compare with changes as suggested
defined the scope of this research project. in Livewell Plates.
For instance, for water use and land
footprint there are common metrics in By performing these tasks, we aimed to
the life cycle assessment (LCA) answer the following research questions:
methodology such as blue water footprint 1 Can we develop Livewell Plates that
(fresh water use), land-use change, and respect national climate change
land occupation. We agreed which to mitigation commitments, stop
include in our environmental impact deforestation and reduce the impact
assessment and how to weigh their of freshwater consumption at the
importance, taking into account data same time?
quality and the limitations of each 2 Is it possible to reproduce the carbon
methodology. This meant we were able to footprint and size of the segments of the
formulate the following additional tasks: Eatwell Guide?
Develop or update Livewell Plates 3 A re the Livewell Plates still affordable
for the UK with the latest nutritional for people with lower incomes?
data, including: 4 Can we show how eating habits have
• Age groups: adults (aged 18-64), changed since the 1960s, and explain
adolescents (aged 10-17), elderly (aged how this might have influenced both
65-84) and vegans (aged 18-64); health and environmental impact?
• Agreed metrics for carbon footprint, How do the trends compare with those
land footprint and water footprint: suggested by Livewell? Has a change in
respectively direct GHG emissions and food consumption contributed to lower
indirect GHG emissions by land use GHG emissions?Eating for 2 degrees – new and updated Livewell Plates 18
Methodology overview
The Livewell Plates presented in this report were
developed with the help of the Optimeal 2.0 optimisation
tool(10,11), applying a technique called quadratic
programming. The main concept – and how it contributes
to the creation of healthy and sustainable Livewell Plates –
is explained below. A more comprehensive description of
the methodology is given in the annexes.
Steps in deriving healthy and sustainable diets by optimisation
CONSUMERS CONSTRAINTS FOOD PRODUCTS
• Adults • Environmental • Environmental data
• Adolescents constraints • Nutritional data
• Elderly • Nutritional requirements • Product categories
• Vegans • Fish
CURRENT DIET
• S ources of information on
food consumption (NDNS
and ECFCD)
OPTIMISATION
• Technique
• Calibration
RESULTS
Optimised diet
Figure 1: Steps taken in the optimisation process of Livewell Plates.
Consumer groups Environmental constraints
The following environmental impacts were
Whereas the original Livewell Plate was
taken into account in creating the new
for adult women only, the Livewell Plates
Livewell Plates. These were included as
here were developed for adults (aged 18-
constraints in the optimisation process:
64), adolescents (aged 10-17), elderly (aged
65-85) and vegans (adults). Each group has • GHG impact without land-use change,
specific nutritional requirements, so we or carbon footprint;
tailored their Livewell Plates accordingly. • Total land occupation;
Each represents an ‘average’ diet, making
no distinctions for gender or activity level. • Grassland occupation; and
• Cropland occupation.
Constraints
Together, the different land occupation
The optimisation process requires
metrics give a good indication of potential
quantifiable targets that define a healthy
loss of biodiversity. Land occupation and
and sustainable diet. These are referred
land transformation are key drivers of
to as constraints or boundaries, and
biodiversity loss(12). An increasing amount
include upper boundaries (maximum)
of land used to grow food for the diets in
and lower boundaries (minimum). The
the UK would increase loss of biodiversity
environmental reduction requirements are
directly by higher land occupation
upper boundaries, which mean that they
and indirectly by a higher risk of land
need a solution which stays below them.
transformation.
The nutritional boundaries can be either
lower or upper depending on the nutrient.Eating for 2 degrees – new and updated Livewell Plates 19
An overview of the environmental land-use change) for the UK resulted in a
constraints used for the Livewell Plates direct emission equivalent of 152 MtCO2 in
is shown in Table 1. 1990(16)not just the emissions from the UK
Table 1: Environmental
food chain that arise in the UK. The study
reduction requirements 1990 2020 2030 comprises an audit of the GHG emissions
for Livewell Plates for limit limit arising from the UK food economy and an
2020 and 2030 Total carbon examination of the scope for substantial
footprint 117.9 106.5 reductions of these emissions. The aim of
(MtCO2) 152 (-23%) (-30%) this short and preliminary study conducted
Individual over a few months in 2009 is to stimulate
carbon debate about the full GHG impact of the
footprint UK food chain and the scope and options
(kg CO2eq) 4.77 4.09 for reducing GHG emissions in line with
Land wider climate change policy. The study is
occupation theoretical, in effect a thought experiment
(m2*a) 17.7 16.1 based on detailed inventories of emissions
Grassland and the use of LCA or 7.28kg CO2e/day per
(m2*a) 12.1 11.1 UK citizen.
Cropland
After applying the 50% share to the
(m2*a) 5.0 4.6
overall target of -60%, we derive a
Other environmental metrics that are reduction requirement of -30% for UK
measured but not used as limits in the food consumption in 2030: 106.5 MtCO2e.
optimisation are the blue water footprint The intermediate target for 2020 is 117.9
and the carbon footprint including land-use MtCO2e, assuming a linear reduction path
change. Both metrics are harder to interpret of 11.4 Mt per 10 years. This is the basis for
the limits shown in Table 2 under Results.
50/50
and to set limits on. The blue water footprint
is actually a measurement of all freshwater
For the 2030 scenarios explained above,
(tap water and irrigation water) used during
we’ve assumed that the food system
a product’s life cycle. It does not explain
should contribute at the same level as
the impact of this use. To understand this
the economy-wide average. We’ve also
impact the local water scarcity situation
assumed that food consumption and food
should be taken into account. The carbon
production should contribute equally
footprint of land-use change is an indicator
(50/50) to the reduction of GHG emissions
of what happened over the past 20 years:
in the food system. Alternative shares were
it can be used in examining current land
30/70 and 70/30. All the scenarios meet
transformation practices but not to analyse
food consumption future developments.
the requirements presented in Table 1.
and food The reduction requirements and the
Limits for land occupation
production limits for each indicator are further We’ve made the assumption that Livewell
should contribute explained below. Plates should not increase global
agricultural land occupation, nor promote
equally (50/50) to Reduction of GHG impact (carbon a shift from grassland towards more
the reduction of footprint) cropland. However, because a diet consists
of raw materials sourced from all over the
GHG emissions in
To keep the average global temperature
rise well below 2 degrees – as agreed at world, it’s very difficult to define national
the food system. COP21 – the Committee on Climate Change limits for land occupation per individual.
has advised the UK government to reduce Instead, we divided all currently available
territorial emissions by 61%, but as stated agricultural land equally between all world
above we’ve rounded this down to 60%. citizens living in 2020 and 2030, to obtain
This forms the basis of the reduction an equal share of total agricultural land,
requirements for the UK Livewell Plates grassland and cropland for everybody.
for 2020 and 2030.
Nutritional requirements (defining
As established in How low can we go? An upper and lower limits)
assessment of greenhouse gas emissions Each age group has its own estimated
from the UK food system and the scope average energy requirement, recommended
for reduction by 2050, we estimate that nutrient intakes (RNIs) and safe upper
the supply of food and drink (excluding limits for nutrients. These are defined byEating for 2 degrees – new and updated Livewell Plates 20
national public health authorities or the • Meat and meat products were subdivided
European Food Safety Authority (EFSA). into beef/veal, lamb, meat replacers,
(See Table 15 in Annex 2 for an overview of poultry, pork, and processed meat. Meat
all nutrient constraints implemented in the replacers include soy and Quorn (this
modelling of Livewell Plates). distinction was made because these
products are very different in nutrient
On top of that the Eatwell Guide provides composition and environmental impact).
guidelines specifying minimum or
maximum amounts of foods recommended • Milk and dairy products were subdivided
for a healthy diet in the UK(6). One example into traditional dairy products such as
is the recommendation to consume at milk and yoghurt, cheese, and dairy
least five servings of fruit and vegetables replacers such as fortified soy drink and
per day. (See Table 16 in Annex 2 for an soy yoghurt.
overview of implemented food-based • F ish and other seafood was subdivided
dietary guidelines). into wild-caught fish and aquacultured
fish. Wild-caught fish was limited to
Together, the upper and lower constraints the current intake in order not to
90% of the in the optimisation model define a healthy
diet. The model will always find a solution
increase overfishing.
world’s fish that meets these requirements, unless Environmental impacts
stocks are fully there is simply no solution possible. The of food products
exploited or
latter was the case for vegans who couldn’t To enable quantification of the
meet the RNI for iodine. The requirement environmental impact of the Livewell
over-fished. was therefore removed from the model Plates, LCA were performed on 79 food
(see Results). products, including both whole foods such
as bread, onions, sugar and potatoes, and
Constraint on fish
processed foods like mayonnaise, cola and
Current fish consumption is below the orange juice. The LCAs were performed
recommended level in the UK. However, by filling existing LCA-models developed
around 90% of the world’s fish stocks are by Blonk Consultants for the Dutch
now fully exploited or over-fished leaving government(22) with country-specific life
little room for expansion under current cycle inventory data which included a mix
management approaches. Consequently, of home produce and imports. Among the
we limited wild-caught fish to the level data sources were AgriBalyse(23), Agri-
of intake found in the current diet. Footprint(24) and FAOSTAT(25). By using
This meant that the extra requirement some of the products as a proxy for other
could only be met by introducing more products, we were able to include 125
aquacultured fish. food products in the calculation of the
Food products in the optimisation
Livewell Plates. As an example, white bread
serves as a proxy for other types of bread
A diet consists of food products, each and pizza, the latter made by combining
with specific nutrient content and sausage, cheese and white bread.
environmental impacts. The goal of the
process is to find a diet with the fewest Nutritional data on food products
possible changes relative to the current The sources of data on the composition of
diet, while meeting all restrictions imposed all foods included in this research were
by the optimisation model. Changes are available from McCance & Widdowson’s(27).
measured in grams of product. However, because it lacked data on chicken
liver and water (tap, still mineral water
Product categories and sparkling mineral water) these were
Food-based dietary guidelines are often adopted from the French Ciqual(26).
given at the level of food groups, so we
used FoodEx, a food classification system Added sugar was included as an extra
developed by EFSA(21), to categorise each property. This included all sugars except
food into a food group. In total we used those in fresh fruit, vegetables and dairy.
26 product groups; where necessary we
added more detail:
v
http://livewellforlife.eu/wp-content/uploads/2013/05/Adopting-healthy-sustainable-diets-report.pdfEating for 2 degrees – new and updated Livewell Plates 21
Current diets activity level, gender and bodyweight of
each subject. Among the groups in this
There are many barriers to adopting study average energy underreporting was
healthier and more sustainable dietsv, between 11% and 28%(29,32) compared to
and we want the Livewell Plates to stay the energy requirements we’ve applied
as close as possible to the current average (see Table 15).
diet. For this report, it meant we needed
a definition of the average current diet in Selection of optimisation algorithm
each age group to serve as a starting point
and calibration
for the optimisations, which we created
using data compiled by EFSA(28) in the In this study we used quadratic
EFSA Comprehensive Food Consumption programming as our optimisation
Database (ECFCD) and National Diet and technique. Previous Livewell Plates were
Nutrition Survey (NDNS) Rolling Program obtained by linear programming(1,3).
Years 1-3(30). Blonk’s optimisation tool Optimeal
provides both options. There are subtle
One point we need to mention here is differences in the outcome of the
underreporting. This is a recognised techniques. Quadratic programming
problem in dietary surveys(31) because all typically makes small changes to almost
other nutrients must be provided within all foods in the diet, whereas linear
the quantity of food needed to fulfill the programming makes large changes in a
energy requirement. Thus if total energy limited amount of foods and leaves the rest
intake is underestimated, it is probable the same. Researchers developing the latest
that the intakes of other nutrients are Dutch food-based dietary guidelines(33)
also underestimated. Under conditions compared the techniques and found
of weight stability, energy intake equals that quadratic programming gave more
energy expenditure, which rely on self- attainable suggestions. This confirms our
reporting of food intake by subjects. own experience(34,35).
Typically subjects are more willing to
report foods perceived as “good” than After importing the data into Optimeal,
those perceived as “bad”. This differential we performed several test runs of the
reporting makes it difficult to correct for optimisation as a sense-check on the
underreporting in estimations of nutrient outcome and to trace potential problems.
intake, as well as in estimations of diet cost We found that some nutrient requirements
and environmental impact. were very difficult or even impossible to
fulfil with the available foods.
We mention this here so readers are
aware of the limitations of the data, and In the case of vegans, the requirement for
understand why the energy content of iodine prevented Optimeal from finding a
Livewell Plates needed to be increased solution. This meant we had to disable the
relative to the current diet. The extent of lower limit for iodine.
energy underreporting can be estimated
A sensitivity analysis on the choice of
by measuring the difference between
algorithm or the impact of variability in
reported energy intake and the estimated
data and constraints was outside the scope
average requirement based on age, physical
of this project.
The goal of
the process is
to find a diet
with the fewest
possible changes
while meeting
the restrictions
imposed.You can also read